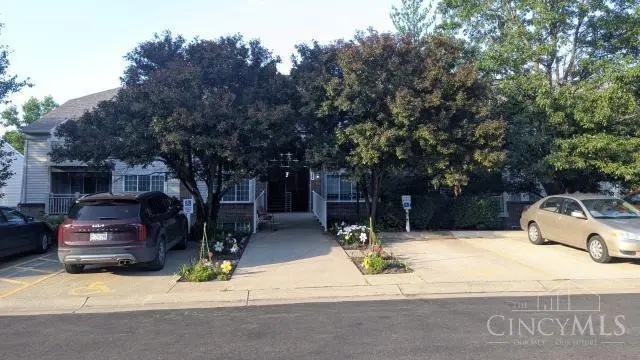
9810 Regatta Dr #107 · Dry Ridge, OH
Flood risk 1/10 · Minimal
- FEMA flood zone
- X (unshaded)
- Chance of flooding over 30 yrs
- 0.0%
- Est. flood insurance / yr
- $507 – $1,088
Fire risk 1/10 · Minimal
- Est. fire insurance / yr
- $713 – $1,323
Heat risk 4/10 · Minor
- Hot days now (above 103°F)
- 7 days/yr
- Hot days in 30 yrs
- 19 days/yr
Wind risk 2/10 · Minimal
- Chance of severe wind over 30 yrs
- 1.0%
Air-quality risk 4/10 · Minor
- Unhealthy air days now
- 4 days/yr
- Unhealthy air days in 30 yrs
- 6 days/yr
Risk factors via First Street. Map © Google.
Why this score? — see what drove the D grade
The composite is a weighted blend of 9 inputs, each scored 0–100. Each bar is that input's sub-score; the figure is the points it added to the 100-point composite (weight × sub-score).
- Cash flow +15.0/30.0
- ARV discount +7.5/15.0
- 1% rule +5.0/10.0
- DSCR +5.0/10.0
- Schools +3.7/10.0
- Livability +3.4/5.0
- Rent growth +2.5/5.0
- Condition / age +2.5/5.0
- Appreciation +0.0/10.0
$1
🖨 Deal sheet 📄 Offer letter ✓ Due diligence
Listing remarks MLS
Beautiful and airy 2 bedroom, 2 full bath condo with walk out to patio and wrap around garden. Well maintained with many updates and convenient location in quiet community with pool. Walkable to Pebble Creek Golf Course and Snows Lake.
Key facts
- $235 HOA
- Built 1993
- Listed 14 days
Property features AI
Finance
- Financial info: Auction: Yes
- HOA & community: HOA present with a monthly fee of $235
Exterior
- Utilities: Public water; Public sewer; Natural gas; Water heater: Other
- Home design: Traditional style; One-level unit with entry on level 1
- Construction: Poured foundation
- Exterior features: Shingle roof; Brick and vinyl siding exterior; Vinyl windows
Interior
- Kitchen: Kitchen approximately 10 x 10
- Bedrooms: Two bedrooms on the main level, each approximately 10 x 10
- Bathrooms: Two full bathrooms on the main level; Primary bathroom with shower
- Heating & cooling: Central air conditioning; Forced air heating
- Interior features: Five total rooms
Neighborhood map
What this means for you Summary
Snapshot
- This is a 2-bed/2.0-bath condo listed at $1.
Deal economics
- At list price, monthly cash flow is $1k ($16k/yr) — positive.
- The deal already cash-flows at list — no discount required.
- Meets the 1% rule at list price ($2k rent vs $1).
Location & tenants
- Location reads 67/100 on livability (#625 in OH) — a middle-class / working-renter tenant base. Strengths: crime A+, employment A+, cost of living A+; Watch: schools D+, amenities F, commute F.
- Northwest Local (suburban): math 38% / reading 46% proficiency, ranked #508 of 656 in OH (top 77%) — families likely to look elsewhere, expect single-tenant / working-renter base with shorter leases.
- Market conditions: 11 active listings in the ZIP; 4 comparable units currently listed for rent nearby; rentals at typical pace (median 20d on market — plan ~3-4 weeks tenant-placement turnaround); solid renter incomes; 801 units permitted in Hamilton County in 2024 (190 in 5+ unit buildings).
Forward outlook
- Local home prices are declining (-3.0%/yr); year-one equity from $0 of loan paydown is wiped out by about $0 of value loss. Plan a longer hold.
- At projected returns (-3.0% appreciation + 3.0% rent growth), your $0 cash investment doubles in ~1 year — after that, you're playing with house money.
Negotiation context
- Only 14 days on market — expect competitive offers; lowballing is unlikely to land.
- 6 sale attempts since 27y ago with the ask held roughly flat each time — persistent listings suggest the price (not the market) is what's stuck; bring a comps-based counter.
Questions for the listing agent
- What does the HOA fee cover, when was the last increase, and are there any pending special assessments or reserve-fund shortfalls?
- Any open or pending special assessments — roof, HVAC, plumbing, elevator, façade? What's the per-unit balance and payoff schedule, and is the seller paying it off at close or rolling it to the buyer?
- Is there a deadline driving the sale (1031 exchange, divorce, estate, relocation)? That informs how much negotiation room exists.
- Schools are D-rated, which usually means shorter tenancies and higher turnover. Who's the typical renter profile here, and what's been the actual vacancy rate?
- The area grade is low — what's the realistic commute time and amenity access for the typical tenant pool here? Any planned neighborhood developments (good or bad) we should know about?
- What's the average days-on-market for RENTAL listings here right now (not sales)? A rising rental-DOM trend means longer vacancies and softer asking-rent achievability than the comps imply.
- What's the recent tenant-quality profile in this submarket — average credit score on applications, eviction rate, late-payment / NSF rate, and stable-employment percentage? A property-management company in the area should have these aggregated.
- How much new apartment / multifamily construction is in the pipeline within 1–3 miles? Heavy new supply (>2% of stock underway) typically softens rents 12–24 months out; light construction supports rent growth.
Investment metrics
- 1% rule
- 202349.00% ✓
- Cap rate
- 1636266.52%
- Cash-on-cash
- 5843786.53%
- DSCR
- 260016.62
- GRM
- 0.0
CMA / ARV
No comps found within radius.
Projected returns pro-forma
-3.0% appreciation · 3.0% rent growth · sell at horizon
- IRR
- —
- Equity multiple
- 310786.83×
- Total profit
- $87,020
- Equity at exit
- $0
- IRR
- —
- Equity multiple
- 672548.72×
- Total profit
- $188,313
- Equity at exit
- $0
Cash invested: $0 (down + closing). Projections, not guarantees.
Landlord ↔ Tenant lean methodology
- Overall (STATE)
- 73 Landlord-Friendly
- State Ohio
- 73 Landlord-Friendly · R+6
- County
- — inherits STATE
- City
- — inherits STATE
ZIP-level market 45252
- Home prices YoY
- -26.9%
- Active inventory
- 11
Monthly cashflow live
- Estimated rent
- $2,023 medium interval (Pro) →
- Mortgage (P&I)
- −$0
- Tax est. 1.5%
- −$0 /mo · $0/yr
- Insurance
- −$0
- HOA
- −$235
- Vacancy / Maint / Mgmt
- −$425
- Net cashflow
- $1,364
Break-even live
UW: 25.0% down · 7.5% · 30yr · 1.5% tax · 5.0% vac · 8.0% maint · 8.0% mgmt
Financing live
Cash to close
- Down payment
- $0
- Closing costs
- $0
- Reserves months
- —
- Total cash needed
- —
Loan-product check · same deal, 3 products live
Conventional
25% down · 7.5% · 30yr
- Down + closing
- —
- Monthly P&I
- —
- Monthly cashflow
- —
- DSCR
- —
- Eligible?
- —
Personal DTI + credit; lowest rate.
DSCR
20% down · 8.5% · 30yr
- Down + closing
- —
- Monthly P&I
- —
- Monthly cashflow
- —
- DSCR
- —
- Eligible?
- —
No personal income docs; deal must DSCR.
Hard money
10% down · 12.0% · 12mo
- Down + closing
- —
- Monthly P&I
- —
- Monthly cashflow
- —
- DSCR
- —
- Eligible?
- —
Short-term bridge; refi at stabilization.
Rent comps 4 comps
| Address | Beds | Baths | Sqft | Rent | $/sqft | DOM | Units | Dist |
|---|---|---|---|---|---|---|---|---|
| 9939 Voyager Way Cincinnati, OH | 3.0 | 2.0 | 1400 | $2,300 | $1.64 | 43d | 1 | 0.23mi |
| 3683 Ripplegrove Dr Cincinnati, OH | 3.0 | 1.5 | 1395 | $1,931 | $1.38 | 20d | 1 | 0.82mi |
| 10101 Arborwood Dr Cincinnati, OH | 1.0–3.0 | 1.0–1.5 | 912 | $1,336 | $1.46 | 1d | 26 | 1.21mi |
| 9333 Round Top Cincinnati, OH | 1.0–3.0 | 1.0–2.0 | 979 | $1,375 | $1.40 | 2d | 3 | 1.25mi |
HOA detail condo
- Monthly dues
- $235 · $2,820/yr
- Likely covers
- pool
- Assessments
- None detected in remarks — confirm with the listing agent.
Listing history 11 events
-
2026-06-18days on market $1 Active 14 DOM
-
2026-06-17days on market $1 Active 13 DOM
-
2026-06-16days on market $1 Active 12 DOM
-
2026-06-15days on market $1 Active 11 DOM
-
2026-06-13days on market $1 Active 9 DOM
-
2026-06-12days on market $1 Active 8 DOM
-
2026-06-09days on market $1 Active 5 DOM
-
2026-06-08days on market $1 Active 4 DOM
-
2026-06-08days on market $1 Active 3 DOM
-
2026-06-07remarks 392-char remark
-
2026-06-07$1 Active 2 DOM
ⓘ Source: listings_history table (triggers on properties + properties_extension) + one-shot
backfill from property_details.listing_events for pre-trigger history.
Climate risk First Street
- Flood 1/10 Low FEMA zone X (unshaded) · 0% chance over 30 yrs
- Wildfire 1/10 Low
- Heat 4/10 Moderate 7 d/yr ≥103°F today · 19 d/yr by 30 yrs out
- Wind 2/10 Low 100% chance of damaging wind over 30 yrs
- Air quality 4/10 Moderate 4 unhealthy d/yr today · 6 by 30 yrs out
Nearby sold comps map
Loading sold comps map…
Walkable amenities ~0.75 mi
Loading nearby amenities…
Taxation est. · year 1
- Rental income
- $24,282
- − Mortgage interest
- −$0
- − Property taxes
- −$0
- − Insurance
- −$0
- − Repairs & maintenance
- −$1,943
- − Management
- −$1,943
- − HOA
- −$2,820
- − Depreciation
- −$0
- Taxable income
- $17,577
- Est. tax owed @ 24.0%
- −$4,218
- After-tax cash flow
- $12,144/yr
For passive investors: Depreciation is non-cash, so a rental often shows a tax loss while cash-flowing — sheltering income. Rental losses are passive: they offset passive income freely, and up to $25,000/yr can offset ordinary (W-2) income if you actively participate and your MAGI is under $100k (phasing out to $0 by $150k); unused losses carry forward. On sale, claimed depreciation is recaptured at up to 25%, and gains may owe capital-gains tax (a 1031 exchange can defer both). Figures are a year-1 estimate at your 24.0% rate — not tax advice; consult a CPA.
Schools (NCES district)
- District
- Northwest Local
- NCES district ID
- 3904736
- Math proficiency
- 38% ▼ -18.00%
- Reading proficiency
- 46% ▼ -10.00%
- Median HH income
- $58,765
- Composite
- 36.97/100
- National rank
- #4528
- State rank
- #508 of 656 in OH
Livability — Dry Ridge
- Score
- 67/100
- State rank
- #625
- US rank
- #10942
Category grades
Schools grade is shown separately in the Schools card above.
Census & demographics
- Census place
- Dry Ridge, OH
- County
- Hamilton · 838,887 people
- Metro
- Cincinnati, OH-KY-IN
- Population (ZIP)
- 4,941
- Household income
- $96,750
- Rent vs Own
Population outlook (Hamilton County) Hauer SSP2
- Today (2025)
- 826,054 people
- By 2030
- 830,947 · +0.6%
- By 2040
- 832,319 · +0.8%
- By 2050
- 822,428 · -0.4%
- By 2075
- 788,688 · -4.5%
- By 2100
- 710,674 · -14.0%
Race, ethnicity, and origin ACS 2023
- Neighborhood character
- Predominantly White (82%)
- Race & ethnicity
- White 82% Black 15% Two or more races 4%
- Common ancestry
- Estonian 3% Slovak 2% Lithuanian 2%
- Foreign-born
- 4% · Canada
- Languages at home
- 96% English-only · Other Indo-European 1%
Political lean MEDSL · Hamilton
- 2024 margin
- D (+14.9) · D 57.0% · R 42.1%
- 2008→2024 swing
- +7.9pp toward D · 2008: 7.0pp · 2024: 14.9pp
- All cycles
- 2024: D+14.9 2020: D+15.9 2016: D+9.5 2012: D+4.9 2008: D+7.0
Not yet ingested
- Civics
- —
Market trends
- HPI YoY
- ▼ -76.16%
- Current HPI
- 207.2523
- Rent YoY
- —
- Metro
- —
- State GDP YoY
- ▲ 1.98%
- F500 in state
- 48
Industry mix (Fortune 500 HQ in OH)
| Industry | F500 HQs | Revenue |
|---|---|---|
| Insurance | 3 | $145B |
|
||
| Industrial Machinery | 3 | $49B |
|
||
| Financial Services | 3 | $24B |
|
||
| Consumer Goods | 2 | $93B |
|
||
| Aerospace / Defense | 2 | $47B |
|
||
| Utilities | 2 | $33B |
|
||
Price history
+114.6% since first listed12 events — show timeline
- 2026-06-04 Listed $1 Cincy MLS
- 2023-07-12 Relisted — Cincy MLS
- 2023-07-12 Listing Removed — Cincy MLS
- 2023-06-23 Pending — Cincy MLS
- 2023-06-18 Listed $165,000 Cincy MLS
- 2019-06-27 Sold (MLS) $94,400 Cincy MLS
- 2019-05-25 Contingent — Cincy MLS
- 2019-05-24 Listed $91,900 Cincy MLS
- 2002-05-02 Sold (MLS) $85,900 Cincy MLS
- 2002-02-04 Listed $86,500 Cincy MLS
- 1999-06-25 Sold (MLS) $82,000 Cincy MLS
- 1999-03-14 Listed $76,900 Cincy MLS
Cash-flow waterfall
monthlySold comps — $/sqft
last 12 mo · ≤1 miLoading sold comps…