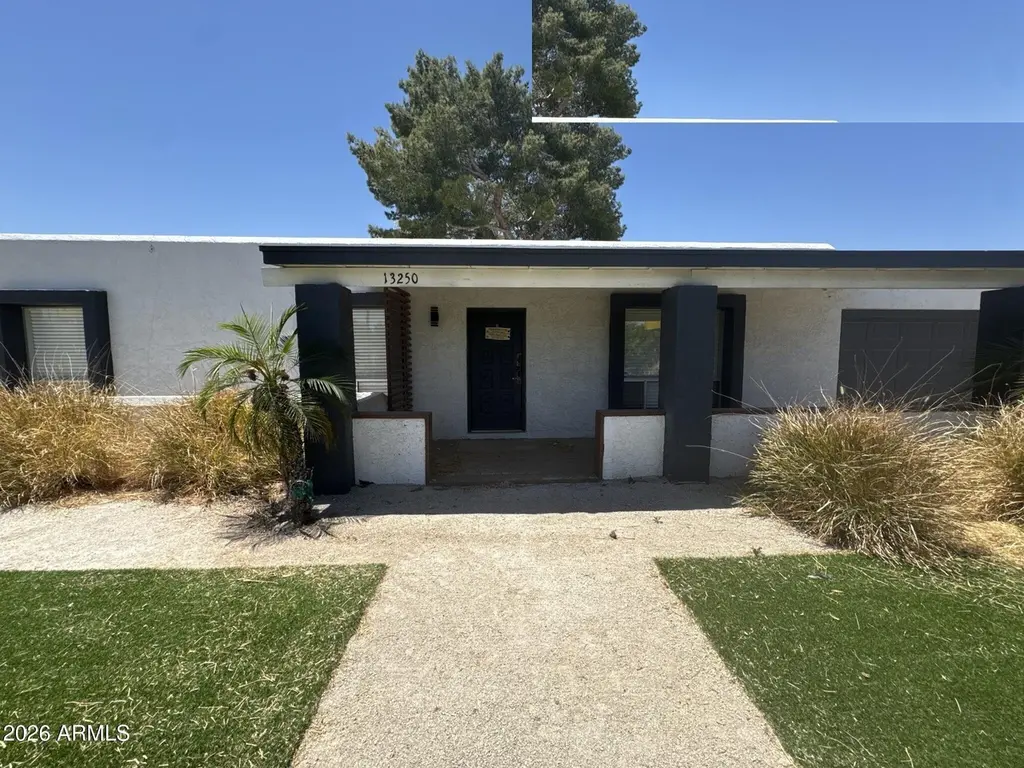
13250 N 11th Ave · Phoenix, AZ
Flood risk 6/10 · Moderate
- FEMA flood zone
- AE
- Chance of flooding over 30 yrs
- 0.67%
- Est. flood insurance / yr
- $1,737 – $8,500
Fire risk 1/10 · Minimal
- Est. fire insurance / yr
- $610 – $1,132
Heat risk 9/10 · Severe
- Hot days now (above 111°F)
- 7 days/yr
- Hot days in 30 yrs
- 19 days/yr
Wind risk 1/10 · Minimal
- Chance of severe wind over 30 yrs
- —
Air-quality risk 3/10 · Minor
- Unhealthy air days now
- 3 days/yr
- Unhealthy air days in 30 yrs
- 4 days/yr
Risk factors via First Street. Map © Google.
Why this score? — see what drove the D grade
The composite is a weighted blend of 9 inputs, each scored 0–100. Each bar is that input's sub-score; the figure is the points it added to the 100-point composite (weight × sub-score).
- Cash flow +15.0/30.0
- ARV discount +7.5/15.0
- 1% rule +5.0/10.0
- DSCR +5.0/10.0
- Condition / age +4.0/5.0
- Livability +3.8/5.0
- Schools +2.3/10.0
- Rent growth +1.8/5.0
- Appreciation +0.0/10.0
$1
🖨 Deal sheet 📄 Offer letter ✓ Due diligence
Listing remarks MLS
Beautifully remodeled home located in great neighborhood in Moon Valley. Three bedroom, 2 bathrooms, 2 car garage with over 12,000 square foot lot. Charming exposed brick fireplace in living room. New tile in bathrooms, vanities, LVP floors, backsplash and quartz countertops. New lighting fixtures and fans. Fresh paint on both interior and exterior. Peaceful backyard with a beautiful tree, lots of shade and mountain views. Near the hiking trails, golf courses and country clubs.
Key facts
- 0.28 acre lot
- 2 garage spots
- Built 1972
Property features AI
Finance
- HOA & community: No association fees
Exterior
- Parking: 2 covered parking spaces; 2 open parking spaces; 2 garage spaces
- Utilities: City water; Public sewer
- Home design: Single family residence; Fee simple ownership
- Construction: Stucco and wood frame construction; Built-up roof
- Exterior features: Block fencing; Grass in front yard; Grass in back yard
Interior
- Kitchen: Laminate countertops; Walk-in pantry
- Bedrooms: Up to 3 bedrooms
- Bathrooms: 2 full bathrooms
- Heating & cooling: Ceiling heating; Central air conditioning
- Interior features: Pantry; 3/4 bath in master bedroom; Laminate counters; Living room fireplace
- Laundry & utility: Washer/dryer hookup only
Neighborhood map
What this means for you Summary
Snapshot
- This is a 3-bed/2.0-bath single-family listed at $1. Condition is rated good.
Deal economics
- At list price, monthly cash flow is $1k ($15k/yr) — positive.
- The deal already cash-flows at list — no discount required.
- Meets the 1% rule at list price ($2k rent vs $1).
- Cap rate 2015436.5% vs local median 3.3% in Phoenix — top-decile yield for the area; either an underpriced asset or a hidden risk that comps aren't pricing in. Stress-test before assuming the spread holds.
Location & tenants
- Location reads 75/100 on livability (#16 in AZ, #3,924 nationally) — a middle-class / working-renter tenant base. Strengths: amenities A+, commute A+, housing A+; Watch: health & safety C-, crime F.
- Glendale Union High School District (4285) (urban): math 23% / reading 31% proficiency, ranked #130 of 249 in AZ (top 52%) — low school quality limits family demand, transient renter base, plan for 1-2y turnover.
- Zoned schools: Thunderbird High School (math 28% / reading 35%, grade F, #109 of 381 statewide, top 29%, 1,540 students, 43% FRL).
- Market conditions: Rents soft (-2.6%/yr); 156 active listings in the ZIP; 19 comparable units currently listed for rent nearby; rentals leasing fast (median 3d on market — plan ~1-2 weeks tenant-placement turnaround); 36,011 units permitted in Maricopa County in 2024 (12,801 in 5+ unit buildings).
- This rent runs 40% of the median local income ($65k/yr) — at the standard rent-burdened threshold; future hikes will face affordability resistance.
Forward outlook
- Local home prices are declining (-3.0%/yr); year-one equity from $0 of loan paydown is wiped out by about $0 of value loss. Plan a longer hold.
- Maricopa County population projected at +38% by 2050 — long-run rental-demand tailwind backs the buy-and-hold thesis.
- At projected returns (-3.0% appreciation + 0.0% rent growth), your $0 cash investment doubles in ~1 year — after that, you're playing with house money.
Negotiation context
- It's been on market 30 days — a 2% lower offer ($0) is reasonable based on typical stale-listing flexibility.
- 3 sale attempts since 4y ago with the ask held roughly flat each time — persistent listings suggest the price (not the market) is what's stuck; bring a comps-based counter.
Risks & watch-outs
- Watch-outs: flood insurance adds $427/mo.
- Climate carrying-cost: in FEMA flood zone AE (mandatory federal flood insurance); extreme-heat days projected 7→19/yr by 2055 (HVAC capex compounding) — expect insurance premiums to compound above CPI over the hold.
Questions for the listing agent
- Built in 1972 — when were the roof, HVAC, electrical panel, plumbing, and water heater last replaced?
- What's the actual annual flood-insurance premium (NFIP or private), and is the property in a SFHA with mandatory coverage?
- Is there a deadline driving the sale (1031 exchange, divorce, estate, relocation)? That informs how much negotiation room exists.
- Crime grade is F in this area — have there been break-ins, vandalism, or insurance claims at this property in the last 3 years? What carrier currently insures it and at what premium?
- The area grade is low — what's the realistic commute time and amenity access for the typical tenant pool here? Any planned neighborhood developments (good or bad) we should know about?
- What's the average days-on-market for RENTAL listings here right now (not sales)? A rising rental-DOM trend means longer vacancies and softer asking-rent achievability than the comps imply.
- What's the recent tenant-quality profile in this submarket — average credit score on applications, eviction rate, late-payment / NSF rate, and stable-employment percentage? A property-management company in the area should have these aggregated.
- How much new for-sale + rental construction is in the pipeline within 1–3 miles? Heavy new supply typically softens prices + rents 12–24 months out; constrained supply supports both.
Investment metrics
- 1% rule
- 212599.00% ✓
- Cap rate
- 2015436.52%
- Cash-on-cash
- 7197965.10%
- DSCR
- 320269.94
- GRM
- 0.0
CMA / ARV
- ARV (on-the-fly)
- $431,480
- Comps found
- 12
Show comp detail 12 sales within ~0.75 mi
| Address | Dist | Beds/Ba | Sqft | Sold | Price | $/sf | Match |
|---|---|---|---|---|---|---|---|
| 1536 W Willow Ave | 0.35mi | 3/2.0 | 1,575 (-2%) | 10mo | $315,000 | $200 | 71 |
| 1326 W Joan DE Arc Ave | 0.10mi | 3/2.0 | 1,797 (+12%) | 9mo | $427,000 | $238 | 68 |
| 1641 W Andorra Dr | 0.50mi | 4/3.0 (+1) | 1,614 (+0%) | 1mo | $429,900 | $266 | 67 |
| 1527 W Windrose Dr | 0.54mi | 3/2.0 | 1,721 (+7%) | 0mo | $585,000 | $340 | 63 |
| 1403 W Wood Dr | 0.17mi | 3/2.0 | 1,805 (+12%) | 13mo | $484,000 | $268 | 61 |
| 1523 W Pershing Ave | 0.35mi | 3/2.0 | 1,390 (-14%) | 2mo | $370,000 | $266 | 60 |
| 1523 W Surrey Ave | 0.37mi | 3/2.0 | 1,460 (-9%) | 10mo | $429,900 | $294 | 59 |
| 1633 W Andorra Dr | 0.48mi | 3/2.0 | 1,708 (+6%) | 12mo | $400,000 | $234 | 58 |
| 1718 W Voltaire Ave | 0.58mi | 4/2.0 (+1) | 1,568 (-3%) | 12mo | $430,000 | $274 | 54 |
| 13425 N 16th Ave | 0.41mi | 3/2.0 | 1,420 (-12%) | 10mo | $450,000 | $317 | 53 |
| 118 W Tam Oshanter Dr | 0.70mi | 3/2.0 | 1,846 (+15%) | 1mo | $552,500 | $299 | 42 |
| 1733 W Surrey Ave | 0.64mi | 3/3.0 | 1,800 (+12%) | 8mo | $375,000 | $208 | 40 |
Match score weights: distance 35% · size 25% · config 20% · recency 20%. Top-matched comps best support the ARV.
Projected returns pro-forma
-3.0% appreciation · 0.0% rent growth · sell at horizon
- IRR
- —
- Equity multiple
- 263811.02×
- Total profit
- $73,867
- Equity at exit
- $0
- IRR
- —
- Equity multiple
- 514994.75×
- Total profit
- $144,198
- Equity at exit
- $0
Cash invested: $0 (down + closing). Projections, not guarantees.
Landlord ↔ Tenant lean methodology
- Overall (STATE)
- 87 Strongly Landlord-Friendly
- State Arizona
- 87 Strongly Landlord-Friendly · R+3
- County
- — inherits STATE
- City
- — inherits STATE
ZIP-level market 85029
- Rents YoY
- -2.6%
- Active inventory
- 156
Monthly cashflow live
- Estimated rent
- $2,126 high interval (Pro) →
- Mortgage (P&I)
- −$0
- Tax est. 1.5%
- −$0 /mo · $0/yr
- Insurance
- −$0
- Flood insurance flood zone
- −$427 /mo · $5,118/yr
- HOA
- −$0
- Vacancy / Maint / Mgmt
- −$446
- Net cashflow
- $1,253
Break-even live
UW: 25.0% down · 7.5% · 30yr · 1.5% tax · 5.0% vac · 8.0% maint · 8.0% mgmt
Financing live
Cash to close
- Down payment
- $0
- Closing costs
- $0
- Reserves months
- —
- Total cash needed
- —
Loan-product check · same deal, 3 products live
Conventional
25% down · 7.5% · 30yr
- Down + closing
- —
- Monthly P&I
- —
- Monthly cashflow
- —
- DSCR
- —
- Eligible?
- —
Personal DTI + credit; lowest rate.
DSCR
20% down · 8.5% · 30yr
- Down + closing
- —
- Monthly P&I
- —
- Monthly cashflow
- —
- DSCR
- —
- Eligible?
- —
No personal income docs; deal must DSCR.
Hard money
10% down · 12.0% · 12mo
- Down + closing
- —
- Monthly P&I
- —
- Monthly cashflow
- —
- DSCR
- —
- Eligible?
- —
Short-term bridge; refi at stabilization.
Rent comps 19 comps
| Address | Beds | Baths | Sqft | Rent | $/sqft | DOM | Units | Dist |
|---|---|---|---|---|---|---|---|---|
| 13249 N 14th Dr Phoenix, AZ | 3.0 | 2.0 | 1824 | $2,176 | $1.19 | 1d | 1 | 0.20mi |
| 1631 W Friess Dr Phoenix, AZ | 4.0 | 2.0 | 1756 | $2,890 | $1.65 | 1d | 1 | 0.49mi |
| 1715 W Pershing Ave Phoenix, AZ | 4.0 | 2.0 | 1834 | $2,700 | $1.47 | 2d | 1 | 0.57mi |
| 13832 N 17th Ave Phoenix, AZ | 4.0 | 2.0 | 1520 | $2,300 | $1.51 | 10d | 1 | 0.58mi |
| 1641 W Evans Dr Phoenix, AZ | 4.0 | 2.0 | 2002 | $10,000 | $5.00 | 1d | 1 | 0.88mi |
| 1944 W Thunderbird Rd Phoenix, AZ | 1.0–3.0 | 1.0–2.0 | 1062 | $1,835 | $1.73 | 1d | 58 | 1.00mi |
| 14230 N 19th Ave Phoenix, AZ | 1.0–3.0 | 1.0–2.0 | 947 | $1,665 | $1.76 | 1d | 33 | 1.06mi |
| 12602 N 21st Ave Phoenix, AZ | 3.0 | 2.0 | 1147 | $1,699 | $1.48 | 10d | 1 | 1.09mi |
| 13204 N 3rd Way Phoenix, AZ | 2.0 | 1.5 | 1248 | $1,950 | $1.56 | 2d | 1 | 1.12mi |
| 14602 N 19th Ave Phoenix, AZ | 1.0–3.0 | 1.0–2.0 | 1004 | $1,800 | $1.79 | 23d | 8 | 1.13mi |
| 14602 N 19th Ave Phoenix, AZ | 2.0 | 2.0 | 1052 | $1,565 | $1.49 | 17d | 1 | 1.13mi |
| 229 W Pine Valley Dr Phoenix, AZ | 3.0 | 2.0 | 2168 | $3,300 | $1.52 | 1d | 1 | 1.14mi |
| 2122 W Shaw Butte Dr Phoenix, AZ | 4.0 | 2.0 | 1566 | $2,311 | $1.48 | 13d | 1 | 1.27mi |
| 13820 N 7th Way Phoenix, AZ | 3.0 | 2.5 | 1912 | $2,675 | $1.40 | 24d | 1 | 1.34mi |
| 13615 N 24th Ave Phoenix, AZ | 3.0 | 2.0 | 1600 | $2,400 | $1.50 | 2d | 1 | 1.36mi |
| 11622 N 20th Ave Phoenix, AZ | 3.0 | 2.0 | 1465 | $2,200 | $1.50 | 1d | 1 | 1.36mi |
| 826 E Eugie Ave Phoenix, AZ | 3.0 | 2.0 | 1066 | $1,795 | $1.68 | 18d | 1 | 1.44mi |
| 12024 N 23rd Ave Phoenix, AZ | 2.0 | 2.0 | 1189 | $1,595 | $1.34 | 11d | 1 | 1.44mi |
| 2414 W Redfield Rd Phoenix, AZ | 3.0 | 2.0 | 1688 | $2,165 | $1.28 | 1d | 1 | 1.48mi |
Listing history 25 events
-
2026-06-18days on market $1 Active 30 DOM
-
2026-06-17days on market $1 Active 29 DOM
-
2026-06-16days on market $1 Active 28 DOM
-
2026-06-15days on market $1 Active 27 DOM
-
2026-06-13days on market $1 Active 25 DOM
-
2026-06-09days on market $1 Active 21 DOM
-
2026-06-08days on market $1 Active 20 DOM
-
2026-06-07days on market $1 Active 19 DOM
-
2026-06-04days on market $1 Active 16 DOM
-
2026-06-03days on market $1 Active 15 DOM
-
2026-06-02days on market $1 Active 14 DOM
-
2026-06-01days on market $1 Active 13 DOM
-
2026-05-31days on market $1 Active 12 DOM
-
2026-05-19$1 Active
-
2022-06-22soldstatus $520,000
-
2022-06-20soldstatus $520,000 Closed 484-char remark
Show marketing remark (484 chars)
Beautifully remodeled home located in great neighborhood in Moon Valley. Three bedroom, 2 bathrooms, 2 car garage with over 12,000 square foot lot. Charming exposed brick fireplace in living room. New tile in bathrooms, vanities, LVP floors, backsplash and quartz countertops. New lighting fixtures and fans. Fresh paint on both interior and exterior. Peaceful backyard with a beautiful tree, lots of shade and mountain views. Near the hiking trails, golf courses and country clubs.
-
2022-05-30historical Under Contract Accepting Backups 484-char remark
Show marketing remark (484 chars)
Beautifully remodeled home located in great neighborhood in Moon Valley. Three bedroom, 2 bathrooms, 2 car garage with over 12,000 square foot lot. Charming exposed brick fireplace in living room. New tile in bathrooms, vanities, LVP floors, backsplash and quartz countertops. New lighting fixtures and fans. Fresh paint on both interior and exterior. Peaceful backyard with a beautiful tree, lots of shade and mountain views. Near the hiking trails, golf courses and country clubs.
-
2022-05-16price $524,900 484-char remark
Show marketing remark (484 chars)
Beautifully remodeled home located in great neighborhood in Moon Valley. Three bedroom, 2 bathrooms, 2 car garage with over 12,000 square foot lot. Charming exposed brick fireplace in living room. New tile in bathrooms, vanities, LVP floors, backsplash and quartz countertops. New lighting fixtures and fans. Fresh paint on both interior and exterior. Peaceful backyard with a beautiful tree, lots of shade and mountain views. Near the hiking trails, golf courses and country clubs.
-
2022-05-12price $559,900 484-char remark
Show marketing remark (484 chars)
Beautifully remodeled home located in great neighborhood in Moon Valley. Three bedroom, 2 bathrooms, 2 car garage with over 12,000 square foot lot. Charming exposed brick fireplace in living room. New tile in bathrooms, vanities, LVP floors, backsplash and quartz countertops. New lighting fixtures and fans. Fresh paint on both interior and exterior. Peaceful backyard with a beautiful tree, lots of shade and mountain views. Near the hiking trails, golf courses and country clubs.
-
2022-05-02$569,900 Active 484-char remark
Show marketing remark (484 chars)
Beautifully remodeled home located in great neighborhood in Moon Valley. Three bedroom, 2 bathrooms, 2 car garage with over 12,000 square foot lot. Charming exposed brick fireplace in living room. New tile in bathrooms, vanities, LVP floors, backsplash and quartz countertops. New lighting fixtures and fans. Fresh paint on both interior and exterior. Peaceful backyard with a beautiful tree, lots of shade and mountain views. Near the hiking trails, golf courses and country clubs.
-
2022-03-11historical
-
2022-03-03price $549,000
-
2022-02-09$569,900 Active
-
1993-06-29soldstatus $88,000
-
1986-08-12soldstatus $85,000
ⓘ Source: listings_history table (triggers on properties + properties_extension) + one-shot
backfill from property_details.listing_events for pre-trigger history.
Climate risk First Street
- Flood 6/10 Major FEMA zone AE · 67% chance over 30 yrs
- Wildfire 1/10 Low
- Heat 9/10 Extreme 7 d/yr ≥111°F today · 19 d/yr by 30 yrs out
- Wind 1/10 Low
- Air quality 3/10 Moderate 3 unhealthy d/yr today · 4 by 30 yrs out
Nearby sold comps map
Loading sold comps map…
Walkable amenities ~0.75 mi
Loading nearby amenities…
Taxation est. · year 1
- Rental income
- $25,512
- − Mortgage interest
- −$0
- − Property taxes
- −$0
- − Insurance
- −$5,119
- − Repairs & maintenance
- −$2,041
- − Management
- −$2,041
- − Depreciation
- −$0
- Taxable income
- $16,311
- Est. tax owed @ 24.0%
- −$3,915
- After-tax cash flow
- $11,121/yr
For passive investors: Depreciation is non-cash, so a rental often shows a tax loss while cash-flowing — sheltering income. Rental losses are passive: they offset passive income freely, and up to $25,000/yr can offset ordinary (W-2) income if you actively participate and your MAGI is under $100k (phasing out to $0 by $150k); unused losses carry forward. On sale, claimed depreciation is recaptured at up to 25%, and gains may owe capital-gains tax (a 1031 exchange can defer both). Figures are a year-1 estimate at your 24.0% rate — not tax advice; consult a CPA.
Condition & rehab AI · 6 photos
This property is in excellent condition with recent renovations, making it a great investment opportunity for both resale and rental.
Value-add opportunities
- Both Paint exterior and interior walls — Fresh paint enhances curb appeal and interior aesthetics
- Both Replace ceiling fans with energy-efficient models — Energy-efficient fans reduce utility costs and improve comfort
- Both Install smart home devices for energy management and security — Smart devices increase home value and convenience
Renovation cost estimate screening
Value-add ROI direction
- Both Paint exterior and interior walls — Fresh paint enhances curb appeal and interior aesthetics ↑
- Both Replace ceiling fans with energy-efficient models — Energy-efficient fans reduce utility costs and improve comfort ↑
- Both Install smart home devices for energy management and security — Smart devices increase home value and convenience ↑
ⓘ Cost ranges are severity-bucket heuristics (US national rule-of-thumb). Get contractor quotes + a written scope before underwriting a rehab budget.
Schools (NCES district)
- District
- Glendale Union High School District (4285)
- NCES district ID
- 0403450
- Math proficiency
- 23% ▼ -38.00%
- Reading proficiency
- 31% ▼ -19.00%
- Median HH income
- $40,846
- Composite
- 22.81/100
- National rank
- #8020
- State rank
- #130 of 249 in AZ
Livability — Phoenix
- Score
- 75/100
- State rank
- #16
- US rank
- #3924
Category grades
Schools grade is shown separately in the Schools card above.
Census & demographics
- Census place
- Phoenix, AZ
- County
- Maricopa County · 4,537,380 people
- City population
- 1,500,198
- Metro
- Phoenix-Mesa-Chandler, AZ
- Population (ZIP)
- 49,683
- Household income
- $64,556
- Rent vs Own
- Severe rent burden
- 2196.0
Population outlook (Maricopa County) Hauer SSP2
- Today (2025)
- 4,979,203 people
- By 2030
- 5,378,229 · +8.0%
- By 2040
- 6,156,598 · +23.6%
- By 2050
- 6,872,376 · +38.0%
- By 2075
- 8,401,270 · +68.7%
- By 2100
- 9,247,439 · +85.7%
Race, ethnicity, and origin ACS 2023
- Neighborhood character
- Diverse neighborhood (Simpson 0.64)
- Race & ethnicity
- White 47% Hispanic / Latino 36% Two or more races 19% Black 6% Native American 4% Asian 3%
- Hispanic origin (detail)
- Mexican 30% Cuban 1%
- Common ancestry
- Lithuanian 2% Romanian 2% Slovak 2%
- Foreign-born
- 17% · Canada, China, Vietnam
- Languages at home
- 69% English-only · Spanish 25% Arabic 1% Tagalog/Filipino 1%
Political lean MEDSL · Maricopa
- 2024 margin
- Toss-up / Even · D 47.7% · R 51.2% · Other 1.1%
- 2008→2024 swing
- +7.1pp toward D · 2008: -10.6pp · 2024: -3.5pp
- All cycles
- 2024: R+3.5 2020: D+2.2 2016: R+3.5 2012: R+12.0 2008: R+10.6
Not yet ingested
- Civics
- —
Market trends
- HPI YoY
- ▼ -346.94%
- Current HPI
- 361.0214
- Rent YoY
- ▼ -2.64%
- Metro
- Phoenix-Mesa-Chandler, AZ
- State GDP YoY
- ▲ 4.54%
- F500 in state
- 20
Industry mix (Fortune 500 HQ in AZ)
| Industry | F500 HQs | Revenue |
|---|---|---|
| Technology | 2 | $13B |
|
||
| Mining / Metals | 1 | $23B |
|
||
| Environmental Services | 1 | $16B |
|
||
| Metals / Steel | 1 | $14B |
|
||
| Technology Distribution | 1 | $9B |
|
||
| Homebuilding | 1 | $8B |
|
||
Price history
+511.8% since first listed12 events — show timeline
- 2026-05-19 Listed $1 ARMLS
- 2022-06-22 Sold (Public Records) $520,000 Public Records
- 2022-06-20 Sold (MLS) $520,000 ARMLS
- 2022-05-30 Contingent — ARMLS
- 2022-05-16 Price Changed $524,900 ARMLS
- 2022-05-12 Price Changed $559,900 ARMLS
- 2022-05-02 Listed $569,900 ARMLS
- 2022-03-11 Listing Removed — ARMLS
- 2022-03-03 Price Changed $549,000 ARMLS
- 2022-02-09 Listed $569,900 ARMLS
- 1993-06-29 Sold (Public Records) $88,000 Public Records
- 1986-08-12 Sold (Public Records) $85,000 Public Records
Property tax history
+1.6%/yrLatest (2025): $2,484 · +3.9% YoY. Source: county tax records.
Cash-flow waterfall
monthlySold comps — $/sqft
last 12 mo · ≤1 miLoading sold comps…