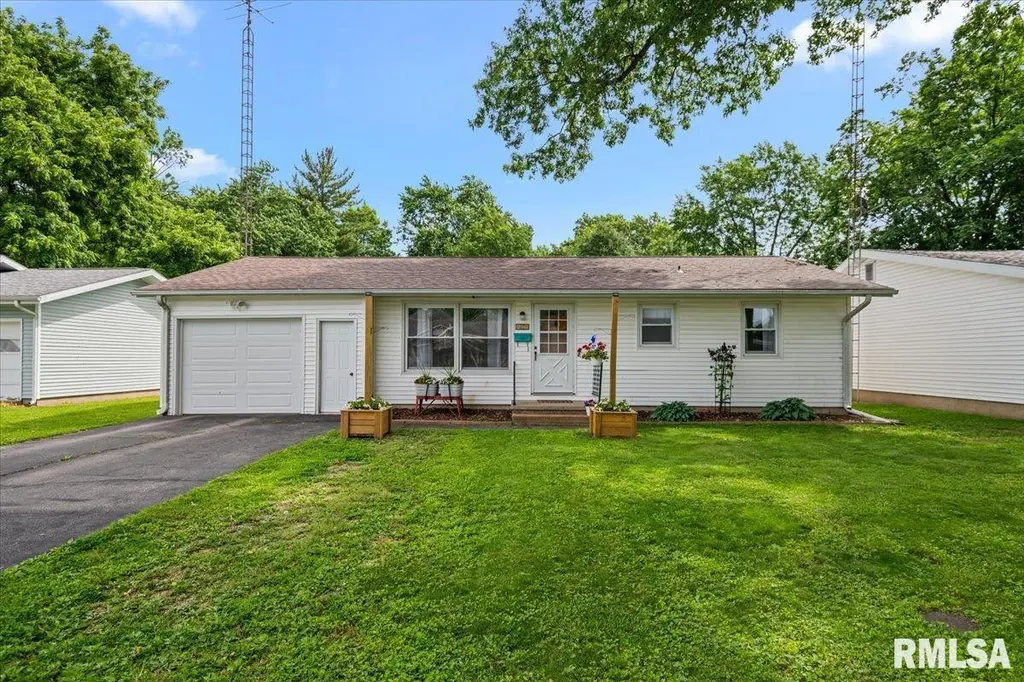
216 N Oak St · Nokomis, IL
Flood risk 1/10 · Minimal
- FEMA flood zone
- X
- Chance of flooding over 30 yrs
- 0.0%
- Est. flood insurance / yr
- $473 – $860
Fire risk 1/10 · Minimal
- Est. fire insurance / yr
- $804 – $1,492
Heat risk 4/10 · Minor
- Hot days now (above 104°F)
- 7 days/yr
- Hot days in 30 yrs
- 20 days/yr
Wind risk 2/10 · Minimal
- Chance of severe wind over 30 yrs
- 2.0%
Air-quality risk 4/10 · Minor
- Unhealthy air days now
- 4 days/yr
- Unhealthy air days in 30 yrs
- 6 days/yr
Risk factors via First Street. Map © Google.
Why this score? — see what drove the C+ grade
The composite is a weighted blend of 9 inputs, each scored 0–100. Each bar is that input's sub-score; the figure is the points it added to the 100-point composite (weight × sub-score).
- Cash flow +21.8/30.0
- Appreciation +10.0/10.0
- ARV discount +7.5/15.0
- DSCR +7.0/10.0
- 1% rule +5.6/10.0
- Livability +3.3/5.0
- Schools +2.7/10.0
- Rent growth +2.5/5.0
- Condition / age +2.5/5.0
$97,000
🖨 Deal sheet 📄 Offer letter ✓ Due diligence
Listing remarks MLS
Fantastic 3BR-1.5BA ranch style home!Cute,eat-in kitchen w/built-in oven & stove-top-great laundry / utility room off kitchen w/entrance to nice, attached 1 car garage w/storage area. 1/2 bath in front BR-lg full bath w/linen closet-New windows-Pretty yard with nice storage shed!.Move-in ready!
Key facts
- New water heater
- Whole-house fan
- New roof
Tags
Property features AI
Exterior
- Parking: Attached garage with 1 parking space
- Utilities: Public water; Public sewer
- Home design: Single-family residence; Built in 1960; Total living area approximately 1100
- Construction: Shingle roof; Crawl space foundation; Built in 1960
- Exterior features: Level lot; Lot dimensions approximately 60 x 142; Shingle roof
Interior
- Kitchen: Microwave; Refrigerator
- Bedrooms: Three bedrooms; All three main-level bedrooms with hardwood flooring
- Flooring: Hardwood in bedrooms; Carpet in living areas and kitchen
- Bathrooms: One full bathroom; One half bathroom
- Heating & cooling: Hot water heating; Gas water heater; Window air conditioning units
- Interior features: Washer and dryer; Microwave; Refrigerator; No fireplaces; Crawl space basement; Egress windows in some bedrooms
- Laundry & utility: Main-level laundry room; Washer and dryer
Neighborhood map
What this means for you Summary
Snapshot
- This is a 3-bed/1.5-bath single-family listed at $97k.
Deal economics
- At list price, monthly cash flow is $150 ($2k/yr) — positive.
- The deal already cash-flows at list — no discount required.
- Meets the 1% rule at list price ($1k rent vs $97k).
- Recommended offer: $96k (1.5% below list) — sets the bar for market timing.
Location & tenants
- Location reads 66/100 on livability (#547 in IL) — a middle-class / working-renter tenant base. Strengths: cost of living A+, housing A+, crime B; Watch: amenities F, commute F, health & safety F.
- Nokomis CUSD 22 (town): math 32% / reading 31% proficiency, ranked #241 of 620 in IL (top 39%) — families likely to look elsewhere, expect single-tenant / working-renter base with shorter leases.
- Zoned schools: Nokomis Jr/Sr High Sch (math 27% / reading 27%, grade F, #218 of 693 statewide, top 35%, 312 students, 0% FRL) — zoned schools average 0% FRL vs 37% district-wide (37 pts lower); this property's tenant base skews higher-income than the district average.
- Market conditions: 16 active listings in the ZIP; 12 units permitted in Montgomery County in 2024 (0 in 5+ unit buildings).
Forward outlook
- In year one you build about $10k of equity ($671 loan paydown + $10k appreciation (10.0% local appreciation)).
- Montgomery County population projected at -20% by 2050 — secular population decline; favor cash flow + early exit over multi-decade hold.
- At projected returns (10.0% appreciation + 3.0% rent growth), your $27k cash investment doubles in ~3 years — after that, you're playing with house money.
- By year 4, paydown + projected appreciation supports a ~$37k cash-out refi (75% LTV) — recoverable capital for the next deal without selling this one.
Negotiation context
- It's been on market 16 days — a 2% lower offer ($96k) is reasonable based on typical stale-listing flexibility.
- 2 sale attempts since 12y ago; this cycle's ask has dropped $8k (8%) from the opening price — seller is motivated, your offer sets the floor, not the list.
- Current owner paid $51k; list at $97k implies a 90% gain — meaningful room to come down on a strong offer.
Questions for the listing agent
- Built in 1960 — when were the roof, HVAC, electrical panel, plumbing, and water heater last replaced?
- Is there a deadline driving the sale (1031 exchange, divorce, estate, relocation)? That informs how much negotiation room exists.
- What's the average days-on-market for RENTAL listings here right now (not sales)? A rising rental-DOM trend means longer vacancies and softer asking-rent achievability than the comps imply.
- What's the recent tenant-quality profile in this submarket — average credit score on applications, eviction rate, late-payment / NSF rate, and stable-employment percentage? A property-management company in the area should have these aggregated.
- How much new for-sale + rental construction is in the pipeline within 1–3 miles? Heavy new supply typically softens prices + rents 12–24 months out; constrained supply supports both.
Investment metrics
- 1% rule
- 1.06% ✓
- Cap rate
- 8.15%
- Cash-on-cash
- 6.64%
- DSCR
- 1.30
- GRM
- 7.9
CMA / ARV
- ARV (on-the-fly)
- $62,700
- Comps found
- 11
Show comp detail 11 sales within ~0.75 mi
| Address | Dist | Beds/Ba | Sqft | Sold | Price | $/sf | Match |
|---|---|---|---|---|---|---|---|
| 323 N Maple St | 0.13mi | 3/1.0 | 1,100 (0%) | 6mo | $64,900 | $59 | 87 |
| 625 School St | 0.55mi | 3/1.0 | 1,140 (+4%) | 1mo | $48,000 | $42 | 65 |
| 429 Weaver St | 0.39mi | 2/1.5 (-1) | 1,040 (-6%) | 9mo | $129,000 | $124 | 60 |
| 620 School St | 0.55mi | 2/1.0 (-1) | 1,128 (+2%) | 10mo | $79,500 | $70 | 55 |
| 611 Sanford | 0.63mi | 3/1.5 | 1,100 (0%) | 20mo | $59,900 | $54 | 54 |
| 405 N Monroe St | 0.43mi | 2/1.0 (-1) | 1,164 (+6%) | 12mo | $56,000 | $48 | 53 |
| 724 Miller St | 0.58mi | 2/1.0 (-1) | 1,080 (-2%) | 20mo | $62,000 | $57 | 47 |
| 517 W Union St | 0.59mi | 2/1.5 (-1) | 1,014 (-8%) | 10mo | $80,000 | $79 | 47 |
| 618 E Union St | 0.51mi | 2/1.0 (-1) | 999 (-9%) | 13mo | $82,500 | $83 | 43 |
| 419 Monroe St | 0.46mi | 2/1.0 (-1) | 942 (-14%) | 10mo | $34,900 | $37 | 39 |
| 627 Sanford St | 0.66mi | 2/1.0 (-1) | 1,061 (-4%) | 21mo | $33,500 | $32 | 39 |
Match score weights: distance 35% · size 25% · config 20% · recency 20%. Top-matched comps best support the ARV.
Projected returns pro-forma
10.0% appreciation · 3.0% rent growth · sell at horizon
- IRR
- 29.1%
- Equity multiple
- 3.30×
- Total profit
- $62,416
- Equity at exit
- $87,385
- IRR
- 25.3%
- Equity multiple
- 7.49×
- Total profit
- $176,291
- Equity at exit
- $188,450
Cash invested: $27,160 (down + closing). Projections, not guarantees.
Landlord ↔ Tenant lean methodology
- Overall (STATE)
- 43 Moderately Tenant-Leaning
- State Illinois
- 43 Moderately Tenant-Leaning · D+7
- County
- — inherits STATE
- City
- — inherits STATE
ZIP-level market 62075
- Home prices YoY
- 15.1%
- Active inventory
- 16
- Price-to-rent
- 7.9×
Monthly cashflow live
- Estimated rent
- $1,026 medium interval (Pro) →
- Mortgage (P&I)
- −$509
- Tax from tax record
- −$111 /mo · $1,337/yr
- Insurance
- −$40
- HOA
- −$0
- Vacancy / Maint / Mgmt
- −$216
- Net cashflow
- $150
Break-even live
UW: 25.0% down · 7.5% · 30yr · 1.5% tax · 5.0% vac · 8.0% maint · 8.0% mgmt
Financing live
Cash to close
- Down payment
- $24,250
- Closing costs
- $2,910
- Reserves months
- —
- Total cash needed
- —
Loan-product check · same deal, 3 products live
Conventional
25% down · 7.5% · 30yr
- Down + closing
- —
- Monthly P&I
- —
- Monthly cashflow
- —
- DSCR
- —
- Eligible?
- —
Personal DTI + credit; lowest rate.
DSCR
20% down · 8.5% · 30yr
- Down + closing
- —
- Monthly P&I
- —
- Monthly cashflow
- —
- DSCR
- —
- Eligible?
- —
No personal income docs; deal must DSCR.
Hard money
10% down · 12.0% · 12mo
- Down + closing
- —
- Monthly P&I
- —
- Monthly cashflow
- —
- DSCR
- —
- Eligible?
- —
Short-term bridge; refi at stabilization.
Listing history 13 events
-
2026-06-18days on market $97,000 Active 16 DOM
-
2026-06-17days on market $97,000 Active 15 DOM
-
2026-06-16days on market $97,000 Active 14 DOM
-
2026-06-16price $97,000 Active 13 DOM
-
2026-06-15days on market $105,000 Active 13 DOM
-
2026-06-13days on market $105,000 Active 11 DOM
-
2026-06-12days on market $105,000 Active 10 DOM
-
2026-06-09days on market $105,000 Active 7 DOM
-
2026-06-08days on market $105,000 Active 6 DOM
-
2026-06-07days on market $105,000 Active 5 DOM
-
2026-06-07days on market $105,000 Active 4 DOM
-
2026-06-03remarks 692-char remark
-
2026-06-03$105,000 Active 1 DOM
ⓘ Source: listings_history table (triggers on properties + properties_extension) + one-shot
backfill from property_details.listing_events for pre-trigger history.
Tax reassessment forecast IL · Partial reset (capped growth)
- Current annual tax
- $1,337 · $111/mo
- Projected year-2 tax
- $1,769 · $147/mo
- Expected delta
- +$433/yr (+$36/mo · 32.4%)
ⓘ Screening estimate from a state-policy table — verify with the county assessor before closing.
Climate risk First Street
- Flood 1/10 Low FEMA zone X · 0% chance over 30 yrs
- Wildfire 1/10 Low
- Heat 4/10 Moderate 7 d/yr ≥104°F today · 20 d/yr by 30 yrs out
- Wind 2/10 Low 2% chance of damaging wind over 30 yrs
- Air quality 4/10 Moderate 4 unhealthy d/yr today · 6 by 30 yrs out
Nearby sold comps map
Loading sold comps map…
Walkable amenities ~0.75 mi
Loading nearby amenities…
Taxation est. · year 1
- Rental income
- $12,317
- − Mortgage interest
- −$5,434
- − Property taxes
- −$1,337
- − Insurance
- −$485
- − Repairs & maintenance
- −$985
- − Management
- −$985
- − Depreciation
- −$2,822
- Taxable income
- $269
- Est. tax owed @ 24.0%
- −$65
- After-tax cash flow
- $1,740/yr
For passive investors: Depreciation is non-cash, so a rental often shows a tax loss while cash-flowing — sheltering income. Rental losses are passive: they offset passive income freely, and up to $25,000/yr can offset ordinary (W-2) income if you actively participate and your MAGI is under $100k (phasing out to $0 by $150k); unused losses carry forward. On sale, claimed depreciation is recaptured at up to 25%, and gains may owe capital-gains tax (a 1031 exchange can defer both). Figures are a year-1 estimate at your 24.0% rate — not tax advice; consult a CPA.
Schools (NCES district)
- District
- Nokomis CUSD 22
- NCES district ID
- 1728560
- Math proficiency
- 32% ▼ -6.00%
- Reading proficiency
- 31% ▼ -17.00%
- Median HH income
- $42,673
- Composite
- 26.76/100
- National rank
- #7132
- State rank
- #241 of 620 in IL
Livability — Nokomis
- Score
- 66/100
- State rank
- #547
- US rank
- #11441
Category grades
Schools grade is shown separately in the Schools card above.
Census & demographics
- Census place
- Nokomis, IL
- City population
- 3,180
- Population (ZIP)
- 3,180
Population outlook (Montgomery County) Hauer SSP2
- Today (2025)
- 27,471 people
- By 2030
- 26,410 · -3.9%
- By 2040
- 24,233 · -11.8%
- By 2050
- 21,948 · -20.1%
- By 2075
- 16,686 · -39.3%
- By 2100
- 11,369 · -58.6%
Race, ethnicity, and origin ACS 2023
- Neighborhood character
- Predominantly White (93%)
- Race & ethnicity
- White 93% Asian 4% Two or more races 2% Hispanic / Latino 1%
- Common ancestry
- Romanian 1% Iranian 1% Slovak 1%
- Foreign-born
- 2% · China
- Languages at home
- 96% English-only · Other Indo-European 2% German/W. Germanic 1%
Political lean MEDSL · Montgomery
- 2024 margin
- Solid R (+44.0) · D 27.1% · R 71.1% · Other 1.8%
- 2008→2024 swing
- -46.7pp toward R · 2008: 2.6pp · 2024: -44.0pp
- All cycles
- 2024: R+44.0 2020: R+41.0 2016: R+40.0 2012: R+14.2 2008: D+2.6
Not yet ingested
- Civics
- —
Market trends
- HPI YoY
- ▲ 25.27%
- Current HPI
- 192.84
- Rent YoY
- —
- Metro
- —
- State GDP YoY
- ▲ 1.59%
- F500 in state
- 60
Industry mix (Fortune 500 HQ in IL)
| Industry | F500 HQs | Revenue |
|---|---|---|
| Insurance | 4 | $201B |
|
||
| Consumer Goods | 4 | $87B |
|
||
| Industrial Machinery | 3 | $64B |
|
||
| Healthcare | 2 | $55B |
|
||
| Retail / Pharmacy | 1 | $148B |
|
||
| Agriculture / Food | 1 | $86B |
|
||
Price history
+75.3% since first listed4 events — show timeline
- 2026-06-02 Listed $105,000 RMLSA as Distributed by MLS Grid
- 2014-11-21 Sold (Public Records) $51,000 Public Records
- 2014-11-20 Sold (MLS) — MARIS as Distributed by MLS Grid
- 2014-08-03 Listed $59,900 MARIS as Distributed by MLS Grid
Property tax history
+2.6%/yrLatest (2024): $1,337 · +8.4% YoY. Source: county tax records.
Cash-flow waterfall
monthlySold comps — $/sqft
last 12 mo · ≤1 miLoading sold comps…