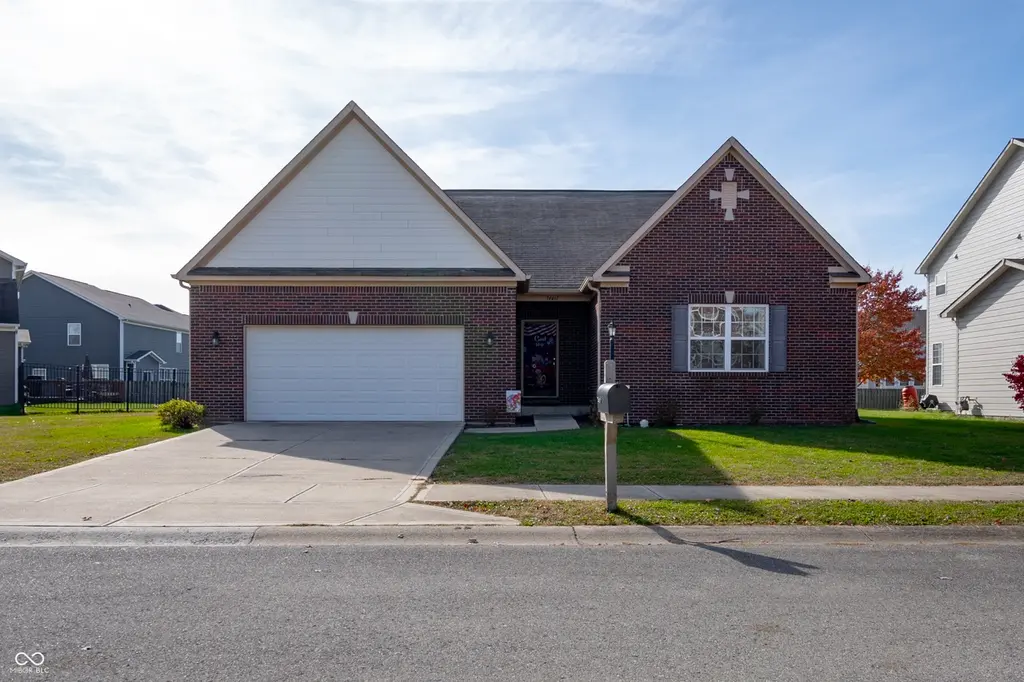
14461 Brook Meadow Dr · Fishers, IN
Flood risk 1/10 · Minimal
- FEMA flood zone
- X (unshaded)
- Chance of flooding over 30 yrs
- 0.0%
- Est. flood insurance / yr
- $473 – $860
Fire risk 1/10 · Minimal
- Est. fire insurance / yr
- $717 – $1,331
Heat risk 3/10 · Minor
- Hot days now (above 100°F)
- 7 days/yr
- Hot days in 30 yrs
- 18 days/yr
Wind risk 2/10 · Minimal
- Chance of severe wind over 30 yrs
- 1.0%
Air-quality risk 2/10 · Minimal
- Unhealthy air days now
- 1 days/yr
- Unhealthy air days in 30 yrs
- 2 days/yr
Risk factors via First Street. Map © Google.
Why this score? — see what drove the D- grade
The composite is a weighted blend of 9 inputs, each scored 0–100. Each bar is that input's sub-score; the figure is the points it added to the 100-point composite (weight × sub-score).
- ARV discount +15.0/15.0
- Cash flow +6.4/30.0
- Schools +5.3/10.0
- Livability +4.2/5.0
- Rent growth +3.8/5.0
- Condition / age +2.5/5.0
- 1% rule +1.1/10.0
- DSCR +0.7/10.0
- Appreciation +0.0/10.0
$415,000
🖨 Deal sheet 📄 Offer letter ✓ Due diligence
Listing remarks
Located in the booming McCordsville/Fishers area, this all-brick ranch offers 3,738 sq. ft. , 3 bedrooms, 2 full baths, and a full unfinished basement-creating the perfect combination of move-in ready living with incredible future potential. With a 2 car finished garage and timeless curb appeal, this home is built for both comfort and long-term value. Step inside to find a well-designed layout featuring arched doorways, 2-panel doors, and a spacious feel throughout. The kitchen is both functional and inviting with tile flooring, 42" birch cabinets, stainless steel appliances, and a raised bar top that easily accommodates four stools-perfect for casual dining or entertaining. The adjace
Key facts
- Double vanity
- All brick ranch
- Separate shower
Tags
Property features AI
Finance
- Other: Property on approximately 0.27 acres (1/4–1/2 acre)
- HOA & community: Homeowners association with annual fee ($450/year); HOA covers insurance, maintenance, snow removal, and walking trails; Association amenities include trails
Exterior
- Parking: Attached finished garage with automatic garage door opener; 2 garage spaces
- Security: Smoke alarm
- Utilities: Public water; Municipal sewer connection; Cable available
- Home design: Single-family residence; One story; Located in a planned unit development
- Construction: Brick and cement siding exterior; Concrete perimeter foundation
- Exterior features: Screened patio/porch; Irregular lot with sidewalks and storm sewer
Interior
- Kitchen: Electric cooktop; Electric oven; Range hood; Dishwasher; Refrigerator; Breakfast room adjacent to kitchen
- Bedrooms: 3 bedrooms on the main level; Primary bedroom with walk-in closet
- Bathrooms: 2 full bathrooms (both on main level)
- Heating & cooling: Forced air heating (natural gas); Central air conditioning
- Interior features: Attic access; Breakfast bar; High ceilings; Smart thermostat; Woodwork painted
- Laundry & utility: Main level laundry (washer and dryer included); Gas water heater; Sump pump
Neighborhood map
What this means for you Summary
Snapshot
- This is a 4-bed/2.0-bath single-family listed at $415k.
Deal economics
- At list price, monthly cash flow is $-718 ($-9k/yr) — negative.
- To cash-flow at today's rent, offer at most $288k (30.6% below list).
- To meet the 1% rule (rent ≥ 1% of price), the offer needs to be $254k (38.7% below list).
- Recommended offer: $254k (38.7% below list) — sets the bar for 1% rule.
Location & tenants
- Location reads 83/100 on livability (#11 in IN, #898 nationally) — a professional / high-income tenant draw. Strengths: schools A+, crime A+, amenities A+; Watch: commute F.
- Hamilton Southeastern Schools (suburban): math 57% / reading 59% proficiency, ranked #14 of 301 in IN (top 5%) — acceptable for families but not a draw, mixed tenant base, ~2y average lease; only 10% free/reduced lunch — higher-income household profile.
- Market conditions: Rents rising fast (+5.2%/yr); 422 active listings in the ZIP; high-income renter base; 4,661 units permitted in Hamilton County in 2024 (1,528 in 5+ unit buildings).
Forward outlook
- Local home prices are declining (-3.0%/yr); year-one equity from $3k of loan paydown is wiped out by about $12k of value loss. Plan a longer hold.
- Hamilton County population projected at +44% by 2050 — long-run rental-demand tailwind backs the buy-and-hold thesis.
Negotiation context
- Only 6 days on market — expect competitive offers; lowballing is unlikely to land.
- 7 sale attempts since 2y ago with the ask held roughly flat each time — persistent listings suggest the price (not the market) is what's stuck; bring a comps-based counter.
Questions for the listing agent
- What do current leases actually rent for vs. the listed asking? Can we see a recent rent roll and the last 12 months of T-12 income?
- What does the HOA fee cover, when was the last increase, and are there any pending special assessments or reserve-fund shortfalls?
- Is there a deadline driving the sale (1031 exchange, divorce, estate, relocation)? That informs how much negotiation room exists.
- Schools are A-rated — typically a magnet for longer-tenancy family renters. What's the average tenant stay here, and is there a school-zone premium baked into asking?
- The area grade is low — what's the realistic commute time and amenity access for the typical tenant pool here? Any planned neighborhood developments (good or bad) we should know about?
- What's the average days-on-market for RENTAL listings here right now (not sales)? A rising rental-DOM trend means longer vacancies and softer asking-rent achievability than the comps imply.
- What's the recent tenant-quality profile in this submarket — average credit score on applications, eviction rate, late-payment / NSF rate, and stable-employment percentage? A property-management company in the area should have these aggregated.
- How much new for-sale + rental construction is in the pipeline within 1–3 miles? Heavy new supply typically softens prices + rents 12–24 months out; constrained supply supports both.
Investment metrics
- 1% rule
- 0.61% ✗
- Cap rate
- 4.22%
- Cash-on-cash
- -7.42%
- DSCR
- 0.67
- GRM
- 13.6
CMA / ARV
- ARV (median comp)
- $511,049
- List price
- $415,000
- Delta
- -18.79%
- Verdict
- UNDERPRICED
- Comps
- 20 within 1.0 mi
Show comp detail 12 sales within ~0.75 mi
| Address | Dist | Beds/Ba | Sqft | Sold | Price | $/sf | Match |
|---|---|---|---|---|---|---|---|
| 9752 Brook Wood Dr | 0.18mi | 3/2.0 (-1) | 1,940 (+4%) | 10mo | $375,500 | $194 | 72 |
| 9704 Brook Wood Dr | 0.19mi | 3/2.0 (-1) | 1,673 (-10%) | 0mo | $340,000 | $203 | 68 |
| 5173 Covington Ave | 0.41mi | 3/2.0 (-1) | 2,063 (+10%) | 8mo | $433,000 | $210 | 52 |
| 9695 Timberbrooke Blvd | 0.23mi | 3/2.0 (-1) | 1,630 (-13%) | 15mo | $330,000 | $202 | 51 |
| 9925 Glendon Ct | 0.39mi | 3/2.0 (-1) | 2,051 (+10%) | 13mo | $399,900 | $195 | 50 |
| 5269 Parkhurst Xing | 0.56mi | 3/2.0 (-1) | 2,038 (+9%) | 10mo | $439,900 | $216 | 46 |
| 5246 Parkhurst Xing | 0.52mi | 3/2.0 (-1) | 2,032 (+9%) | 13mo | $420,000 | $207 | 45 |
| 9539 Rocky Shore Dr | 0.47mi | 3/2.0 (-1) | 2,114 (+13%) | 11mo | $442,500 | $209 | 43 |
| 5017 Winnsboro Dr | 0.75mi | 3/2.0 (-1) | 1,800 (-4%) | 16mo | $356,995 | $198 | 41 |
| 9716 Holborn Ave | 0.59mi | 3/2.0 (-1) | 2,098 (+12%) | 14mo | $435,000 | $207 | 35 |
| 5151 Winnsboro Dr | 0.75mi | 3/2.0 (-1) | 2,096 (+12%) | 12mo | $409,000 | $195 | 29 |
| 5050 Winnsboro Dr | 0.75mi | 3/2.0 (-1) | 2,092 (+12%) | 17mo | $379,995 | $182 | 26 |
Match score weights: distance 35% · size 25% · config 20% · recency 20%. Top-matched comps best support the ARV.
Projected returns pro-forma
-3.0% appreciation · 5.18% rent growth · sell at horizon
- IRR
- -27.0%
- Equity multiple
- 0.08×
- Total profit
- $-107,331
- Equity at exit
- $61,878
- IRR
- -18.9%
- Equity multiple
- -0.10×
- Total profit
- $-128,088
- Equity at exit
- $35,882
Cash invested: $116,200 (down + closing). Projections, not guarantees.
Landlord ↔ Tenant lean methodology
- Overall (STATE)
- 90 Strongly Landlord-Friendly
- State Indiana
- 90 Strongly Landlord-Friendly · R+11
- County
- — inherits STATE
- City
- — inherits STATE
ZIP-level market 46055
- Home prices YoY
- -20.1%
- Rents YoY
- 5.2%
- Active inventory
- 422
- Price-to-rent
- 13.6×
Monthly cashflow live
- Estimated rent
- $2,544 medium interval (Pro) →
- Mortgage (P&I)
- −$2,176
- Tax from tax record
- −$340 /mo · $4,086/yr
- Insurance
- −$173
- HOA
- −$38
- Vacancy / Maint / Mgmt
- −$534
- Net cashflow
- $-718
Break-even live
UW: 25.0% down · 7.5% · 30yr · 1.5% tax · 5.0% vac · 8.0% maint · 8.0% mgmt
Financing live
Cash to close
- Down payment
- $103,750
- Closing costs
- $12,450
- Reserves months
- —
- Total cash needed
- —
Loan-product check · same deal, 3 products live
Conventional
25% down · 7.5% · 30yr
- Down + closing
- —
- Monthly P&I
- —
- Monthly cashflow
- —
- DSCR
- —
- Eligible?
- —
Personal DTI + credit; lowest rate.
DSCR
20% down · 8.5% · 30yr
- Down + closing
- —
- Monthly P&I
- —
- Monthly cashflow
- —
- DSCR
- —
- Eligible?
- —
No personal income docs; deal must DSCR.
Hard money
10% down · 12.0% · 12mo
- Down + closing
- —
- Monthly P&I
- —
- Monthly cashflow
- —
- DSCR
- —
- Eligible?
- —
Short-term bridge; refi at stabilization.
HOA detail
- Monthly dues
- $38 · $456/yr
Listing history 23 events
-
2026-06-18days on market $415,000 Active 6 DOM
-
2026-06-17days on market $415,000 Active 5 DOM
-
2026-06-16days on market $415,000 Active 4 DOM
-
2026-06-15days on market $415,000 Active 3 DOM
-
2026-06-13days on market $415,000 Active 1 DOM
-
2026-06-09days on market $415,000 Active 48 DOM
-
2026-06-08days on market $415,000 Active 47 DOM
-
2026-06-07days on market $415,000 Active 46 DOM
-
2026-06-03days on market $415,000 Active 42 DOM
-
2026-06-02days on market $415,000 Active 41 DOM
-
2026-06-01days on market $415,000 Active 40 DOM
-
2026-05-31days on market $415,000 Active 39 DOM
-
2026-04-22$415,000 Active 1716-char remark
-
2025-06-19historical
-
2025-02-19$415,000 Active
-
2024-12-18historical
-
2024-10-30$415,000 Active
-
2024-10-16historical
-
2024-10-09$412,000 Active
-
2024-05-02historical
-
2024-03-22$415,000 Active
-
2024-02-20historical
-
2024-01-18$425,000 Active
ⓘ Source: listings_history table (triggers on properties + properties_extension) + one-shot
backfill from property_details.listing_events for pre-trigger history.
Tax reassessment forecast IN · Partial reset (capped growth)
- Current annual tax
- $4,086 · $340/mo
- Projected year-2 tax
- $4,086 · $340/mo
- Expected delta
- $0/yr ($0/mo · 0.0%)
ⓘ Screening estimate from a state-policy table — verify with the county assessor before closing.
Climate risk First Street
- Flood 1/10 Low FEMA zone X (unshaded) · 0% chance over 30 yrs
- Wildfire 1/10 Low
- Heat 3/10 Moderate 7 d/yr ≥100°F today · 18 d/yr by 30 yrs out
- Wind 2/10 Low 100% chance of damaging wind over 30 yrs
- Air quality 2/10 Low 1 unhealthy d/yr today · 2 by 30 yrs out
Nearby sold comps map
Loading sold comps map…
Walkable amenities ~0.75 mi
Loading nearby amenities…
Taxation est. · year 1
- Rental income
- $30,525
- − Mortgage interest
- −$23,246
- − Property taxes
- −$4,086
- − Insurance
- −$2,075
- − Repairs & maintenance
- −$2,442
- − Management
- −$2,442
- − HOA
- −$456
- − Depreciation
- −$12,073
- Taxable loss
- −$16,294
- Est. tax savings @ 24.0%
- +$3,911
- After-tax cash flow
- $-4,707/yr
For passive investors: Depreciation is non-cash, so a rental often shows a tax loss while cash-flowing — sheltering income. Rental losses are passive: they offset passive income freely, and up to $25,000/yr can offset ordinary (W-2) income if you actively participate and your MAGI is under $100k (phasing out to $0 by $150k); unused losses carry forward. On sale, claimed depreciation is recaptured at up to 25%, and gains may owe capital-gains tax (a 1031 exchange can defer both). Figures are a year-1 estimate at your 24.0% rate — not tax advice; consult a CPA.
Schools (NCES district)
- District
- Hamilton Southeastern Schools
- NCES district ID
- 1810650
- Math proficiency
- 57% ▼ -11.00%
- Reading proficiency
- 59% ▼ -7.00%
- Median HH income
- $87,726
- Composite
- 53.02/100
- National rank
- #1520
- State rank
- #14 of 301 in IN
Livability — Fishers
- Score
- 83/100
- State rank
- #11
- US rank
- #898
Category grades
Schools grade is shown separately in the Schools card above.
Census & demographics
- Census place
- Fishers, IN
- County
- Hancock County · 59,521 people
- City population
- 92,467
- Metro
- Indianapolis-Carmel-Anderson, IN
- Population (ZIP)
- 16,010
- Household income
- $113,784
- Rent vs Own
- Severe rent burden
- 58.0
Population outlook (Hamilton County) Hauer SSP2
- Today (2025)
- 381,938 people
- By 2030
- 417,496 · +9.3%
- By 2040
- 486,684 · +27.4%
- By 2050
- 549,805 · +44.0%
- By 2075
- 687,078 · +79.9%
- By 2100
- 754,495 · +97.5%
Race, ethnicity, and origin ACS 2023
- Neighborhood character
- Predominantly White (77%)
- Race & ethnicity
- White 77% Black 13% Two or more races 6% Hispanic / Latino 4% Asian 1%
- Common ancestry
- Lithuanian 3% Italian 3% Romanian 3%
- Foreign-born
- 4% · Canada, Vietnam, Jamaica
- Languages at home
- 94% English-only · Spanish 4%
Political lean MEDSL · Hamilton
- 2024 margin
- Lean R (+6.1) · D 46.0% · R 52.1% · Other 1.9%
- 2008→2024 swing
- +16.2pp toward D · 2008: -22.2pp · 2024: -6.1pp
- All cycles
- 2024: R+6.1 2020: R+6.8 2016: R+19.6 2012: R+34.3 2008: R+22.2
Not yet ingested
- Civics
- —
Market trends
- HPI YoY
- ▼ -52.35%
- Current HPI
- 207.9764
- Rent YoY
- ▲ 5.18%
- Metro
- Indianapolis-Carmel-Anderson, IN
- State GDP YoY
- ▲ 2.90%
- F500 in state
- 18
Industry mix (Fortune 500 HQ in IN)
| Industry | F500 HQs | Revenue |
|---|---|---|
| Industrial Machinery | 2 | $37B |
|
||
| Healthcare | 1 | $177B |
|
||
| Pharmaceuticals | 1 | $45B |
|
||
| Metals / Steel | 1 | $18B |
|
||
| Agriculture | 1 | $17B |
|
||
| Packaging | 1 | $12B |
|
||
Price history
-2.4% since first listed13 events — show timeline
- 2026-06-12 Listed $415,000 MIBOR as Distributed by MLS Grid
- 2026-06-10 Listing Removed — MIBOR as Distributed by MLS Grid
- 2026-04-22 Listed $415,000 MIBOR as Distributed by MLS Grid
- 2025-06-19 Listing Removed — MIBOR as Distributed by MLS Grid
- 2025-02-19 Listed $415,000 MIBOR as Distributed by MLS Grid
- 2024-12-18 Listing Removed — MIBOR as Distributed by MLS Grid
- 2024-10-30 Listed $415,000 MIBOR as Distributed by MLS Grid
- 2024-10-16 Listing Removed — MIBOR as Distributed by MLS Grid
- 2024-10-09 Listed $412,000 MIBOR as Distributed by MLS Grid
- 2024-05-02 Listing Removed — MIBOR as Distributed by MLS Grid
- 2024-03-22 Listed $415,000 MIBOR as Distributed by MLS Grid
- 2024-02-20 Listing Removed — MIBOR as Distributed by MLS Grid
- 2024-01-18 Listed $425,000 MIBOR as Distributed by MLS Grid
Property tax history
+4.6%/yrLatest (2025): $4,086 · +6.6% YoY. Source: county tax records.
Cash-flow waterfall
monthlySold comps — $/sqft
last 12 mo · ≤1 miLoading sold comps…