111 E Flagler St #506 · Miami, FL
Flood risk 5/10 · Moderate
- FEMA flood zone
- X (unshaded)
- Chance of flooding over 30 yrs
- 0.24%
- Est. flood insurance / yr
- $507 – $1,088
Fire risk 1/10 · Minimal
- Est. fire insurance / yr
- $947 – $1,759
Heat risk 10/10 · Severe
- Hot days now (above 103°F)
- 7 days/yr
- Hot days in 30 yrs
- 28 days/yr
Wind risk 10/10 · Severe
- Chance of severe wind over 30 yrs
- 99.0%
Air-quality risk 2/10 · Minimal
- Unhealthy air days now
- 1 days/yr
- Unhealthy air days in 30 yrs
- 1 days/yr
Risk factors via First Street. Map © Google.
Why this score? — see what drove the B grade
The composite is a weighted blend of 9 inputs, each scored 0–100. Each bar is that input's sub-score; the figure is the points it added to the 100-point composite (weight × sub-score).
- Cash flow +27.8/30.0
- 1% rule +10.0/10.0
- DSCR +9.8/10.0
- ARV discount +7.5/15.0
- Schools +4.2/10.0
- Appreciation +4.0/10.0
- Livability +3.9/5.0
- Rent growth +3.0/5.0
- Condition / age +2.5/5.0
$235,000
🖨 Deal sheet 📄 Offer letter ✓ Due diligence
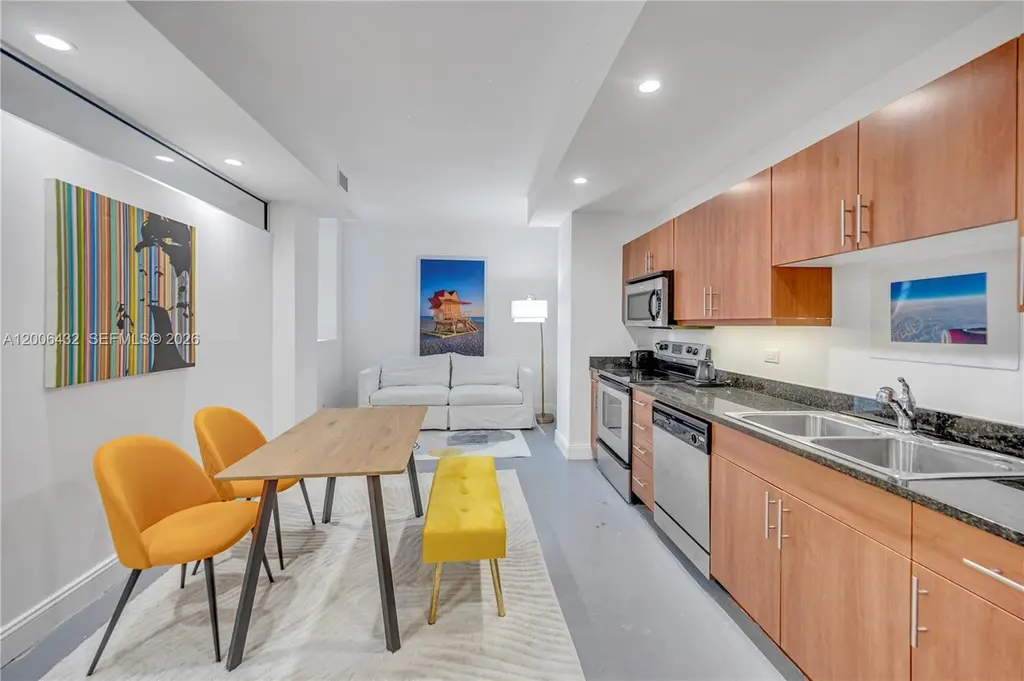
Listing remarks
Step into a true piece of Miami's history, an iconic Downtown property rich with character, heritage, and timeless appeal. Originally constructed as a bank, still showcasing its authentic vault door, is a striking architectural centerpiece. Offering vintage charm and historic significance in the urban core of the electric city. The building's enduring character provides the perfect canvas for a visionary owner or investor. Situated in the heart of Downtown Miami, surrounded by ongoing growth, revitalization, and new development, the property offers not only irreplaceable charm but also exceptional future upside. This is a rare opportunity to own a landmark setting where history, character,
Key facts
- Landmark setting
- Vintage charm
- Authentic vault door
Tags
Property features AI
Finance
- Financial info: Pets allowed with restrictions (conditional)
- HOA & community: Monthly association fee of $648; Association fees cover management, amenities, common areas, hot water, insurance, structural maintenance, pest control, reserve fund, roof, trash, and water; Association amenities include fitness center and trash service
Exterior
- Parking: Leased parking; On-street parking available
- Security: Closed-circuit cameras; Secured elevator; Secured lobby
- Utilities: Cable available
- Home design: Condo unit in a multi-story building; Faces north; Entry on level 5; Has attached property
- Construction: Brick and block construction; Building with 15 total stories; Resale unit
- Exterior features: No notable exterior features listed
Interior
- Kitchen: Dishwasher; Electric range; Disposal; Refrigerator
- Bedrooms: Bedroom on main level
- Flooring: Concrete flooring
- Bathrooms: 1 full bathroom
- Heating & cooling: Central heating (electric); Central air conditioning (electric)
- Interior features: Impact-resistant windows; Closet cabinetry; Living/dining room; Separate shower
- Laundry & utility: In-unit washer and dryer; Electric water heater; Laundry/utility room
Neighborhood map
What this means for you Summary
Snapshot
- This is a 1-bed/1.0-bath condo listed at $235k.
Deal economics
- At list price, monthly cash flow is $716 ($9k/yr) — positive.
- The deal already cash-flows at list — no discount required.
- Meets the 1% rule at list price ($4k rent vs $235k).
- Recommended offer: $228k (3.0% below list) — sets the bar for market timing.
- Cap rate 9.9% vs local median 1.9% in Miami — top-decile yield for the area; either an underpriced asset or a hidden risk that comps aren't pricing in. Stress-test before assuming the spread holds.
Location & tenants
- Location reads 78/100 on livability (#177 in FL, #2,724 nationally) — a middle-class / working-renter tenant base. Strengths: amenities A+, commute A+, health & safety A+; Watch: employment C-, crime F, cost of living F.
- Miami-Dade (suburban): math 45% / reading 54% proficiency, ranked #40 of 73 in FL (top 55%) — families likely to look elsewhere, expect single-tenant / working-renter base with shorter leases; 64% free/reduced lunch — lower-income household profile, screen leases tightly.
- Market conditions: Rents rising (+2.0%/yr); 1007 active listings in the ZIP; high-income renter base; 10,051 units permitted in Miami-Dade County in 2024 (7,758 in 5+ unit buildings).
- This rent runs 31% of the median local income ($144k/yr) — at the standard rent-burdened threshold; future hikes will face affordability resistance.
Forward outlook
- Local home prices are declining (-2.1%/yr); year-one equity from $2k of loan paydown is wiped out by about $5k of value loss. Plan a longer hold.
- Miami-Dade County population projected at +28% by 2050 — long-run rental-demand tailwind backs the buy-and-hold thesis.
- At projected returns (-2.1% appreciation + 2.0% rent growth), your $66k cash investment doubles in ~9 years — after that, you're playing with house money.
Negotiation context
- It's been on market 56 days — a 3% lower offer ($228k) is reasonable based on typical stale-listing flexibility.
Risks & watch-outs
- Watch-outs: built in 1951 — expect roof / HVAC / electrical / plumbing capex.
- Climate carrying-cost: moderate flood risk; severe wind risk, 99% chance of damaging wind over 30y; extreme-heat days projected 7→28/yr by 2055 (HVAC capex compounding) — expect insurance premiums to compound above CPI over the hold.
Questions for the listing agent
- It's been on market 56 days. Have you received any prior offers? Is the seller open to a 3% concession, seller financing, or rate buy-down credit?
- Built in 1951 — when were the roof, HVAC, electrical panel, plumbing, and water heater last replaced?
- What does the HOA fee cover, when was the last increase, and are there any pending special assessments or reserve-fund shortfalls?
- Any open or pending special assessments — roof, HVAC, plumbing, elevator, façade? What's the per-unit balance and payoff schedule, and is the seller paying it off at close or rolling it to the buyer?
- Is there a deadline driving the sale (1031 exchange, divorce, estate, relocation)? That informs how much negotiation room exists.
- Schools are B-rated — typically a magnet for longer-tenancy family renters. What's the average tenant stay here, and is there a school-zone premium baked into asking?
- Crime grade is F in this area — have there been break-ins, vandalism, or insurance claims at this property in the last 3 years? What carrier currently insures it and at what premium?
- What's the average days-on-market for RENTAL listings here right now (not sales)? A rising rental-DOM trend means longer vacancies and softer asking-rent achievability than the comps imply.
- What's the recent tenant-quality profile in this submarket — average credit score on applications, eviction rate, late-payment / NSF rate, and stable-employment percentage? A property-management company in the area should have these aggregated.
- How much new apartment / multifamily construction is in the pipeline within 1–3 miles? Heavy new supply (>2% of stock underway) typically softens rents 12–24 months out; light construction supports rent growth.
Investment metrics
- 1% rule
- 1.59% ✓
- Cap rate
- 9.95%
- Cash-on-cash
- 13.06%
- DSCR
- 1.58
- GRM
- 5.2
CMA / ARV
No comps found within radius.
Projected returns pro-forma
-2.09% appreciation · 2.04% rent growth · sell at horizon
- IRR
- 5.0%
- Equity multiple
- 1.20×
- Total profit
- $13,399
- Equity at exit
- $44,635
- IRR
- 12.0%
- Equity multiple
- 2.00×
- Total profit
- $65,760
- Equity at exit
- $37,190
Cash invested: $65,800 (down + closing). Projections, not guarantees.
Landlord ↔ Tenant lean methodology
- Overall (STATE)
- 87 Strongly Landlord-Friendly
- State Florida
- 87 Strongly Landlord-Friendly · R+3
- County
- — inherits STATE
- City
- — inherits STATE
ZIP-level market 33131
- Home prices YoY
- -0.7%
- Rents YoY
- 2.0%
- Active inventory
- 1007
- Price-to-rent
- 5.2×
Monthly cashflow live
- Estimated rent
- $3,736 medium interval (Pro) →
- Mortgage (P&I)
- −$1,232
- Tax from tax record
- −$257 /mo · $3,089/yr
- Insurance
- −$98
- HOA
- −$648
- Vacancy / Maint / Mgmt
- −$785
- Net cashflow
- $716
Break-even live
UW: 25.0% down · 7.5% · 30yr · 1.5% tax · 5.0% vac · 8.0% maint · 8.0% mgmt
Financing live
Cash to close
- Down payment
- $58,750
- Closing costs
- $7,050
- Reserves months
- —
- Total cash needed
- —
Loan-product check · same deal, 3 products live
Conventional
25% down · 7.5% · 30yr
- Down + closing
- —
- Monthly P&I
- —
- Monthly cashflow
- —
- DSCR
- —
- Eligible?
- —
Personal DTI + credit; lowest rate.
DSCR
20% down · 8.5% · 30yr
- Down + closing
- —
- Monthly P&I
- —
- Monthly cashflow
- —
- DSCR
- —
- Eligible?
- —
No personal income docs; deal must DSCR.
Hard money
10% down · 12.0% · 12mo
- Down + closing
- —
- Monthly P&I
- —
- Monthly cashflow
- —
- DSCR
- —
- Eligible?
- —
Short-term bridge; refi at stabilization.
HOA detail condo
- Monthly dues
- $648 · $7,776/yr
- Likely covers
- electric
- Assessments
- None detected in remarks — confirm with the listing agent.
Listing history 15 events
-
2026-06-18days on market $235,000 Active 56 DOM
-
2026-06-17days on market $235,000 Active 55 DOM
-
2026-06-16days on market $235,000 Active 54 DOM
-
2026-06-15days on market $235,000 Active 53 DOM
-
2026-06-13days on market $235,000 Active 51 DOM
-
2026-06-09days on market $235,000 Active 47 DOM
-
2026-06-08days on market $235,000 Active 46 DOM
-
2026-06-07days on market $235,000 Active 45 DOM
-
2026-06-04days on market $235,000 Active 42 DOM
-
2026-06-03days on market $235,000 Active 41 DOM
-
2026-06-02days on market $235,000 Active 40 DOM
-
2026-06-01days on market $235,000 Active 39 DOM
-
2026-05-31days on market $235,000 Active 38 DOM
-
2026-04-23$235,000 Active
-
2023-09-01soldstatus $240,000
ⓘ Source: listings_history table (triggers on properties + properties_extension) + one-shot
backfill from property_details.listing_events for pre-trigger history.
Tax reassessment forecast FL · Resets to sale price
- Current annual tax
- $3,089 · $257/mo
- Projected year-2 tax
- $3,089 · $257/mo
- Expected delta
- $0/yr ($0/mo · 0.0%)
ⓘ Screening estimate from a state-policy table — verify with the county assessor before closing.
Climate risk First Street
- Flood 5/10 Major FEMA zone X (unshaded) · 24% chance over 30 yrs
- Wildfire 1/10 Low
- Heat 10/10 Extreme 7 d/yr ≥103°F today · 28 d/yr by 30 yrs out
- Wind 10/10 Extreme 99% chance of damaging wind over 30 yrs
- Air quality 2/10 Low 1 unhealthy d/yr today · 1 by 30 yrs out
Nearby sold comps map
Loading sold comps map…
Walkable amenities ~0.75 mi
Loading nearby amenities…
Taxation est. · year 1
- Rental income
- $44,835
- − Mortgage interest
- −$13,164
- − Property taxes
- −$3,089
- − Insurance
- −$1,175
- − Repairs & maintenance
- −$3,587
- − Management
- −$3,587
- − HOA
- −$7,776
- − Depreciation
- −$6,836
- Taxable income
- $5,622
- Est. tax owed @ 24.0%
- −$1,349
- After-tax cash flow
- $7,243/yr
For passive investors: Depreciation is non-cash, so a rental often shows a tax loss while cash-flowing — sheltering income. Rental losses are passive: they offset passive income freely, and up to $25,000/yr can offset ordinary (W-2) income if you actively participate and your MAGI is under $100k (phasing out to $0 by $150k); unused losses carry forward. On sale, claimed depreciation is recaptured at up to 25%, and gains may owe capital-gains tax (a 1031 exchange can defer both). Figures are a year-1 estimate at your 24.0% rate — not tax advice; consult a CPA.
Schools (NCES district)
- District
- Miami-Dade
- NCES district ID
- 1200390
- Math proficiency
- 45% ▼ -16.00%
- Reading proficiency
- 54% ▼ -5.00%
- Median HH income
- $43,928
- Composite
- 41.76/100
- National rank
- #3397
- State rank
- #40 of 73 in FL
Livability — Miami
- Score
- 78/100
- State rank
- #177
- US rank
- #2724
Category grades
Schools grade is shown separately in the Schools card above.
Census & demographics
- Census place
- Miami, FL
- County
- Miami-Dade County · 2,697,751 people
- City population
- 827,308
- Metro
- Miami-Fort Lauderdale-Pompano Beach, FL
- Population (ZIP)
- 23,095
- Household income
- $144,138
- Rent vs Own
- Severe rent burden
- 1866.0
Population outlook (Miami-Dade County) Hauer SSP2
- Today (2025)
- 3,126,439 people
- By 2030
- 3,325,765 · +6.4%
- By 2040
- 3,697,561 · +18.3%
- By 2050
- 4,012,134 · +28.3%
- By 2075
- 4,605,612 · +47.3%
- By 2100
- 4,866,598 · +55.7%
Race, ethnicity, and origin ACS 2023
- Neighborhood character
- Diverse neighborhood (Simpson 0.61)
- Race & ethnicity
- Hispanic / Latino 52% Two or more races 35% White 33% Asian 4% Black 4%
- Hispanic origin (detail)
- Mexican 4% Puerto Rican 4% Cuban 8% Dominican 1% Salvadoran 3%
- Common ancestry
- Romanian 2% Scotch-Irish 2% Estonian 2%
- Foreign-born
- 54% · Canada, Jamaica, Dominican Republic
- Languages at home
- 30% English-only · Spanish 53% Other Indo-European 6% French/Haitian/Cajun 4%
Political lean MEDSL · Miami-Dade
- 2024 margin
- R (+11.4) · D 43.9% · R 55.4%
- 2008→2024 swing
- -27.6pp toward R · 2008: 16.1pp · 2024: -11.4pp
- All cycles
- 2024: R+11.4 2020: D+7.3 2016: D+29.6 2012: D+23.7 2008: D+16.1
Not yet ingested
- Civics
- —
Market trends
- HPI YoY
- ▼ -2.09%
- Current HPI
- 281.1156
- Rent YoY
- ▲ 2.04%
- Metro
- Miami-Fort Lauderdale-Pompano Beach, FL
- State GDP YoY
- ▲ 3.28%
- F500 in state
- 36
Industry mix (Fortune 500 HQ in FL)
| Industry | F500 HQs | Revenue |
|---|---|---|
| Industrial Technology | 2 | $29B |
|
||
| Insurance | 2 | $17B |
|
||
| Retail | 1 | $60B |
|
||
| Technology Distribution | 1 | $58B |
|
||
| Homebuilding | 1 | $35B |
|
||
| Technology Manufacturing | 1 | $35B |
|
||
Price history
-2.1% since first listed2 events — show timeline
- 2026-04-23 Listed $235,000 MARMLS
- 2023-09-01 Sold (Public Records) $240,000 Public Records
Property tax history
+5.2%/yrLatest (2025): $3,089 · -0.7% YoY. Source: county tax records.
Cash-flow waterfall
monthlySold comps — $/sqft
last 12 mo · ≤1 miLoading sold comps…