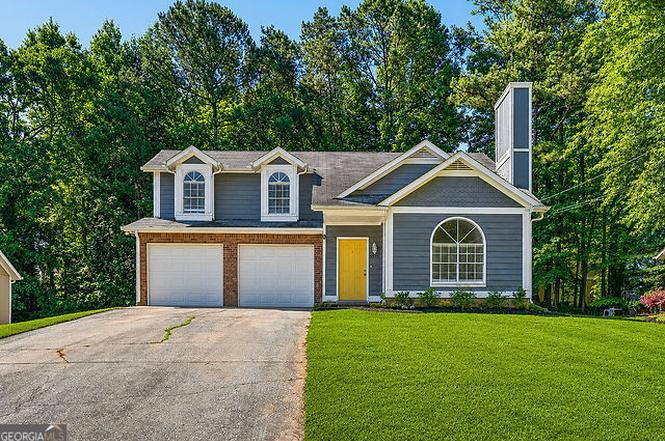
5515 Forest Downs Circle Cir · South Fulton, GA
Flood risk 1/10 · Minimal
- FEMA flood zone
- X (unshaded)
- Chance of flooding over 30 yrs
- 0.0%
- Est. flood insurance / yr
- $507 – $1,088
Fire risk 3/10 · Minor
- Est. fire insurance / yr
- $963 – $1,789
Heat risk 6/10 · Moderate
- Hot days now (above 104°F)
- 7 days/yr
- Hot days in 30 yrs
- 19 days/yr
Wind risk 6/10 · Moderate
- Chance of severe wind over 30 yrs
- 27.0%
Air-quality risk 3/10 · Minor
- Unhealthy air days now
- 3 days/yr
- Unhealthy air days in 30 yrs
- 4 days/yr
Risk factors via First Street. Map © Google.
Why this score? — see what drove the D grade
The composite is a weighted blend of 9 inputs, each scored 0–100. Each bar is that input's sub-score; the figure is the points it added to the 100-point composite (weight × sub-score).
- Cash flow +12.4/30.0
- Appreciation +10.0/10.0
- Schools +4.5/10.0
- DSCR +3.7/10.0
- 1% rule +3.3/10.0
- Rent growth +2.7/5.0
- Livability +2.5/5.0
- Condition / age +2.5/5.0
- ARV discount +0.0/15.0
$249,900
🖨 Deal sheet 📄 Offer letter ✓ Due diligence
Listing remarks MLS
Short Sale Opportunity! Welcome to this beautifully updated 3-bedroom, 2.5-bath home located in the desirable Forest Downs community of South Fulton. Offering exceptional curb appeal, a spacious two-car garage, and an extended driveway with ample parking for loved ones and guests, this residence combines comfort, style, and convenience. A fantastic opportunity for first-time homebuyers and savvy investors alike, this property features no HOA and no known rental restrictions, making it an excellent option for both owner-occupants and those seeking a valuable income-producing asset. Step inside to discover soaring ceilings, abundant natural light, and an inviting open-concept layout that seamlessly connects the living and dining areas. The main level also features a convenient laundry room, powder room, and a stunning renovated kitchen complete with new cabinetry, updated flooring, and sleek stainless-steel appliances-perfect for everyday living and entertaining. Upstairs, you'll find three bedrooms, including a spacious owner's retreat designed for relaxation. The primary suite boasts a large walk-in closet and a beautifully renovated en-suite bathroom featuring separate tub and shower. The secondary bedrooms are equally impressive and share an updated Jack-and-Jill bathroom, providing both style and functionality. Outside, the large, level backyard offers endless possibilities to create your own private outdoor oasis, whether it's for entertaining, gardening, or simply unwinding after a long day. Ideally located near major highways, shopping, dining, and everyday conveniences, this move-in-ready home delivers the perfect blend of comfort, style, and accessibility. Whether you're searching for your next home or your next investment, this property delivers outstanding value and long-term potential. Don't miss your opportunity to make this exceptional property your next home!
Key facts
- Level backyard
- Updated kitchen
- Large walk-in closet
Tags
Property features AI
Exterior
- Parking: Garage parking (2 spaces); Total parking for 4 vehicles
- Utilities: Public water; Public sewer; Electricity available (220 volts); Natural gas available
- Home design: Two-story home; Resale condition; No shared/common walls
- Construction: Vinyl and wood siding; Composition roof; Slab foundation; Built with energy-efficient appliances
- Exterior features: Patio; Other exterior features
Interior
- Kitchen: Stone and solid surface counters; Stained cabinets; Pantry; Kitchen open to family room; Electric range, dishwasher, microwave, refrigerator
- Bedrooms: Three bedrooms on the upper level
- Flooring: Carpet; Laminate; Tile
- Bathrooms: Two full bathrooms; One half bathroom (main level); Master bathroom with double vanity and separate tub and shower
- Heating & cooling: Central heating; Central air
- Interior features: High 9-ft ceilings on main level; Walk-in closet(s); Insulated windows; Gas log fireplace
- Laundry & utility: Laundry in hall
Neighborhood map
What this means for you Summary
Snapshot
- This is a 3-bed/2.5-bath single-family listed at $250k.
Deal economics
- At list price, monthly cash flow is $-41 ($-494/yr) — negative.
- To cash-flow at today's rent, offer at most $243k (2.9% below list).
- To meet the 1% rule (rent ≥ 1% of price), the offer needs to be $207k (17.3% below list).
- Recommended offer: $207k (17.3% below list) — sets the bar for 1% rule.
- Cap rate 6.1% vs local median 4.6% in South Fulton — top-decile yield for the area; either an underpriced asset or a hidden risk that comps aren't pricing in. Stress-test before assuming the spread holds.
Location & tenants
- Location reads: area grade D — affects rentability + tenant quality, not the cash-flow math above.
- Fulton County (suburban): math 49% / reading 53% proficiency, ranked #12 of 174 in GA (top 7%) — acceptable for families but not a draw, mixed tenant base, ~2y average lease.
- Zoned schools: Liberty Point Elementary School (math 37% / reading 31%, grade F, #554 of 1,228 statewide, top 46%, 694 students, 100% FRL); Camp Creek Middle School (math 17% / reading 32%, grade F, #301 of 470 statewide, top 66%, 644 students, 100% FRL); Langston Hughes High School (math 8% / reading 17%, grade F, #336 of 424 statewide, top 80%, 1,964 students, 65% FRL) — zoned schools average 88% FRL vs 41% district-wide (47 pts higher); higher-poverty schools than district average — tighter screening recommended.
- Zoned-school proficiency averages 24% at this address vs 51% district-wide (-27 pts) — the specific schools serving this property underperform the Fulton County average; the district grade overstates school quality for this exact location.
- Market conditions: Rents flat; 651 active listings in the ZIP; 26 comparable units currently listed for rent nearby; rentals at typical pace (median 24d on market — plan ~3-4 weeks tenant-placement turnaround); 11,565 units permitted in Fulton County in 2024 (8,159 in 5+ unit buildings).
Forward outlook
- In year one you build about $27k of equity ($2k loan paydown + $25k appreciation (10.0% local appreciation)).
- Fulton County population projected at +38% by 2050 — long-run rental-demand tailwind backs the buy-and-hold thesis.
- At projected returns (10.0% appreciation + 0.9% rent growth), your $70k cash investment doubles in ~3 years — after that, you're playing with house money.
- By year 2, paydown + projected appreciation supports a ~$43k cash-out refi (75% LTV) — recoverable capital for the next deal without selling this one.
Negotiation context
- Only 8 days on market — expect competitive offers; lowballing is unlikely to land.
- 6 sale attempts since 9y ago with the ask held roughly flat each time — persistent listings suggest the price (not the market) is what's stuck; bring a comps-based counter.
Risks & watch-outs
- Climate carrying-cost: major wind risk, 27% chance of damaging wind over 30y; extreme-heat days projected 7→19/yr by 2055 (HVAC capex compounding) — expect insurance premiums to compound above CPI over the hold.
Questions for the listing agent
- What do current leases actually rent for vs. the listed asking? Can we see a recent rent roll and the last 12 months of T-12 income?
- Is there a deadline driving the sale (1031 exchange, divorce, estate, relocation)? That informs how much negotiation room exists.
- The area grade is low — what's the realistic commute time and amenity access for the typical tenant pool here? Any planned neighborhood developments (good or bad) we should know about?
- What's the average days-on-market for RENTAL listings here right now (not sales)? A rising rental-DOM trend means longer vacancies and softer asking-rent achievability than the comps imply.
- What's the recent tenant-quality profile in this submarket — average credit score on applications, eviction rate, late-payment / NSF rate, and stable-employment percentage? A property-management company in the area should have these aggregated.
- How much new for-sale + rental construction is in the pipeline within 1–3 miles? Heavy new supply typically softens prices + rents 12–24 months out; constrained supply supports both.
Investment metrics
- 1% rule
- 0.83% ✗
- Cap rate
- 6.10%
- Cash-on-cash
- -0.71%
- DSCR
- 0.97
- GRM
- 10.1
CMA / ARV
- ARV (on-the-fly)
- $172,996
- Comps found
- 3
Show comp detail 3 sales within ~0.75 mi
| Address | Dist | Beds/Ba | Sqft | Sold | Price | $/sf | Match |
|---|---|---|---|---|---|---|---|
| 5075 Forest Downs Ln | 0.10mi | 3/2.0 | 1,248 (-12%) | 19mo | $129,000 | $103 | 57 |
| 5385 Forest Downs Cir | 0.17mi | 4/2.5 (+1) | 1,600 (+13%) | 19mo | $205,000 | $128 | 50 |
| 5454 Mason Rd | 0.51mi | 3/1.0 | 1,556 (+10%) | 10mo | $189,900 | $122 | 46 |
Match score weights: distance 35% · size 25% · config 20% · recency 20%. Top-matched comps best support the ARV.
Projected returns pro-forma
10.0% appreciation · 0.95% rent growth · sell at horizon
- IRR
- 23.1%
- Equity multiple
- 2.85×
- Total profit
- $129,303
- Equity at exit
- $225,130
- IRR
- 20.2%
- Equity multiple
- 6.36×
- Total profit
- $375,047
- Equity at exit
- $485,501
Cash invested: $69,972 (down + closing). Projections, not guarantees.
Landlord ↔ Tenant lean methodology
- Overall (STATE)
- 90 Strongly Landlord-Friendly
- State Georgia
- 90 Strongly Landlord-Friendly · R+3
- County
- — inherits STATE
- City
- — inherits STATE
ZIP-level market 30349
- Home prices YoY
- 4.6%
- Rents YoY
- 0.9%
- Active inventory
- 651
- Price-to-rent
- 10.1×
Monthly cashflow live
- Estimated rent
- $2,067 high interval (Pro) →
- Mortgage (P&I)
- −$1,311
- Tax from tax record
- −$259 /mo · $3,111/yr
- Insurance
- −$104
- HOA
- −$0
- Vacancy / Maint / Mgmt
- −$434
- Net cashflow
- $-41
Break-even live
UW: 25.0% down · 7.5% · 30yr · 1.5% tax · 5.0% vac · 8.0% maint · 8.0% mgmt
Financing live
Cash to close
- Down payment
- $62,475
- Closing costs
- $7,497
- Reserves months
- —
- Total cash needed
- —
Loan-product check · same deal, 3 products live
Conventional
25% down · 7.5% · 30yr
- Down + closing
- —
- Monthly P&I
- —
- Monthly cashflow
- —
- DSCR
- —
- Eligible?
- —
Personal DTI + credit; lowest rate.
DSCR
20% down · 8.5% · 30yr
- Down + closing
- —
- Monthly P&I
- —
- Monthly cashflow
- —
- DSCR
- —
- Eligible?
- —
No personal income docs; deal must DSCR.
Hard money
10% down · 12.0% · 12mo
- Down + closing
- —
- Monthly P&I
- —
- Monthly cashflow
- —
- DSCR
- —
- Eligible?
- —
Short-term bridge; refi at stabilization.
Rent comps 26 comps
| Address | Beds | Baths | Sqft | Rent | $/sqft | DOM | Units | Dist |
|---|---|---|---|---|---|---|---|---|
| 4812 Station Ln Atlanta, GA | 3.0 | 2.5 | 1695 | $2,100 | $1.24 | 1d | 1 | 0.32mi |
| 3416 Stonewall Ct Atlanta, GA | 3.0 | 2.5 | 1690 | $2,450 | $1.45 | 24d | 1 | 0.34mi |
| 5480 Sierra Trl Atlanta, GA | 3.0 | 2.5 | 1400 | $1,845 | $1.32 | 43d | 1 | 0.48mi |
| 4980 Stonewall Tell Rd Atlanta, GA | 3.0 | 2.0 | 1573 | $3,612 | $2.30 | 24d | 1 | 0.59mi |
| 4980 Stonewall Tell Rd Atlanta, GA | 2.0 | 2.0 | 1222 | $2,209 | $1.81 | 19d | 1 | 0.59mi |
| 4980 Stonewall Tell Rd Atlanta, GA | 2.0 | 2.0 | 1222 | $2,209 | $1.81 | 22d | 1 | 0.59mi |
| 4813 Brookwood Pl Atlanta, GA | 3.0 | 2.5 | 1624 | $2,075 | $1.28 | 43d | 1 | 0.99mi |
| 479 Thistle Cv Atlanta, GA | 3.0 | 2.0 | 1694 | $1,785 | $1.05 | 43d | 1 | 1.14mi |
| 4959 Wolfcreek Vw Atlanta, GA | 3.0 | 2.0 | 1230 | $1,945 | $1.58 | 24d | 1 | 1.14mi |
| 5950 Stonewall Dr Unit 2 Union City, GA | 3.0 | 1.5 | 1320 | $1,495 | $1.13 | 15d | 1 | 1.27mi |
| 5950 Stonewall Dr Unit 4 Union City, GA | 3.0 | 1.0 | 1320 | $1,445 | $1.09 | 3d | 1 | 1.27mi |
| 4037 Ravenwood Ct Union City, GA | 2.0 | 2.5 | 1394 | $1,595 | $1.14 | 24d | 1 | 1.29mi |
| 4037 Ravenwood Ct Union City, GA | 2.0 | 2.5 | 1394 | $1,625 | $1.17 | 43d | 1 | 1.29mi |
| 4037 Ravenwood Ct Union City, GA | 2.0 | 2.5 | 1394 | $1,595 | $1.14 | 15d | 1 | 1.29mi |
| 4037 Ravenwood Ct Union City, GA | 2.0 | 2.5 | 1394 | $1,595 | $1.14 | 1d | 1 | 1.29mi |
| 5140 Highpoint Rd Apt 27 Union City, GA | 2.0 | 2.5 | 1290 | $1,295 | $1.00 | 12d | 1 | 1.31mi |
| 5051 Larkspur Ln Atlanta, GA | 3.0 | 2.0 | 1403 | $1,885 | $1.34 | 5d | 1 | 1.35mi |
| 4951 Larkspur Ln Atlanta, GA | 2.0 | 1.0 | 1000 | $1,600 | $1.60 | 43d | 1 | 1.36mi |
| 4108 Robin Cir Atlanta, GA | 3.0 | 2.5 | 1786 | $2,400 | $1.34 | 43d | 1 | 1.37mi |
| 4509 Ravenwood Pl Union City, GA | 3.0 | 2.5 | 1394 | $1,970 | $1.41 | 12d | 1 | 1.39mi |
| 4122 Ravenwood Ct Union City, GA | 3.0 | 3.0 | 1394 | $1,849 | $1.33 | 24d | 1 | 1.39mi |
| 4407 Roche St Atlanta, GA | 3.0 | 2.0 | 1650 | $1,875 | $1.14 | 43d | 1 | 1.40mi |
| 4223 Reeshemah St Atlanta, GA | 3.0 | 2.5 | 1843 | $1,995 | $1.08 | 5d | 1 | 1.45mi |
| 4420 Roche St Atlanta, GA | 3.0 | 2.5 | 1622 | $2,130 | $1.31 | 43d | 1 | 1.46mi |
| 4407 Sparrow Cir Atlanta, GA | 3.0–5.0 | 2.5–3.0 | 2055 | $2,335 | $1.14 | 1d | 10 | 1.47mi |
| 4925 Brookwood Pl Atlanta, GA | 3.0 | 2.0 | 1248 | $1,950 | $1.56 | 5d | 1 | 1.48mi |
Listing history 6 events
-
2026-06-18days on market $249,900 Active 8 DOM
-
2026-06-17days on market $249,900 Active 7 DOM
-
2026-06-16days on market $249,900 Active 6 DOM
-
2026-06-15days on market $249,900 Active 5 DOM
-
2026-06-13remarks 699-char remark
-
2026-06-13$249,900 Active 3 DOM
ⓘ Source: listings_history table (triggers on properties + properties_extension) + one-shot
backfill from property_details.listing_events for pre-trigger history.
Tax reassessment forecast GA · Resets to sale price
- Current annual tax
- $3,111 · $259/mo
- Projected year-2 tax
- $3,111 · $259/mo
- Expected delta
- $0/yr ($0/mo · 0.0%)
ⓘ Screening estimate from a state-policy table — verify with the county assessor before closing.
Climate risk First Street
- Flood 1/10 Low FEMA zone X (unshaded) · 0% chance over 30 yrs
- Wildfire 3/10 Moderate
- Heat 6/10 Major 7 d/yr ≥104°F today · 19 d/yr by 30 yrs out
- Wind 6/10 Major 27% chance of damaging wind over 30 yrs
- Air quality 3/10 Moderate 3 unhealthy d/yr today · 4 by 30 yrs out
Nearby sold comps map
Loading sold comps map…
Walkable amenities ~0.75 mi
Loading nearby amenities…
Taxation est. · year 1
- Rental income
- $24,801
- − Mortgage interest
- −$13,998
- − Property taxes
- −$3,111
- − Insurance
- −$1,250
- − Repairs & maintenance
- −$1,984
- − Management
- −$1,984
- − Depreciation
- −$7,270
- Taxable loss
- −$4,796
- Est. tax savings @ 24.0%
- +$1,151
- After-tax cash flow
- $657/yr
For passive investors: Depreciation is non-cash, so a rental often shows a tax loss while cash-flowing — sheltering income. Rental losses are passive: they offset passive income freely, and up to $25,000/yr can offset ordinary (W-2) income if you actively participate and your MAGI is under $100k (phasing out to $0 by $150k); unused losses carry forward. On sale, claimed depreciation is recaptured at up to 25%, and gains may owe capital-gains tax (a 1031 exchange can defer both). Figures are a year-1 estimate at your 24.0% rate — not tax advice; consult a CPA.
Schools (NCES district)
- District
- Fulton County
- NCES district ID
- 1302280
- Math proficiency
- 49% ▼ -2.00%
- Reading proficiency
- 53% ▬ 0.00%
- Median HH income
- $68,035
- Composite
- 45.33/100
- National rank
- #2640
- State rank
- #12 of 174 in GA
Livability — South Fulton
No livability data for this city. (Only ~50 U.S. cities are tracked.)
Census & demographics
- Census place
- South Fulton, GA
- County
- Fulton County · 1,094,430 people
- City population
- 127,674
- Metro
- Atlanta-Sandy Springs-Alpharetta, GA
- Population (ZIP)
- 79,872
- Household income
- $67,023
- Rent vs Own
- Severe rent burden
- 4258.0
Population outlook (Fulton County) Hauer SSP2
- Today (2025)
- 1,203,707 people
- By 2030
- 1,299,706 · +8.0%
- By 2040
- 1,488,256 · +23.6%
- By 2050
- 1,664,580 · +38.3%
- By 2075
- 2,036,072 · +69.2%
- By 2100
- 2,222,402 · +84.6%
Race, ethnicity, and origin ACS 2023
- Neighborhood character
- Predominantly Black (89%)
- Race & ethnicity
- Black 89% Hispanic / Latino 5% Two or more races 4% White 3%
- Foreign-born
- 9% · Canada
- Languages at home
- 88% English-only · Spanish 6% French/Haitian/Cajun 1%
Political lean MEDSL · Fulton
- 2024 margin
- Solid D (+44.9) · D 71.9% · R 27.0% · Other 1.1%
- 2008→2024 swing
- +9.8pp toward D · 2008: 35.0pp · 2024: 44.9pp
- All cycles
- 2024: D+44.9 2020: D+46.4 2016: D+42.1 2012: D+29.6 2008: D+35.0
Not yet ingested
- Civics
- —
Market trends
- HPI YoY
- ▲ 18.01%
- Current HPI
- 407.99
- Rent YoY
- ▲ 0.95%
- Metro
- Atlanta-Sandy Springs-Alpharetta, GA
- State GDP YoY
- ▲ 2.66%
- F500 in state
- 28
Industry mix (Fortune 500 HQ in GA)
| Industry | F500 HQs | Revenue |
|---|---|---|
| Paper / Packaging | 2 | $29B |
|
||
| Retail | 1 | $160B |
|
||
| Transportation / Logistics | 1 | $91B |
|
||
| Airlines | 1 | $62B |
|
||
| Consumer Goods | 1 | $47B |
|
||
| Utilities | 1 | $25B |
|
||
Price history
+268.0% since first listed19 events — show timeline
- 2026-06-10 Listed $249,900 GAMLS
- 2026-06-10 Listed $249,900 FMLS
- 2024-03-04 Sold (Public Records) $275,000 Public Records
- 2024-02-29 Sold (MLS) $275,000 FMLS
- 2024-02-29 Sold (MLS) $275,000 GAMLS
- 2024-02-19 Pending — FMLS
- 2024-02-18 Contingent — FMLS
- 2024-02-17 Pending — GAMLS
- 2024-01-31 Listed $278,500 FMLS
- 2024-01-31 Listed $278,500 GAMLS
- 2018-06-25 Sold (Public Records) $90,500 Public Records
- 2018-06-21 Sold (MLS) $90,500 GAMLS
- 2018-06-06 Pending — GAMLS
- 2018-03-09 Listed $99,999 GAMLS
- 2018-01-19 Listing Removed — GAMLS
- 2017-09-05 Listed $99,999 GAMLS
- 2015-11-10 Sold (Public Records) $55,100 Public Records
- 1998-04-23 Sold (Public Records) $80,000 Public Records
- 1991-12-30 Sold (Public Records) $67,900 Public Records
Property tax history
+4.4%/yrLatest (2025): $3,111 · -3.7% YoY. Source: county tax records.
Cash-flow waterfall
monthlySold comps — $/sqft
last 12 mo · ≤1 miLoading sold comps…