 🏷️ Likely Rental
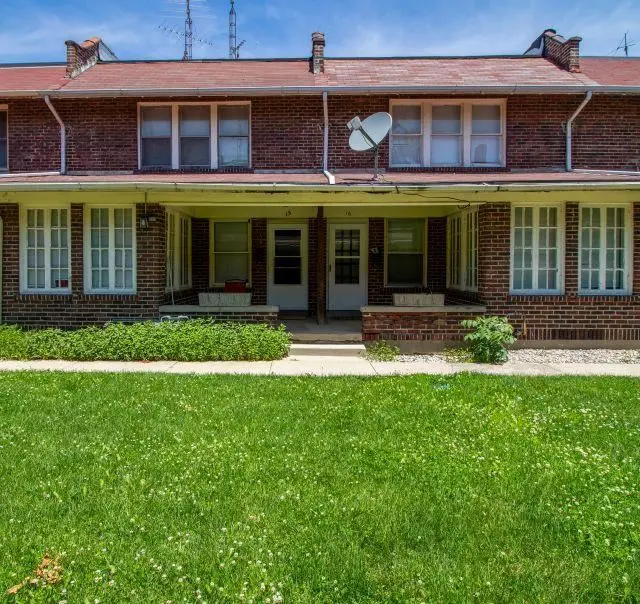
15 Howard Pl · Richmond, IN
Flood risk 1/10 · Minimal
- FEMA flood zone
- X (unshaded)
- Chance of flooding over 30 yrs
- 0.0%
- Est. flood insurance / yr
- $473 – $860
Fire risk 1/10 · Minimal
- Est. fire insurance / yr
- $717 – $1,331
Heat risk 3/10 · Minor
- Hot days now (above 100°F)
- 7 days/yr
- Hot days in 30 yrs
- 18 days/yr
Wind risk 2/10 · Minimal
- Chance of severe wind over 30 yrs
- 1.0%
Air-quality risk 3/10 · Minor
- Unhealthy air days now
- 2 days/yr
- Unhealthy air days in 30 yrs
- 3 days/yr
Risk factors via First Street. Map © Google.
Why this score? — see what drove the B+ grade
The composite is a weighted blend of 9 inputs, each scored 0–100. Each bar is that input's sub-score; the figure is the points it added to the 100-point composite (weight × sub-score).
- Cash flow +30.0/30.0
- ARV discount +15.0/15.0
- 1% rule +10.0/10.0
- DSCR +10.0/10.0
- Livability +4.2/5.0
- Rent growth +2.5/5.0
- Condition / age +2.5/5.0
- Schools +1.9/10.0
- Appreciation +0.0/10.0
$56,000
🖨 Deal sheet (PDF) 📄 Offer letter ✓ Due diligence
Listing remarks MLS
Currently occupied with a month to month tenant paying $450 per month for this 2 BR, 1 BA, 2 story townhouse. Annual HOA fee of $200. Call or Text Debbie Rudd at 765-969-6822 for additional information.
Key facts
- Built 1920
- Listed 7 days
Property features AI
Exterior
- Utilities: Public water; Public sewer
- Home design: Residential condominium; 2-story
- Construction: Brick construction
- Exterior features: Asphalt shingle roof; Residential zoning
Interior
- Kitchen: Electric range; Refrigerator
- Bedrooms: 5 total rooms (includes bedrooms and living spaces)
- Bathrooms: 1 full bathroom
- Heating & cooling: Forced air heating (natural gas); Central air conditioning
- Interior features: Electric range; Refrigerator; Gas water heater; Full unfinished basement
- Laundry & utility: Gas water heater
Neighborhood map
What this means for you Summary
Snapshot
- This is a 2-bed/1.0-bath single-family listed at $56k.
Deal economics
- At list price, monthly cash flow is $319 ($4k/yr) — positive.
- The deal already cash-flows at list — no discount required.
- Meets the 1% rule at list price ($871 rent vs $56k).
- Cap rate 13.1% vs local median 5.2% in Richmond — top-decile yield for the area; either an underpriced asset or a hidden risk that comps aren't pricing in. Stress-test before assuming the spread holds.
Location & tenants
- Location reads 83/100 on livability (#10 in IN, #869 nationally) — a professional / high-income tenant draw. Strengths: commute A+, cost of living A+, housing A+; Watch: crime D+, employment D-.
- Richmond Community Schools (town): math 18% / reading 27% proficiency, ranked #270 of 301 in IN (top 90%) — low school quality limits family demand, transient renter base, plan for 1-2y turnover; 65% free/reduced lunch — lower-income household profile, screen leases tightly.
- Zoned schools: Starr Elementary School (math 22% / reading 12%, grade F, #837 of 994 statewide, top 86%, 212 students, 93% FRL); Test Intermediate School (math 13% / reading 24%, grade F, #276 of 330 statewide, top 84%, 762 students, 75% FRL); Richmond High School (math 21% / reading 48%, grade F, #270 of 369 statewide, top 77%, 1,332 students, 66% FRL).
- Market conditions: 277 active listings in the ZIP; 2 comparable units currently listed for rent nearby; 38 units permitted in Wayne County in 2024 (0 in 5+ unit buildings).
Forward outlook
- Local home prices are declining (-3.0%/yr); year-one equity from $387 of loan paydown is wiped out by about $2k of value loss. Plan a longer hold.
- Wayne County population projected at -21% by 2050 — secular population decline; favor cash flow + early exit over multi-decade hold.
- At projected returns (-3.0% appreciation + 3.0% rent growth), your $16k cash investment doubles in ~5 years — after that, you're playing with house money.
Negotiation context
- Only 7 days on market — expect competitive offers; lowballing is unlikely to land.
- 3 sale attempts since 11y ago with the ask held roughly flat each time — persistent listings suggest the price (not the market) is what's stuck; bring a comps-based counter.
- Current owner paid $36k; list at $56k implies a 56% gain — meaningful room to come down on a strong offer.
Risks & watch-outs
- Watch-outs: built in 1920 — expect roof / HVAC / electrical / plumbing capex.
Questions for the listing agent
- Built in 1920 — when were the roof, HVAC, electrical panel, plumbing, and water heater last replaced?
- Is there a deadline driving the sale (1031 exchange, divorce, estate, relocation)? That informs how much negotiation room exists.
- Schools are D-rated, which usually means shorter tenancies and higher turnover. Who's the typical renter profile here, and what's been the actual vacancy rate?
- Crime grade is D in this area — have there been break-ins, vandalism, or insurance claims at this property in the last 3 years? What carrier currently insures it and at what premium?
- What's the average days-on-market for RENTAL listings here right now (not sales)? A rising rental-DOM trend means longer vacancies and softer asking-rent achievability than the comps imply.
- What's the recent tenant-quality profile in this submarket — average credit score on applications, eviction rate, late-payment / NSF rate, and stable-employment percentage? A property-management company in the area should have these aggregated.
- How much new for-sale + rental construction is in the pipeline within 1–3 miles? Heavy new supply typically softens prices + rents 12–24 months out; constrained supply supports both.
Investment metrics
- 1% rule
- 1.55% ✓
- Cap rate
- 13.12%
- Cash-on-cash
- 24.39%
- DSCR
- 2.09
- GRM
- 5.4
CMA / ARV
- ARV (on-the-fly)
- $83,664
- Comps found
- 12
Show comp detail 12 sales within ~0.75 mi
| Address | Dist | Beds/Ba | Sqft | Sold | Price | $/sf | Match |
|---|---|---|---|---|---|---|---|
| 327 N 10th St #18 | 0.00mi | 2/1.0 | 1,008 (0%) | 2mo | $56,201 | $56 | 98 |
| 9 NW J St | 0.68mi | 2/1.0 | 984 (-2%) | 3mo | $81,500 | $83 | 62 |
| 836 N 12th St | 0.42mi | 2/1.0 | 924 (-8%) | 11mo | $70,000 | $76 | 58 |
| 31 NW J St | 0.70mi | 2/1.0 | 952 (-6%) | 2mo | $78,000 | $82 | 56 |
| 948 Sheridan St | 0.69mi | 2/1.0 | 946 (-6%) | 5mo | $90,000 | $95 | 54 |
| 800 15th St | 0.53mi | 3/1.0 (+1) | 1,065 (+6%) | 11mo | $29,500 | $28 | 52 |
| 106 NW G St | 0.72mi | 3/1.0 (+1) | 1,056 (+5%) | 6mo | $70,000 | $66 | 48 |
| 827 N 17th St | 0.69mi | 3/1.0 (+1) | 960 (-5%) | 9mo | $89,900 | $94 | 48 |
| 413 NW 2nd St | 0.75mi | 3/1.0 (+1) | 1,074 (+6%) | 12mo | $71,500 | $67 | 39 |
| 1120 Butler St | 0.75mi | 2/1.0 | 896 (-11%) | 10mo | $79,000 | $88 | 39 |
| 1017 Butler St | 0.66mi | 3/2.0 (+1) | 1,144 (+14%) | 3mo | $100,000 | $87 | 36 |
| 8 Sunset Dr | 0.74mi | 3/1.0 (+1) | 1,152 (+14%) | 8mo | $163,900 | $142 | 30 |
Match score weights: distance 35% · size 25% · config 20% · recency 20%. Top-matched comps best support the ARV.
Projected returns pro-forma
-3.0% appreciation · 3.0% rent growth · sell at horizon
- IRR
- 17.7%
- Equity multiple
- 1.72×
- Total profit
- $11,228
- Equity at exit
- $8,350
- IRR
- 26.2%
- Equity multiple
- 3.29×
- Total profit
- $35,926
- Equity at exit
- $4,842
Cash invested: $15,680 (down + closing). Projections, not guarantees.
Landlord ↔ Tenant lean methodology
- Overall (STATE)
- 90 Strongly Landlord-Friendly
- State Indiana
- 90 Strongly Landlord-Friendly · R+11
- County
- — inherits STATE
- City
- — inherits STATE
ZIP-level market 47374
- Active inventory
- 277
- Price-to-rent
- 5.4×
Monthly cashflow live
- Estimated rent
- $871 medium interval (Pro) →
- Mortgage (P&I)
- −$294
- Tax from tax record
- −$52 /mo · $624/yr
- Insurance
- −$23
- HOA
- −$0
- Vacancy / Maint / Mgmt
- −$183
- Net cashflow
- $319
Break-even live
Sensitivity live
| Price | -10% $350 | -5% $335 | +0% $319 | +5% $303 | +10% $287 |
|---|---|---|---|---|---|
| Rent | -10% $250 | -5% $284 | +0% $319 | +5% $353 | +10% $388 |
| Rate | -1.0pp $347 | -0.5pp $333 | base $319 | +0.5pp $304 | +1.0pp $289 |
UW: 25.0% down · 7.5% · 30yr · 1.5% tax · 5.0% vac · 8.0% maint · 8.0% mgmt
Financing live
Cash to close
- Down payment
- $14,000
- Closing costs
- $1,680
- Reserves months
- —
- Total cash needed
- —
Loan-product check · same deal, 3 products live
Conventional
25% down · 7.5% · 30yr
- Down + closing
- —
- Monthly P&I
- —
- Monthly cashflow
- —
- DSCR
- —
- Eligible?
- —
Personal DTI + credit; lowest rate.
DSCR
20% down · 8.5% · 30yr
- Down + closing
- —
- Monthly P&I
- —
- Monthly cashflow
- —
- DSCR
- —
- Eligible?
- —
No personal income docs; deal must DSCR.
Hard money
10% down · 12.0% · 12mo
- Down + closing
- —
- Monthly P&I
- —
- Monthly cashflow
- —
- DSCR
- —
- Eligible?
- —
Short-term bridge; refi at stabilization.
Rent comps 2 comps
| Address | Beds | Baths | Sqft | Rent | $/sqft | DOM | Units | Dist |
|---|---|---|---|---|---|---|---|---|
| 401 N 10th St Richmond, IN | 1.0–2.0 | 1.0 | 817 | $895 | $1.09 | 45d | 3 | 0.06mi |
| 1032 S 23rd St Richmond, IN | 1.0–2.0 | 1.0 | 937 | $790 | $0.84 | 45d | 4 | 1.49mi |
Listing history 5 events
-
2026-06-12statusdays on market $56,000 Pending 7 DOM
-
2026-06-09days on market $56,000 Active 6 DOM
-
2026-06-08days on market $56,000 Active 5 DOM
-
2026-06-07remarks 699-char remark
-
2026-06-07$56,000 Active 4 DOM
ⓘ Source: listings_history table (triggers on properties + properties_extension) + one-shot
backfill from property_details.listing_events for pre-trigger history.
Tax reassessment forecast IN · Partial reset (capped growth)
- Current annual tax
- $624 · $52/mo
- Projected year-2 tax
- $624 · $52/mo
- Expected delta
- $0/yr ($0/mo · 0.0%)
ⓘ Screening estimate from a state-policy table — verify with the county assessor before closing.
Climate risk First Street
- Flood 1/10 Low FEMA zone X (unshaded) · 0% chance over 30 yrs
- Wildfire 1/10 Low
- Heat 3/10 Moderate 7 d/yr ≥100°F today · 18 d/yr by 30 yrs out
- Wind 2/10 Low 100% chance of damaging wind over 30 yrs
- Air quality 3/10 Moderate 2 unhealthy d/yr today · 3 by 30 yrs out
Nearby sold comps map
Loading sold comps map…
Walkable amenities ~0.75 mi
Loading nearby amenities…
Taxation est. · year 1
- Rental income
- $10,447
- − Mortgage interest
- −$3,137
- − Property taxes
- −$624
- − Insurance
- −$280
- − Repairs & maintenance
- −$836
- − Management
- −$836
- − Depreciation
- −$1,629
- Taxable income
- $3,105
- Est. tax owed @ 24.0%
- −$745
- After-tax cash flow
- $3,080/yr
For passive investors: Depreciation is non-cash, so a rental often shows a tax loss while cash-flowing — sheltering income. Rental losses are passive: they offset passive income freely, and up to $25,000/yr can offset ordinary (W-2) income if you actively participate and your MAGI is under $100k (phasing out to $0 by $150k); unused losses carry forward. On sale, claimed depreciation is recaptured at up to 25%, and gains may owe capital-gains tax (a 1031 exchange can defer both). Figures are a year-1 estimate at your 24.0% rate — not tax advice; consult a CPA.
Schools (NCES district)
- District
- Richmond Community Schools
- NCES district ID
- 1809510
- Math proficiency
- 18% ▼ -7.00%
- Reading proficiency
- 27% ▼ -2.00%
- Median HH income
- $35,288
- Composite
- 18.55/100
- National rank
- #8913
- State rank
- #270 of 301 in IN
Livability — Richmond
- Score
- 83/100
- State rank
- #10
- US rank
- #869
Category grades
Schools grade is shown separately in the Schools card above.
Census & demographics
- Census place
- Richmond, IN
- County
- Wayne County · 44,615 people
- City population
- 44,615
- Metro
- Richmond, IN
- Population (ZIP)
- 44,615
- Household income
- $50,766
- Rent vs Own
- Severe rent burden
- 1600.0
Population outlook (Wayne County) Hauer SSP2
- Today (2025)
- 63,316 people
- By 2030
- 60,893 · -3.8%
- By 2040
- 55,386 · -12.5%
- By 2050
- 49,946 · -21.1%
- By 2075
- 37,900 · -40.1%
- By 2100
- 26,562 · -58.0%
Race, ethnicity, and origin ACS 2023
- Neighborhood character
- Predominantly White (82%)
- Race & ethnicity
- White 82% Two or more races 7% Black 6% Hispanic / Latino 4% Asian 1%
- Common ancestry
- Slovak 2% Italian 1% Lithuanian 1%
- Foreign-born
- 4% · Canada, China
- Languages at home
- 95% English-only · Spanish 3%
Political lean MEDSL · Wayne
- 2024 margin
- Solid R (+32.5) · D 32.9% · R 65.4% · Other 1.6%
- 2008→2024 swing
- -28.6pp toward R · 2008: -3.9pp · 2024: -32.5pp
- All cycles
- 2024: R+32.5 2020: R+29.1 2016: R+30.1 2012: R+14.7 2008: R+3.9
Not yet ingested
- Civics
- —
Market trends
- HPI YoY
- ▼ -118.64%
- Current HPI
- 182.5038
- Rent YoY
- —
- Metro
- Richmond, IN
- State GDP YoY
- ▲ 2.90%
- F500 in state
- 18
Industry mix (Fortune 500 HQ in IN)
| Industry | F500 HQs | Revenue |
|---|---|---|
| Industrial Machinery | 2 | $37B |
|
||
| Healthcare | 1 | $177B |
|
||
| Pharmaceuticals | 1 | $45B |
|
||
| Metals / Steel | 1 | $18B |
|
||
| Agriculture | 1 | $17B |
|
||
| Packaging | 1 | $12B |
|
||
Price history
+119.6% since first listed6 events — show timeline
- 2026-06-01 Listed $56,000 RRELMS
- 2025-08-22 Sold (MLS) $36,000 RRELMS
- 2025-08-08 Delisted — RRELMS
- 2025-07-22 Listed $35,000 RRELMS
- 2015-05-20 Sold (MLS) $21,000 RRELMS
- 2015-02-09 Listed $25,500 RRELMS
Property tax history
-3.1%/yrLatest (2024): $624 · +13.9% YoY. Source: county tax records.
Cash-flow waterfall
monthlySold comps — $/sqft
last 12 mo · ≤1 miLoading sold comps…