10 Leo Dr · Fairview Heights, IL
Flood risk 1/10 · Minimal
- FEMA flood zone
- X
- Chance of flooding over 30 yrs
- 0.0%
- Est. flood insurance / yr
- $473 – $860
Fire risk 1/10 · Minimal
- Est. fire insurance / yr
- $804 – $1,492
Heat risk 5/10 · Moderate
- Hot days now (above 108°F)
- 7 days/yr
- Hot days in 30 yrs
- 20 days/yr
Wind risk 2/10 · Minimal
- Chance of severe wind over 30 yrs
- 1.0%
Air-quality risk 3/10 · Minor
- Unhealthy air days now
- 2 days/yr
- Unhealthy air days in 30 yrs
- 4 days/yr
Risk factors via First Street. Map © Google.
Why this score? — see what drove the D- grade
The composite is a weighted blend of 9 inputs, each scored 0–100. Each bar is that input's sub-score; the figure is the points it added to the 100-point composite (weight × sub-score).
- Cash flow +16.1/30.0
- DSCR +5.0/10.0
- 1% rule +4.5/10.0
- Livability +3.8/5.0
- Rent growth +2.5/5.0
- Condition / age +2.5/5.0
- Schools +2.2/10.0
- ARV discount +0.0/15.0
- Appreciation +0.0/10.0
$185,000
🖨 Deal sheet (PDF) 📄 Offer letter ✓ Due diligence
Listing remarks MLS
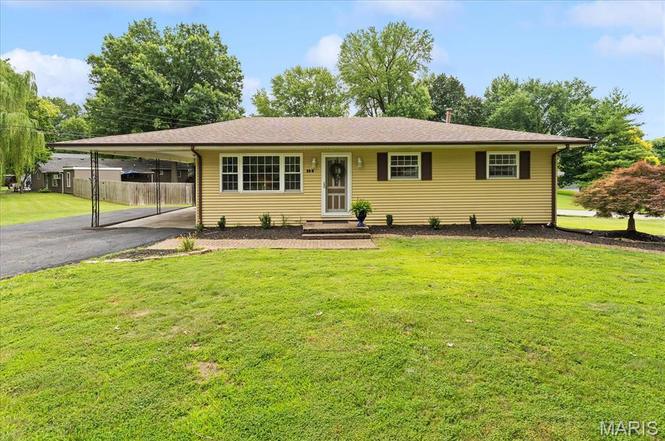
Looking for investment property, or that special place to call your next home, then this one may be for you! Priced with updates in mind, this 3 bedroom, 2 bath, walkout ranch with attached carport, wide asphalt driveway, and tuck under garage sits on a generous 0.37 acre lot and features newer vinyl windows, all replaced ~2006. Architectural roof new in either 2012-2013. Living, dining, kitchen, three bedrooms, and full bath are all on the main level. Kitchen is open to dining. Ahead of its time the kitchen features a gas cooktop with overhead exhaust, gas wall oven, and a good amount of cabinet space. Refrigerator is newer and stays. Good size bedrooms are all separated by large hallway with coat closet, and whole house exhaust fan which received a new motor approx. last year. Full main level bathroom features oversized single vanity, faux marble tub with surround, exhaust fan, window, and huge closet. Lower level recreation room walks out to a good sized yard. The lower level 3/4 bath is shared with laundry; this bathroom has not been used in some time but has a ton of potential. Unfinished bonus/ storage room with under stair storage. Furnace and water heater replaced some time ago, ages unknown. Don't let this one get away! Being sold as-is, where-is. Seller to make no repairs, nor inspections, including occupancy. Buyer to verify all info.
Key facts
- Finished basement
- New appliances
- Remodeled home
Tags
Property features AI
Finance
- Other: Home warranty offered; Lease not considered
Exterior
- Parking: 2 parking spaces total; 1-car garage; 1-car carport
- Utilities: Public water; Public sewer; Electric service by Ameren; Electricity, natural gas, water and sewer connected
- Home design: Single-family residence, one level; Private ownership
- Construction: Vinyl siding
- Exterior features: Back yard; Lot is irregularly shaped (approx. 0.37 acres)
Interior
- Kitchen: Kitchen on the main level (approx. 21 x 12) with dishwasher, gas range, refrigerator
- Bedrooms: 3 bedrooms on the main level
- Bathrooms: 2 full bathrooms (one on the main level, one in the basement)
- Heating & cooling: Forced air heating; Central air conditioning
- Interior features: Dishwasher, Gas Range, Refrigerator; Partially finished full basement with a bathroom; Central air
- Laundry & utility: Utilities connected: electricity, natural gas, water, sewer
Neighborhood map
What this means for you Summary
Snapshot
- This is a 3-bed/2.0-bath single-family listed at $185k.
Deal economics
- At list price, monthly cash flow is $94 ($1k/yr) — positive.
- The deal already cash-flows at list — no discount required.
- To meet the 1% rule (rent ≥ 1% of price), the offer needs to be $175k (5.4% below list).
- Recommended offer: $175k (5.4% below list) — sets the bar for 1% rule.
- Cap rate 6.9% vs local median 4.1% in Fairview Heights — top-decile yield for the area; either an underpriced asset or a hidden risk that comps aren't pricing in. Stress-test before assuming the spread holds.
Location & tenants
- Location reads 75/100 on livability (#225 in IL, #4,180 nationally) — a middle-class / working-renter tenant base. Strengths: commute A+, cost of living A+, housing A+; Watch: crime F, amenities F, health & safety F.
- Belleville Twp Hsd 201 (suburban): math 21% / reading 28% proficiency, ranked #308 of 620 in IL (top 50%) — low school quality limits family demand, transient renter base, plan for 1-2y turnover.
- Zoned schools: Illini Elem School (math 22% / reading 32%, grade F, #749 of 2,056 statewide, top 40%, 327 students, 0% FRL); Grant Middle School (math 10% / reading 18%, grade F, #529 of 665 statewide, top 80%, 235 students, 0% FRL); Belleville High School-East (math 23% / reading 30%, grade F, #241 of 693 statewide, top 35%, 2,568 students, 0% FRL).
- Market conditions: 84 active listings in the ZIP; 5 comparable units currently listed for rent nearby; rentals at typical pace (median 26d on market — plan ~3-4 weeks tenant-placement turnaround); solid renter incomes; 783 units permitted in St. Clair County in 2024 (378 in 5+ unit buildings).
Forward outlook
- Local home prices are declining (-3.0%/yr); year-one equity from $1k of loan paydown is wiped out by about $6k of value loss. Plan a longer hold.
- St. Clair County population projected at -23% by 2050 — secular population decline; favor cash flow + early exit over multi-decade hold.
Negotiation context
- Only 3 days on market — expect competitive offers; lowballing is unlikely to land.
- Current owner paid $115k; list at $185k implies a 61% gain — meaningful room to come down on a strong offer.
Risks & watch-outs
- Watch-outs: built in 1950 — expect roof / HVAC / electrical / plumbing capex.
- Climate carrying-cost: extreme-heat days projected 7→20/yr by 2055 (HVAC capex compounding) — expect insurance premiums to compound above CPI over the hold.
Questions for the listing agent
- Built in 1950 — when were the roof, HVAC, electrical panel, plumbing, and water heater last replaced?
- Is there a deadline driving the sale (1031 exchange, divorce, estate, relocation)? That informs how much negotiation room exists.
- Schools are D-rated, which usually means shorter tenancies and higher turnover. Who's the typical renter profile here, and what's been the actual vacancy rate?
- Crime grade is F in this area — have there been break-ins, vandalism, or insurance claims at this property in the last 3 years? What carrier currently insures it and at what premium?
- The area grade is low — what's the realistic commute time and amenity access for the typical tenant pool here? Any planned neighborhood developments (good or bad) we should know about?
- What's the average days-on-market for RENTAL listings here right now (not sales)? A rising rental-DOM trend means longer vacancies and softer asking-rent achievability than the comps imply.
- What's the recent tenant-quality profile in this submarket — average credit score on applications, eviction rate, late-payment / NSF rate, and stable-employment percentage? A property-management company in the area should have these aggregated.
- How much new for-sale + rental construction is in the pipeline within 1–3 miles? Heavy new supply typically softens prices + rents 12–24 months out; constrained supply supports both.
Investment metrics
- 1% rule
- 0.95% ✗
- Cap rate
- 6.90%
- Cash-on-cash
- 2.18%
- DSCR
- 1.10
- GRM
- 8.8
CMA / ARV
- ARV (on-the-fly)
- $157,920
- Comps found
- 12
Show comp detail 12 sales within ~0.75 mi
| Address | Dist | Beds/Ba | Sqft | Sold | Price | $/sf | Match |
|---|---|---|---|---|---|---|---|
| 209 Roselawn Ave | 0.14mi | 3/1.0 | 1,176 (+5%) | 13mo | $165,000 | $140 | 70 |
| 42 Concord Dr | 0.28mi | 3/1.5 | 1,161 (+4%) | 13mo | $165,000 | $142 | 68 |
| 56 Concord Dr | 0.21mi | 3/2.0 | 1,217 (+9%) | 14mo | $176,000 | $145 | 64 |
| 36 Mark Dr | 0.23mi | 2/1.5 (-1) | 1,148 (+2%) | 18mo | $164,900 | $144 | 64 |
| 203 Meckfessel Dr | 0.50mi | 3/1.0 | 1,088 (-3%) | 8mo | $139,900 | $129 | 61 |
| 7 Leo Dr | 0.04mi | 2/1.0 (-1) | 960 (-14%) | 7mo | $106,500 | $111 | 59 |
| 61 Pine Trl | 0.33mi | 3/1.0 | 1,024 (-9%) | 11mo | $125,000 | $122 | 57 |
| 200 Primrose Ln | 0.64mi | 3/1.0 | 1,066 (-5%) | 4mo | $149,900 | $141 | 55 |
| 10 Meckfessel Dr | 0.61mi | 2/1.0 (-1) | 1,066 (-5%) | 2mo | $190,000 | $178 | 53 |
| 212 Mcknight Rd | 0.69mi | 3/2.0 | 1,203 (+7%) | 6mo | $170,000 | $141 | 50 |
| 108 Meckfessel Dr | 0.56mi | 3/1.5 | 988 (-12%) | 5mo | $150,000 | $152 | 48 |
| 102 Dogwood Ln | 0.71mi | 4/3.0 (+1) | 1,271 (+14%) | 3mo | $170,000 | $134 | 33 |
Match score weights: distance 35% · size 25% · config 20% · recency 20%. Top-matched comps best support the ARV.
Projected returns pro-forma
-3.0% appreciation · 3.0% rent growth · sell at horizon
- IRR
- -12.8%
- Equity multiple
- 0.54×
- Total profit
- $-23,947
- Equity at exit
- $27,584
- IRR
- -3.8%
- Equity multiple
- 0.75×
- Total profit
- $-12,998
- Equity at exit
- $15,995
Cash invested: $51,800 (down + closing). Projections, not guarantees.
Landlord ↔ Tenant lean methodology
- Overall (STATE)
- 43 Moderately Tenant-Leaning
- State Illinois
- 43 Moderately Tenant-Leaning · D+7
- County
- — inherits STATE
- City
- — inherits STATE
ZIP-level market 62208
- Home prices YoY
- -34.2%
- Active inventory
- 84
- Price-to-rent
- 8.8×
Monthly cashflow live
- Estimated rent
- $1,750 medium interval (Pro) →
- Mortgage (P&I)
- −$970
- Tax from tax record
- −$241 /mo · $2,892/yr
- Insurance
- −$77
- HOA
- −$0
- Vacancy / Maint / Mgmt
- −$367
- Net cashflow
- $94
Break-even live
Sensitivity live
| Price | -10% $199 | -5% $147 | +0% $94 | +5% $42 | +10% $-11 |
|---|---|---|---|---|---|
| Rent | -10% $-44 | -5% $25 | +0% $94 | +5% $163 | +10% $232 |
| Rate | -1.0pp $187 | -0.5pp $141 | base $94 | +0.5pp $46 | +1.0pp $-3 |
UW: 25.0% down · 7.5% · 30yr · 1.5% tax · 5.0% vac · 8.0% maint · 8.0% mgmt
Financing live
Cash to close
- Down payment
- $46,250
- Closing costs
- $5,550
- Reserves months
- —
- Total cash needed
- —
Loan-product check · same deal, 3 products live
Conventional
25% down · 7.5% · 30yr
- Down + closing
- —
- Monthly P&I
- —
- Monthly cashflow
- —
- DSCR
- —
- Eligible?
- —
Personal DTI + credit; lowest rate.
DSCR
20% down · 8.5% · 30yr
- Down + closing
- —
- Monthly P&I
- —
- Monthly cashflow
- —
- DSCR
- —
- Eligible?
- —
No personal income docs; deal must DSCR.
Hard money
10% down · 12.0% · 12mo
- Down + closing
- —
- Monthly P&I
- —
- Monthly cashflow
- —
- DSCR
- —
- Eligible?
- —
Short-term bridge; refi at stabilization.
Rent comps 5 comps
| Address | Beds | Baths | Sqft | Rent | $/sqft | DOM | Units | Dist |
|---|---|---|---|---|---|---|---|---|
| 13 Edding Ln Fairview Heights, IL | 3.0 | 1.5 | 1430 | $850 | $0.59 | 13d | 1 | 0.35mi |
| 10021 Saint Clair Ave Fairview Heights, IL | 2.0 | 1.0 | 924 | $1,700 | $1.84 | 25d | 1 | 0.71mi |
| 6 Ram Ct Fairview Heights, IL | 2.0 | 1.5 | 1100 | $1,775 | $1.61 | 25d | 1 | 0.95mi |
| 115 Longacre Dr Unit 1 Fairview Heights, IL | 2.0 | 1.5 | 1168 | $1,450 | $1.24 | 25d | 1 | 0.98mi |
| 21 Northbrook Cir Fairview Heights, IL | 1.0–3.0 | 1.0–2.0 | 992 | $1,985 | $2.00 | 0d | 7 | 1.03mi |
Listing history 3 events
-
2026-06-21statusdays on market $185,000 Active 3 DOM
-
2026-06-17remarks 699-char remark
-
2026-06-17$185,000 Coming Soon 1 DOM
ⓘ Source: listings_history table (triggers on properties + properties_extension) + one-shot
backfill from property_details.listing_events for pre-trigger history.
Tax reassessment forecast IL · Partial reset (capped growth)
- Current annual tax
- $2,892 · $241/mo
- Projected year-2 tax
- $3,546 · $295/mo
- Expected delta
- +$654/yr (+$54/mo · 22.6%)
ⓘ Screening estimate from a state-policy table — verify with the county assessor before closing.
Climate risk First Street
- Flood 1/10 Low FEMA zone X · 0% chance over 30 yrs
- Wildfire 1/10 Low
- Heat 5/10 Major 7 d/yr ≥108°F today · 20 d/yr by 30 yrs out
- Wind 2/10 Low 100% chance of damaging wind over 30 yrs
- Air quality 3/10 Moderate 2 unhealthy d/yr today · 4 by 30 yrs out
Nearby sold comps map
Loading sold comps map…
Walkable amenities ~0.75 mi
Loading nearby amenities…
Taxation est. · year 1
- Rental income
- $20,999
- − Mortgage interest
- −$10,363
- − Property taxes
- −$2,892
- − Insurance
- −$925
- − Repairs & maintenance
- −$1,680
- − Management
- −$1,680
- − Depreciation
- −$5,382
- Taxable loss
- −$1,923
- Est. tax savings @ 24.0%
- +$461
- After-tax cash flow
- $1,592/yr
For passive investors: Depreciation is non-cash, so a rental often shows a tax loss while cash-flowing — sheltering income. Rental losses are passive: they offset passive income freely, and up to $25,000/yr can offset ordinary (W-2) income if you actively participate and your MAGI is under $100k (phasing out to $0 by $150k); unused losses carry forward. On sale, claimed depreciation is recaptured at up to 25%, and gains may owe capital-gains tax (a 1031 exchange can defer both). Figures are a year-1 estimate at your 24.0% rate — not tax advice; consult a CPA.
Schools (NCES district)
- District
- Belleville Twp Hsd 201
- NCES district ID
- 1705640
- Math proficiency
- 21% ▼ -8.00%
- Reading proficiency
- 28% ▼ -3.00%
- Median HH income
- $58,064
- Composite
- 22.39/100
- National rank
- #8115
- State rank
- #308 of 620 in IL
Livability — Fairview Heights
- Score
- 75/100
- State rank
- #225
- US rank
- #4180
Category grades
Schools grade is shown separately in the Schools card above.
Census & demographics
- Census place
- Fairview Heights, IL
- County
- Saint Clair County · 169,691 people
- City population
- 16,821
- Metro
- St. Louis, MO-IL
- Population (ZIP)
- 16,821
- Household income
- $80,205
- Rent vs Own
- Severe rent burden
- 555.0
Population outlook (St. Clair County) Hauer SSP2
- Today (2025)
- 250,366 people
- By 2030
- 240,511 · -3.9%
- By 2040
- 217,391 · -13.2%
- By 2050
- 192,699 · -23.0%
- By 2075
- 140,637 · -43.8%
- By 2100
- 100,499 · -59.9%
Race, ethnicity, and origin ACS 2023
- Neighborhood character
- Diverse neighborhood (Simpson 0.64)
- Race & ethnicity
- White 50% Black 33% Two or more races 11% Asian 3% Hispanic / Latino 3%
- Common ancestry
- Lithuanian 2% Romanian 2% Slovak 2%
- Foreign-born
- 4% · Canada, South Korea, Jamaica
- Languages at home
- 96% English-only · Spanish 2% Arabic 1%
Political lean MEDSL · St. Clair
- 2024 margin
- Lean D (+7.9) · D 53.0% · R 45.1% · Other 1.8%
- 2008→2024 swing
- -14.6pp toward R · 2008: 22.4pp · 2024: 7.9pp
- All cycles
- 2024: D+7.9 2020: D+8.7 2016: D+5.6 2012: D+14.5 2008: D+22.4
Not yet ingested
- Civics
- —
Market trends
- HPI YoY
- ▼ -71.14%
- Current HPI
- 136.8631
- Rent YoY
- —
- Metro
- St. Louis, MO-IL
- State GDP YoY
- ▲ 1.59%
- F500 in state
- 60
Industry mix (Fortune 500 HQ in IL)
| Industry | F500 HQs | Revenue |
|---|---|---|
| Insurance | 4 | $201B |
|
||
| Consumer Goods | 4 | $87B |
|
||
| Industrial Machinery | 3 | $64B |
|
||
| Healthcare | 2 | $55B |
|
||
| Retail / Pharmacy | 1 | $148B |
|
||
| Agriculture / Food | 1 | $86B |
|
||
Price history
+60.9% since first listed5 events — show timeline
- 2026-06-17 Coming Soon $185,000 MARIS as Distributed by MLS Grid
- 2026-03-20 Sold (Public Records) $115,000 Public Records
- 2026-03-20 Sold (MLS) — MARIS as Distributed by MLS Grid
- 2026-02-21 Pending — MARIS as Distributed by MLS Grid
- 2026-02-19 Listed $115,000 MARIS as Distributed by MLS Grid
Property tax history
+4.5%/yrLatest (2024): $2,892 · +5.2% YoY. Source: county tax records.
Cash-flow waterfall
monthlySold comps — $/sqft
last 12 mo · ≤1 miLoading sold comps…