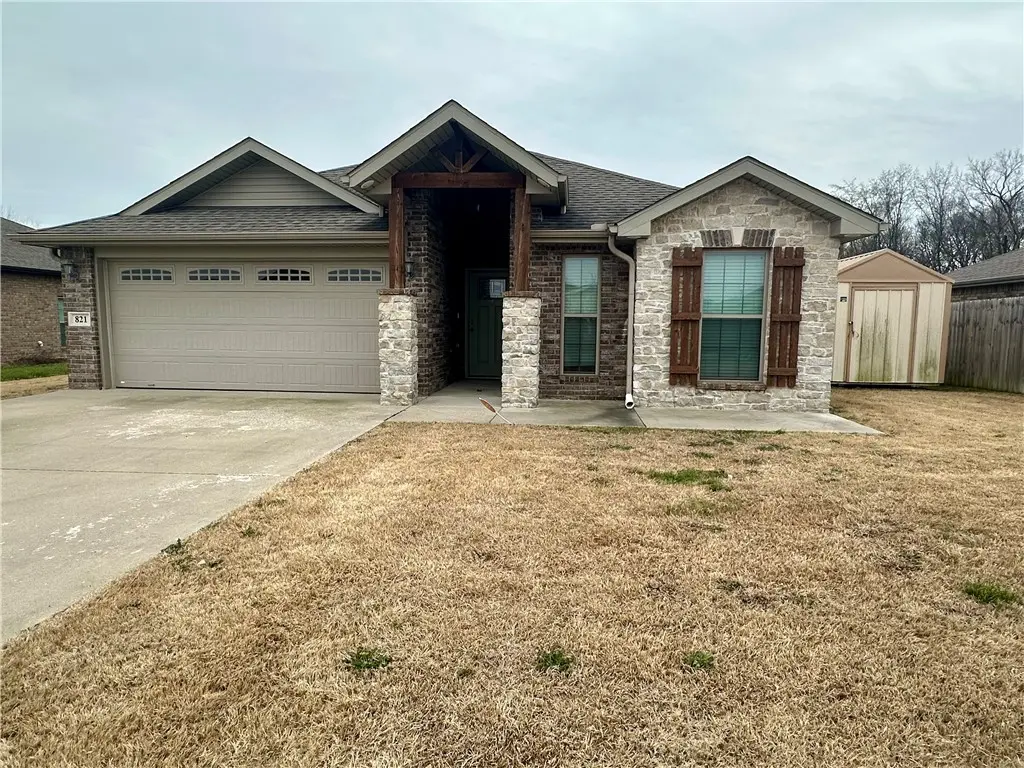
821 63rd Ave · Highfill, AR
Flood risk 1/10 · Minimal
- FEMA flood zone
- X (unshaded)
- Chance of flooding over 30 yrs
- 0.0%
- Est. flood insurance / yr
- $507 – $1,088
Fire risk 4/10 · Minor
- Est. fire insurance / yr
- $1,499 – $2,785
Heat risk 5/10 · Moderate
- Hot days now (above 106°F)
- 7 days/yr
- Hot days in 30 yrs
- 20 days/yr
Wind risk 2/10 · Minimal
- Chance of severe wind over 30 yrs
- 2.0%
Air-quality risk 1/10 · Minimal
- Unhealthy air days now
- 0 days/yr
- Unhealthy air days in 30 yrs
- 0 days/yr
Risk factors via First Street. Map © Google.
Why this score? — see what drove the D grade
The composite is a weighted blend of 9 inputs, each scored 0–100. Each bar is that input's sub-score; the figure is the points it added to the 100-point composite (weight × sub-score).
- ARV discount +12.4/15.0
- Appreciation +10.0/10.0
- Cash flow +6.6/30.0
- Schools +5.2/10.0
- Livability +3.4/5.0
- Rent growth +2.6/5.0
- Condition / age +2.5/5.0
- DSCR +0.9/10.0
- 1% rule +0.8/10.0
$290,000
🖨 Deal sheet (PDF) 📄 Offer letter ✓ Due diligence
Listing remarks MLS
Don't miss out on this spacious Craftsman style home featuring modern open floor plan with spacious living area open to the kitchen and dining. 9 ft vaulted ceilings and door leading out to covered patio area great for entertaining. Home is energy efficient with 40 inches of TAP thermal acoustical attic insulation. Added convenience of a smart garage system, a Vivint security system adding both security and ease to your daily routine. Only 10 minutes from XNA airport and 20 min from Walmart home office. Fiber Optic Internet.
Key facts
- Split floor plan
- Level lot
- Concrete flooring
Tags
Property features AI
Finance
- HOA & community: Monthly association fee; Community curbs; Near schools
Exterior
- Parking: Attached garage; 2 covered parking spaces
- Security: Security system
- Utilities: Electricity available; Public water; Sewer available
- Home design: Single-story; Brick construction; Slab foundation; Architectural shingle roof; Located on a public road; Level lot in a subdivision
- Construction: Built with brick exterior
- Exterior features: Concrete driveway; Patio; Back yard fencing; Storage structure
Interior
- Kitchen: Counter top; Dishwasher; Microwave; Refrigerator
- Flooring: Carpet; Concrete; Tile
- Bathrooms: 2 full bathrooms
- Heating & cooling: Central heating; Central air conditioning
- Interior features: Attic; Ceiling fan(s); Granite counters; Pantry; Split bedrooms; Storage
- Laundry & utility: Washer hookup; Dryer hookup; Electric water heater
Neighborhood map
What this means for you Summary
Snapshot
- This is a 3-bed/2.0-bath single-family listed at $290k.
Deal economics
- At list price, monthly cash flow is $-476 ($-6k/yr) — negative.
- To cash-flow at today's rent, offer at most $206k (29.0% below list).
- To meet the 1% rule (rent ≥ 1% of price), the offer needs to be $167k (42.3% below list).
- Recommended offer: $167k (42.3% below list) — sets the bar for 1% rule.
- Cap rate 4.3% vs local median 2.9% in Highfill — top-decile yield for the area; either an underpriced asset or a hidden risk that comps aren't pricing in. Stress-test before assuming the spread holds.
Location & tenants
- Location reads 67/100 on livability (#97 in AR) — a middle-class / working-renter tenant base. Strengths: crime A+, employment A+, cost of living A+; Watch: schools F, amenities F, commute F.
- Bentonville School District (urban): math 59% / reading 59% proficiency, ranked #3 of 238 in AR (top 1%) — acceptable for families but not a draw, mixed tenant base, ~2y average lease.
- Market conditions: Rents flat; 690 active listings in the ZIP; 38 comparable units currently listed for rent nearby; rentals at typical pace (median 22d on market — plan ~3-4 weeks tenant-placement turnaround); high-income renter base; 4,359 units permitted in Benton County in 2024 (402 in 5+ unit buildings).
- This rent is only 17% of the median local income ($120k/yr) — well below the 30% rent-burden line; pricing power to push rent on renewal without tenant pushback.
Forward outlook
- In year one you build about $31k of equity ($2k loan paydown + $29k appreciation (10.0% local appreciation)).
- Benton County population projected at +56% by 2050 — long-run rental-demand tailwind backs the buy-and-hold thesis.
- By year 2, paydown + projected appreciation supports a ~$50k cash-out refi (75% LTV) — recoverable capital for the next deal without selling this one.
Negotiation context
- It's been on market 88 days — a 6% lower offer ($273k) is reasonable based on typical stale-listing flexibility.
- 3 sale attempts since 8y ago; this cycle's ask has dropped $20k (6%) from the opening price — seller is motivated, your offer sets the floor, not the list.
Risks & watch-outs
- Climate carrying-cost: extreme-heat days projected 7→20/yr by 2055 (HVAC capex compounding) — expect insurance premiums to compound above CPI over the hold.
Questions for the listing agent
- What do current leases actually rent for vs. the listed asking? Can we see a recent rent roll and the last 12 months of T-12 income?
- It's been on market 88 days. Have you received any prior offers? Is the seller open to a 42% concession, seller financing, or rate buy-down credit?
- Why hasn't it sold? Are there any deal-killer items the seller is aware of (foundation, flood, title, zoning, code violations)?
- Is there a deadline driving the sale (1031 exchange, divorce, estate, relocation)? That informs how much negotiation room exists.
- Schools are F-rated, which usually means shorter tenancies and higher turnover. Who's the typical renter profile here, and what's been the actual vacancy rate?
- The area grade is low — what's the realistic commute time and amenity access for the typical tenant pool here? Any planned neighborhood developments (good or bad) we should know about?
- What's the average days-on-market for RENTAL listings here right now (not sales)? A rising rental-DOM trend means longer vacancies and softer asking-rent achievability than the comps imply.
- What's the recent tenant-quality profile in this submarket — average credit score on applications, eviction rate, late-payment / NSF rate, and stable-employment percentage? A property-management company in the area should have these aggregated.
- How much new for-sale + rental construction is in the pipeline within 1–3 miles? Heavy new supply typically softens prices + rents 12–24 months out; constrained supply supports both.
Investment metrics
- 1% rule
- 0.58% ✗
- Cap rate
- 4.33%
- Cash-on-cash
- -7.03%
- DSCR
- 0.69
- GRM
- 14.4
CMA / ARV
- ARV (on-the-fly)
- $325,116
- Comps found
- 12
Show comp detail 12 sales within ~0.75 mi
| Address | Dist | Beds/Ba | Sqft | Sold | Price | $/sf | Match |
|---|---|---|---|---|---|---|---|
| 729 NW 64th Ave | 0.10mi | 3/2.0 | 1,525 (-7%) | 2mo | $304,000 | $199 | 82 |
| 709 NW 64th Ave | 0.15mi | 3/2.0 | 1,467 (-11%) | 2mo | $277,000 | $189 | 74 |
| 5909 Sherman St | 0.32mi | 3/2.0 | 1,750 (+7%) | 2mo | $326,000 | $186 | 73 |
| 6401 NW Harley St | 0.27mi | 3/2.0 | 1,805 (+10%) | 1mo | $357,287 | $198 | 70 |
| 6002 Hoover St | 0.59mi | 3/2.0 | 1,655 (+1%) | 3mo | $318,000 | $192 | 69 |
| 6417 NW Harley St | 0.29mi | 3/2.0 | 1,805 (+10%) | 3mo | $360,000 | $199 | 68 |
| 6005 NW Grant St | 0.67mi | 3/2.0 | 1,685 (+3%) | 0mo | $319,500 | $190 | 64 |
| 717 NW 69th Ave | 0.33mi | 4/2.0 (+1) | 1,514 (-8%) | 3mo | $292,000 | $193 | 64 |
| 6007 NW Hoover St | 0.55mi | 3/2.0 | 1,748 (+6%) | 2mo | $320,000 | $183 | 62 |
| 6312 NW Zella St | 0.25mi | 4/3.0 (+1) | 1,887 (+15%) | 1mo | $377,778 | $200 | 54 |
| 6408 NW Zella St | 0.26mi | 4/3.0 (+1) | 1,887 (+15%) | 1mo | $373,183 | $198 | 53 |
| 6009 NW Hancock St | 0.40mi | 4/2.0 (+1) | 1,433 (-13%) | 2mo | $285,000 | $199 | 53 |
Match score weights: distance 35% · size 25% · config 20% · recency 20%. Top-matched comps best support the ARV.
Projected returns pro-forma
10.0% appreciation · 0.39% rent growth · sell at horizon
- IRR
- 18.7%
- Equity multiple
- 2.52×
- Total profit
- $123,269
- Equity at exit
- $261,255
- IRR
- 17.0%
- Equity multiple
- 5.67×
- Total profit
- $378,823
- Equity at exit
- $563,406
Cash invested: $81,200 (down + closing). Projections, not guarantees.
Landlord ↔ Tenant lean methodology
- Overall (STATE)
- 92 Strongly Landlord-Friendly
- State Arkansas
- 92 Strongly Landlord-Friendly · R+14
- County
- — inherits STATE
- City
- — inherits STATE
ZIP-level market 72713
- Home prices YoY
- 3.5%
- Rents YoY
- 0.4%
- Active inventory
- 690
- Price-to-rent
- 14.4×
Monthly cashflow live
- Estimated rent
- $1,674 high interval (Pro) →
- Mortgage (P&I)
- −$1,521
- Tax from tax record
- −$156 /mo · $1,875/yr
- Insurance
- −$121
- HOA
- −$0
- Vacancy / Maint / Mgmt
- −$352
- Net cashflow
- $-476
Break-even live
Sensitivity live
| Price | -10% $-311 | -5% $-393 | +0% $-476 | +5% $-558 | +10% $-640 |
|---|---|---|---|---|---|
| Rent | -10% $-608 | -5% $-542 | +0% $-476 | +5% $-409 | +10% $-343 |
| Rate | -1.0pp $-329 | -0.5pp $-402 | base $-476 | +0.5pp $-551 | +1.0pp $-627 |
UW: 25.0% down · 7.5% · 30yr · 1.5% tax · 5.0% vac · 8.0% maint · 8.0% mgmt
Financing live
Cash to close
- Down payment
- $72,500
- Closing costs
- $8,700
- Reserves months
- —
- Total cash needed
- —
Loan-product check · same deal, 3 products live
Conventional
25% down · 7.5% · 30yr
- Down + closing
- —
- Monthly P&I
- —
- Monthly cashflow
- —
- DSCR
- —
- Eligible?
- —
Personal DTI + credit; lowest rate.
DSCR
20% down · 8.5% · 30yr
- Down + closing
- —
- Monthly P&I
- —
- Monthly cashflow
- —
- DSCR
- —
- Eligible?
- —
No personal income docs; deal must DSCR.
Hard money
10% down · 12.0% · 12mo
- Down + closing
- —
- Monthly P&I
- —
- Monthly cashflow
- —
- DSCR
- —
- Eligible?
- —
Short-term bridge; refi at stabilization.
Rent comps 38 comps
| Address | Beds | Baths | Sqft | Rent | $/sqft | DOM | Units | Dist |
|---|---|---|---|---|---|---|---|---|
| 864 NW Evans Cir Bentonville, AR | 4.0 | 2.0 | 1497 | $1,650 | $1.10 | 24d | 1 | 0.19mi |
| 817 NW 67th Ave Bentonville, AR | 3.0 | 2.0 | 1311 | $1,595 | $1.22 | 24d | 1 | 0.19mi |
| 6103 NW McClellen St Bentonville, AR | 4.0 | 2.0 | 1433 | $1,795 | $1.25 | 24d | 1 | 0.22mi |
| 6807 NW Toby St Bentonville, AR | 3.0 | 2.0 | 1300 | $1,495 | $1.15 | 15d | 1 | 0.35mi |
| 805 NW 70th Ave Bentonville, AR | 3.0 | 2.5 | 2021 | $2,350 | $1.16 | 14d | 1 | 0.35mi |
| 6813 NW Toby St Bentonville, AR | 3.0 | 2.0 | 1300 | $1,495 | $1.15 | 15d | 1 | 0.35mi |
| 514 NW 69th Ave Bentonville, AR | 3.0 | 2.0 | 1300 | $1,395 | $1.07 | 24d | 1 | 0.36mi |
| 6002 NW Meade St Bentonville, AR | 3.0 | 2.0 | 1860 | $1,825 | $0.98 | 24d | 1 | 0.38mi |
| 632 NW 69th Ave Bentonville, AR | 3.0 | 2.0 | 1300 | $1,395 | $1.07 | 24d | 1 | 0.38mi |
| 511 NW 68th Ave Bentonville, AR | 3.0 | 2.0 | 1300 | $1,495 | $1.15 | 22d | 1 | 0.39mi |
| 617 NW 69th Ave Bentonville, AR | 3.0 | 2.0 | 1300 | $1,450 | $1.12 | 24d | 1 | 0.39mi |
| 613 NW 69th Ave Bentonville, AR | 3.0 | 2.0 | 1300 | $1,495 | $1.15 | 15d | 1 | 0.40mi |
| 615 NW 69th Ave Highfill, AR | 3.0 | 2.0 | 1300 | $1,450 | $1.12 | 24d | 1 | 0.40mi |
| 523 NW 68th Ave Bentonville, AR | 3.0 | 2.0 | 1300 | $1,495 | $1.15 | 15d | 1 | 0.40mi |
| 500 NW 69th Ave Unit 6810 Bentonville, AR | 3.0 | 2.0 | 1300 | $1,450 | $1.12 | 24d | 1 | 0.42mi |
| 500 NW 69th Ave Unit 6812 Bentonville, AR | 3.0 | 2.0 | 1300 | $1,495 | $1.15 | 22d | 1 | 0.42mi |
| 535 NW 69th Ave Bentonville, AR | 3.0 | 2.0 | 1300 | $1,495 | $1.15 | 22d | 1 | 0.43mi |
| 525 NW 69th Ave Bentonville, AR | 3.0 | 2.0 | 1300 | $1,495 | $1.15 | 15d | 1 | 0.45mi |
| 523 NW 69th Ave Highfill, AR | 3.0 | 2.0 | 1300 | $1,495 | $1.15 | 15d | 1 | 0.46mi |
| 521 NW 69th Ave Bentonville, AR | 3.0 | 2.0 | 1300 | $1,450 | $1.12 | 24d | 1 | 0.46mi |
| 6810 NW Trevy St Bentonville, AR | 3.0 | 2.0 | 1300 | $1,495 | $1.15 | 15d | 1 | 0.50mi |
| 424 NW 59 Ave Bentonville, AR | 3.0 | 2.0 | 1782 | $2,150 | $1.21 | 14d | 1 | 0.54mi |
| 500 NW 69th Ave Bentonville, AR | 3.0 | 2.0 | 1300 | $1,395 | $1.07 | 22d | 1 | 0.54mi |
| 500 NW 69th Ave Bentonville, AR | 3.0 | 2.0 | 1300 | $1,445 | $1.11 | 14d | 8 | 0.54mi |
| 6005 NW Hoover St Bentonville, AR | 4.0 | 2.0 | 1433 | $1,595 | $1.11 | 15d | 1 | 0.55mi |
| 6603 NW Altus St Bentonville, AR | 3.0 | 2.0 | 1251 | $1,495 | $1.20 | 24d | 1 | 0.72mi |
| 6607 NW Altus St Bentonville, AR | 3.0 | 2.0 | 1256 | $1,450 | $1.15 | 24d | 1 | 0.73mi |
| 313 NW 65th Ave Bentonville, AR | 3.0 | 2.0 | 1250 | $1,450 | $1.16 | 24d | 1 | 0.73mi |
| 6619 NW Altus St Bentonville, AR | 3.0 | 2.0 | 1256 | $1,495 | $1.19 | 24d | 1 | 0.74mi |
| 6600 NW Altus St Highfill, AR | 4.0 | 2.0 | 1454 | $1,595 | $1.10 | 15d | 1 | 0.75mi |
| 6605 NW Vandergriff St Bentonville, AR | 4.0 | 2.0 | 1454 | $1,595 | $1.10 | 15d | 1 | 0.78mi |
| 6608 NW Vandergriff St Highfill, AR | 4.0 | 2.0 | 1454 | $1,595 | $1.10 | 15d | 1 | 0.82mi |
| 210 NW 67th Ave Bentonville, AR | 4.0 | 2.0 | 1454 | $1,595 | $1.10 | 15d | 1 | 0.89mi |
| 111 NW 63rd Ave Bentonville, AR | 2.0–4.0 | 2.0 | 1116 | $1,610 | $1.44 | 14d | 19 | 0.95mi |
| 6307 NW Kathleen St Bentonville, AR | 3.0 | 2.0 | 1256 | $1,495 | $1.19 | 24d | 1 | 0.95mi |
| 6503 NW Kathleen St Bentonville, AR | 3.0 | 2.0 | 1256 | $1,495 | $1.19 | 24d | 1 | 0.95mi |
| 6502 NW Kathleen St Bentonville, AR | 3.0 | 2.0 | 1250 | $1,495 | $1.20 | 24d | 1 | 0.97mi |
| 6500 NW Kathleen St Bentonville, AR | 3.0 | 2.0 | 1250 | $1,450 | $1.16 | 24d | 1 | 0.98mi |
Listing history 22 events
-
2026-06-18days on market $290,000 Active 88 DOM
-
2026-06-17days on market $290,000 Active 87 DOM
-
2026-06-15days on market $290,000 Active 85 DOM
-
2026-06-14days on market $290,000 Active 83 DOM
-
2026-06-10days on market $290,000 Active 80 DOM
-
2026-06-09days on market $290,000 Active 79 DOM
-
2026-06-08days on market $290,000 Active 78 DOM
-
2026-06-07days on market $290,000 Active 77 DOM
-
2026-06-05days on market $290,000 Active 74 DOM
-
2026-06-03days on market $290,000 Active 73 DOM
-
2026-06-02statusdays on market $290,000 Active 72 DOM
-
2026-05-31statusdays on market $290,000 Pending 71 DOM
-
2026-05-04price $290,000
-
2026-04-13price $300,000
-
2026-03-20$310,000 Active
-
2025-10-15price $317,000
-
2025-03-19soldstatus $312,400
-
2025-03-14soldstatus $312,400 Closed 530-char remark
Show marketing remark (530 chars)
Don't miss out on this spacious Craftsman style home featuring modern open floor plan with spacious living area open to the kitchen and dining. 9 ft vaulted ceilings and door leading out to covered patio area great for entertaining. Home is energy efficient with 40 inches of TAP thermal acoustical attic insulation. Added convenience of a smart garage system, a Vivint security system adding both security and ease to your daily routine. Only 10 minutes from XNA airport and 20 min from Walmart home office. Fiber Optic Internet.
-
2025-02-20status Pending 530-char remark
Show marketing remark (530 chars)
Don't miss out on this spacious Craftsman style home featuring modern open floor plan with spacious living area open to the kitchen and dining. 9 ft vaulted ceilings and door leading out to covered patio area great for entertaining. Home is energy efficient with 40 inches of TAP thermal acoustical attic insulation. Added convenience of a smart garage system, a Vivint security system adding both security and ease to your daily routine. Only 10 minutes from XNA airport and 20 min from Walmart home office. Fiber Optic Internet.
-
2025-02-07$319,900 Active 530-char remark
Show marketing remark (530 chars)
Don't miss out on this spacious Craftsman style home featuring modern open floor plan with spacious living area open to the kitchen and dining. 9 ft vaulted ceilings and door leading out to covered patio area great for entertaining. Home is energy efficient with 40 inches of TAP thermal acoustical attic insulation. Added convenience of a smart garage system, a Vivint security system adding both security and ease to your daily routine. Only 10 minutes from XNA airport and 20 min from Walmart home office. Fiber Optic Internet.
-
2018-03-29soldstatus $172,000
-
2018-01-22$172,000
ⓘ Source: listings_history table (triggers on properties + properties_extension) + one-shot
backfill from property_details.listing_events for pre-trigger history.
Tax reassessment forecast AR · Resets to sale price
- Current annual tax
- $1,875 · $156/mo
- Projected year-2 tax
- $1,875 · $156/mo
- Expected delta
- $0/yr ($0/mo · 0.0%)
ⓘ Screening estimate from a state-policy table — verify with the county assessor before closing.
Climate risk First Street
- Flood 1/10 Low FEMA zone X (unshaded) · 0% chance over 30 yrs
- Wildfire 4/10 Moderate
- Heat 5/10 Major 7 d/yr ≥106°F today · 20 d/yr by 30 yrs out
- Wind 2/10 Low 2% chance of damaging wind over 30 yrs
- Air quality 1/10 Low 0 unhealthy d/yr today · 0 by 30 yrs out
Nearby sold comps map
Loading sold comps map…
Walkable amenities ~0.75 mi
Loading nearby amenities…
Taxation est. · year 1
- Rental income
- $20,087
- − Mortgage interest
- −$16,245
- − Property taxes
- −$1,875
- − Insurance
- −$1,450
- − Repairs & maintenance
- −$1,607
- − Management
- −$1,607
- − Depreciation
- −$8,436
- Taxable loss
- −$11,133
- Est. tax savings @ 24.0%
- +$2,672
- After-tax cash flow
- $-3,034/yr
For passive investors: Depreciation is non-cash, so a rental often shows a tax loss while cash-flowing — sheltering income. Rental losses are passive: they offset passive income freely, and up to $25,000/yr can offset ordinary (W-2) income if you actively participate and your MAGI is under $100k (phasing out to $0 by $150k); unused losses carry forward. On sale, claimed depreciation is recaptured at up to 25%, and gains may owe capital-gains tax (a 1031 exchange can defer both). Figures are a year-1 estimate at your 24.0% rate — not tax advice; consult a CPA.
Schools (NCES district)
- District
- Bentonville School District
- NCES district ID
- 0503060
- Math proficiency
- 59% ▼ -8.00%
- Reading proficiency
- 59% ▼ -6.00%
- Median HH income
- $66,721
- Composite
- 51.85/100
- National rank
- #1661
- State rank
- #3 of 238 in AR
Livability — Highfill
- Score
- 67/100
- State rank
- #97
- US rank
- #10302
Category grades
Schools grade is shown separately in the Schools card above.
Census & demographics
- Census place
- Highfill, AR
- County
- Benton County · 259,241 people
- Metro
- Fayetteville-Springdale-Rogers, AR
- Population (ZIP)
- 28,999
- Household income
- $119,853
- Rent vs Own
- Severe rent burden
- 508.0
Population outlook (Benton County) Hauer SSP2
- Today (2025)
- 318,683 people
- By 2030
- 353,481 · +10.9%
- By 2040
- 425,280 · +33.4%
- By 2050
- 497,239 · +56.0%
- By 2075
- 662,114 · +107.8%
- By 2100
- 776,431 · +143.6%
Race, ethnicity, and origin ACS 2023
- Neighborhood character
- Diverse neighborhood (Simpson 0.66)
- Race & ethnicity
- White 54% Asian 20% Two or more races 16% Hispanic / Latino 11% Black 3%
- Hispanic origin (detail)
- Mexican 8%
- Common ancestry
- Italian 2% Slovak 2% Romanian 1%
- Foreign-born
- 22% · Canada, China, Vietnam
- Languages at home
- 79% English-only · Other Asian/Pacific 8% Spanish 6% Other Indo-European 5%
Political lean MEDSL · Benton
- 2024 margin
- Strong R (+27.0) · D 35.2% · R 62.1% · Other 2.7%
- 2008→2024 swing
- +9.6pp toward D · 2008: -36.5pp · 2024: -27.0pp
- All cycles
- 2024: R+27.0 2020: R+26.4 2016: R+34.9 2012: R+40.4 2008: R+36.5
Not yet ingested
- Civics
- —
Market trends
- HPI YoY
- ▲ 10.77%
- Current HPI
- 319.3081
- Rent YoY
- ▲ 0.39%
- Metro
- Fayetteville-Springdale-Rogers, AR
- State GDP YoY
- ▲ 3.80%
- F500 in state
- 10
Industry mix (Fortune 500 HQ in AR)
| Industry | F500 HQs | Revenue |
|---|---|---|
| Retail | 1 | $681B |
|
||
| Food / Agriculture | 1 | $53B |
|
||
| Retail / Energy | 1 | $22B |
|
||
| Transportation / Logistics | 1 | $12B |
|
||
| Energy | 1 | $4B |
|
||
Price history
+68.6% since first listed10 events — show timeline
- 2026-05-04 Price Changed $290,000 NWARMLS
- 2026-04-13 Price Changed $300,000 NWARMLS
- 2026-03-20 Listed $310,000 NWARMLS
- 2025-10-15 Price Changed $317,000 NWARMLS
- 2025-03-19 Sold (Public Records) $312,400 Public Records
- 2025-03-14 Sold (MLS) $312,400 NWARMLS
- 2025-02-20 Pending — NWARMLS
- 2025-02-07 Listed $319,900 NWARMLS
- 2018-03-29 Sold (MLS) $172,000 NWARMLS
- 2018-01-22 Listed $172,000 NWARMLS
Property tax history
+29.0%/yrLatest (2025): $1,875 · +2.3% YoY. Source: county tax records.
Cash-flow waterfall
monthlySold comps — $/sqft
last 12 mo · ≤1 miLoading sold comps…