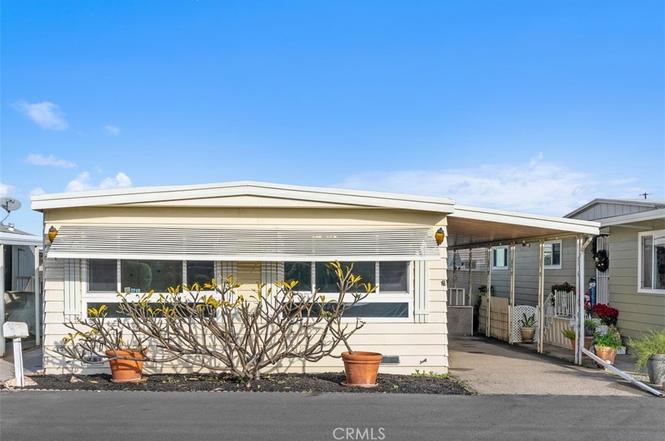
15621 Beach Blvd #103 · Huntington Beach, CA
Flood risk 1/10 · Minimal
- FEMA flood zone
- X
- Chance of flooding over 30 yrs
- 0.0%
- Est. flood insurance / yr
- $507 – $1,088
Fire risk 1/10 · Minimal
- Est. fire insurance / yr
- $659 – $1,223
Heat risk 5/10 · Moderate
- Hot days now (above 87°F)
- 7 days/yr
- Hot days in 30 yrs
- 22 days/yr
Wind risk 1/10 · Minimal
- Chance of severe wind over 30 yrs
- —
Air-quality risk 4/10 · Minor
- Unhealthy air days now
- 5 days/yr
- Unhealthy air days in 30 yrs
- 7 days/yr
Risk factors via First Street. Map © Google.
Why this score? — see what drove the B+ grade
The composite is a weighted blend of 9 inputs, each scored 0–100. Each bar is that input's sub-score; the figure is the points it added to the 100-point composite (weight × sub-score).
- Cash flow +30.0/30.0
- ARV discount +15.0/15.0
- 1% rule +10.0/10.0
- DSCR +10.0/10.0
- Schools +5.5/10.0
- Livability +3.4/5.0
- Rent growth +3.0/5.0
- Condition / age +2.5/5.0
- Appreciation +0.0/10.0
$139,999
🖨 Deal sheet 📄 Offer letter ✓ Due diligence
Listing remarks
Welcome to 15621 Beach Blvd #103, a spacious 2-bedroom, 2-bath remodeled home offering 1,368 square feet of comfortable living in Driftwood Mobile Home Park, a desirable 55+ community in the city of Westminster. The generous living and dining areas provide a welcoming flow for everyday living or entertaining, while the private primary suite includes an en-suite bath and plenty of room to unwind. A well-sized second bedroom and full guest bath offer flexibility for guests, a home office, or hobbies. Carport space for up to two cars, with two garden sheds providing plenty of storage. One of the biggest highlights is the prime location: enjoy easy access to nearby freeways, Bella Terra, shoppi
Key facts
- Garden sheds
- En-suite bath
- Prime location
Tags
Property features AI
Finance
- Other: Directions: Driving south on Beach Blvd, turn right onto Driftwood Ln. Pass the first stop sign; home is on the right, #103; Road frontage: private road (paved); Lot size source: assessor's data; Lot dimensions source: assessor
- Financial info: Land lease (monthly) — $1,750 (seller-provided amount)
- HOA & community: Senior community; Community amenities include pool and outdoor cooking area; Community features: curbs, dog park, street lighting, sidewalks, urban setting; Park name: Driftwood Mobile Home Park; Manager approval required; Pets allowed with breed restrictions
Exterior
- Parking: Paved parking; Carport (2 spaces); Guest parking; Deck parking access
- Security: Resident manager; Carbon monoxide detector(s); Smoke detector(s) and fire/smoke detection system
- Utilities: Standard electric service; Natural gas connected; Public/district water; Public sewer; Electricity connected; Water connected; Sewer connected
- Home design: Mobile home (double wide); Updated/remodeled condition; Single story; Entry level: 1; Faces southwest; Mobile width ~24 ft, length ~57 ft; Mobile home remains
- Construction: Metal roof; Hardboard and glass with drywall walls construction; Pier jacks foundation; Shed structures (2)
- Exterior features: Covered porch and deck; Patio; In-ground community pool; TV antenna; Two sheds; Landscaped lot; Rectangular lot shape; Close to clubhouse; No fencing
Interior
- Kitchen: Kitchen open to family room; Kitchen island; Pots & pan drawers; Laminate counters; Gas range; Gas oven; Range/stove hood; Recirculated exhaust fan
- Bedrooms: All bedrooms on main level; Primary suite
- Flooring: Vinyl flooring; Laminate flooring
- Bathrooms: 2 full bathrooms; Exhaust fan(s); Shower; Grab bars in bathroom(s)
- Heating & cooling: Forced air heating (natural gas); Central cooling
- Interior features: Ceiling fan; Open floor plan; Front entrance and side door; One-level home; Resident manager on site; Carbon monoxide and smoke detectors with fire/smoke detection system
- Laundry & utility: Laundry room inside; Washer hookup; Gas dryer hookup; Individual laundry room
Neighborhood map
What this means for you Summary
Snapshot
- This is a 2-bed/2.0-bath manufactured listed at $140k.
Deal economics
- At list price, monthly cash flow is $1k ($18k/yr) — positive.
- The deal already cash-flows at list — no discount required.
- Meets the 1% rule at list price ($3k rent vs $140k).
- Recommended offer: $123k (12.0% below list) — sets the bar for market timing.
- Cap rate 19.0% vs local median 1.6% in Huntington Beach — top-decile yield for the area; either an underpriced asset or a hidden risk that comps aren't pricing in. Stress-test before assuming the spread holds.
Location & tenants
- Location reads 67/100 on livability (#306 in CA) — a middle-class / working-renter tenant base. Strengths: employment A+, commute A-; Watch: amenities C-, cost of living F, health & safety F.
- Ocean View (suburban): math 57% / reading 63% proficiency, ranked #207 of 1,400 in CA (top 15%) — acceptable for families but not a draw, mixed tenant base, ~2y average lease.
- Zoned schools: Star View Elementary (388 students, 63% FRL); Vista View Middle (math 24% / reading 24%, grade F, #277 of 498 statewide, top 73%, 588 students, 78% FRL) — zoned schools average 70% FRL vs 34% district-wide (37 pts higher); higher-poverty schools than district average — tighter screening recommended.
- Zoned-school proficiency averages 24% at this address vs 60% district-wide (-36 pts) — the specific schools serving this property underperform the Ocean View average; the district grade overstates school quality for this exact location.
- Market conditions: Rents rising (+2.0%/yr); 87 active listings in the ZIP; 38 comparable units currently listed for rent nearby; rentals leasing fast (median 1d on market — plan ~1-2 weeks tenant-placement turnaround); solid renter incomes; 6,974 units permitted in Orange County in 2024 (3,839 in 5+ unit buildings).
- This rent runs 43% of the median local income ($86k/yr) — at the standard rent-burdened threshold; future hikes will face affordability resistance.
Forward outlook
- Local home prices are declining (-3.0%/yr); year-one equity from $968 of loan paydown is wiped out by about $4k of value loss. Plan a longer hold.
- Orange County population projected at +14% by 2050 — modest demand growth; plan on rents tracking national, not racing it.
- At projected returns (-3.0% appreciation + 2.0% rent growth), your $39k cash investment doubles in ~3 years — after that, you're playing with house money.
Negotiation context
- It's been on market 180 days — a 12% lower offer ($123k) is reasonable based on typical stale-listing flexibility.
Risks & watch-outs
- Climate carrying-cost: extreme-heat days projected 7→22/yr by 2055 (HVAC capex compounding) — expect insurance premiums to compound above CPI over the hold.
Questions for the listing agent
- It's been on market 180 days. Have you received any prior offers? Is the seller open to a 12% concession, seller financing, or rate buy-down credit?
- Built in 1970 — when were the roof, HVAC, electrical panel, plumbing, and water heater last replaced?
- Why hasn't it sold? Are there any deal-killer items the seller is aware of (foundation, flood, title, zoning, code violations)?
- Is there a deadline driving the sale (1031 exchange, divorce, estate, relocation)? That informs how much negotiation room exists.
- Schools are B-rated — typically a magnet for longer-tenancy family renters. What's the average tenant stay here, and is there a school-zone premium baked into asking?
- What's the average days-on-market for RENTAL listings here right now (not sales)? A rising rental-DOM trend means longer vacancies and softer asking-rent achievability than the comps imply.
- What's the recent tenant-quality profile in this submarket — average credit score on applications, eviction rate, late-payment / NSF rate, and stable-employment percentage? A property-management company in the area should have these aggregated.
- How much new for-sale + rental construction is in the pipeline within 1–3 miles? Heavy new supply typically softens prices + rents 12–24 months out; constrained supply supports both.
Investment metrics
- 1% rule
- 2.21% ✓
- Cap rate
- 18.96%
- Cash-on-cash
- 45.22%
- DSCR
- 3.01
- GRM
- 3.8
CMA / ARV
- ARV (on-the-fly)
- $172,368
- Comps found
- 9
Show comp detail 9 sales within ~0.75 mi
| Address | Dist | Beds/Ba | Sqft | Sold | Price | $/sf | Match |
|---|---|---|---|---|---|---|---|
| 15621 Beach Blvd. #10 | 0.00mi | 2/2.0 | 1,440 (+5%) | 7mo | $191,000 | $133 | 86 |
| 15621 Beach Blvd #30 #30 | 0.00mi | 2/5.0 | 1,344 (-2%) | 0mo | $165,000 | $123 | 85 |
| 15621 Beach Blvd #8 | 0.00mi | 3/2.0 (+1) | 1,310 (-4%) | 13mo | $250,000 | $191 | 77 |
| 15621 Beach Blvd #24 | 0.00mi | 3/2.0 (+1) | 1,248 (-9%) | 9mo | $157,000 | $126 | 73 |
| 15621 Beach Blvd #9 | 0.00mi | 2/2.0 | 1,458 (+7%) | 20mo | $164,000 | $112 | 72 |
| 15621 Beach Blvd #158 | 0.00mi | 2/2.0 | 1,248 (-9%) | 17mo | $95,000 | $76 | 72 |
| 15621 Beach Blvd #75 | 0.00mi | 2/2.0 | 1,440 (+5%) | 24mo | $150,000 | $104 | 71 |
| 15621 BEACH Blvd #153 | 0.00mi | 3/2.0 (+1) | 1,316 (-4%) | 23mo | $240,000 | $182 | 69 |
| 15621 Beach Blvd #113 | 0.00mi | 2/2.0 | 1,224 (-10%) | 20mo | $290,000 | $237 | 66 |
Match score weights: distance 35% · size 25% · config 20% · recency 20%. Top-matched comps best support the ARV.
Projected returns pro-forma
-3.0% appreciation · 2.01% rent growth · sell at horizon
- IRR
- 41.2%
- Equity multiple
- 2.74×
- Total profit
- $68,400
- Equity at exit
- $20,874
- IRR
- 47.0%
- Equity multiple
- 5.30×
- Total profit
- $168,630
- Equity at exit
- $12,105
Cash invested: $39,200 (down + closing). Projections, not guarantees.
Landlord ↔ Tenant lean methodology
- Overall (STATE)
- 18 Strongly Tenant-Friendly
- State California
- 18 Strongly Tenant-Friendly · D+13
- County
- — inherits STATE
- City
- — inherits STATE
ZIP-level market 92683
- Rents YoY
- 2.0%
- Active inventory
- 87
- Price-to-rent
- 3.8×
Monthly cashflow live
- Estimated rent
- $3,095 high interval (Pro) →
- Mortgage (P&I)
- −$734
- Tax est. 1.5%
- −$175 /mo · $2,100/yr
- Insurance
- −$58
- HOA
- −$0
- Vacancy / Maint / Mgmt
- −$650
- Net cashflow
- $1,477
Break-even live
UW: 25.0% down · 7.5% · 30yr · 1.5% tax · 5.0% vac · 8.0% maint · 8.0% mgmt
Financing live
Cash to close
- Down payment
- $35,000
- Closing costs
- $4,200
- Reserves months
- —
- Total cash needed
- —
Loan-product check · same deal, 3 products live
Conventional
25% down · 7.5% · 30yr
- Down + closing
- —
- Monthly P&I
- —
- Monthly cashflow
- —
- DSCR
- —
- Eligible?
- —
Personal DTI + credit; lowest rate.
DSCR
20% down · 8.5% · 30yr
- Down + closing
- —
- Monthly P&I
- —
- Monthly cashflow
- —
- DSCR
- —
- Eligible?
- —
No personal income docs; deal must DSCR.
Hard money
10% down · 12.0% · 12mo
- Down + closing
- —
- Monthly P&I
- —
- Monthly cashflow
- —
- DSCR
- —
- Eligible?
- —
Short-term bridge; refi at stabilization.
Rent comps 38 comps
| Address | Beds | Baths | Sqft | Rent | $/sqft | DOM | Units | Dist |
|---|---|---|---|---|---|---|---|---|
| 8041 Worthy Dr Westminster, CA | 2.0 | 1.0 | 900 | $2,700 | $3.00 | 1d | 1 | 0.35mi |
| 7400 Center Ave Huntington Beach, CA | 2.0 | 1.0–2.0 | 990 | $4,119 | $4.16 | 1d | 1 | 0.41mi |
| 7521 Edinger Ave Huntington Beach, CA | 3.0 | 1.0–2.0 | 1035 | $3,703 | $3.58 | 1d | 23 | 0.44mi |
| 7461 Edinger Ave Huntington Beach, CA | 2.0 | 1.0–2.0 | 1031 | $4,325 | $4.19 | 1d | 26 | 0.51mi |
| 7267 Aura Cir Huntington Beach, CA | 3.0 | 2.5 | 1389 | $4,500 | $3.24 | 1d | 1 | 0.61mi |
| 16162 Sher Ln Huntington Beach, CA | 1.0–3.0 | 1.0–1.5 | 1090 | $2,522 | $2.31 | 1d | 9 | 0.63mi |
| 7601 Amazon Dr Unit 2 Huntington Beach, CA | 2.0 | 2.0 | 1000 | $2,650 | $2.65 | 1d | 1 | 0.68mi |
| 7942 Stark Dr Huntington Beach, CA | 2.0 | 2.0 | 1000 | $2,495 | $2.50 | 15d | 1 | 0.70mi |
| 7672 Amazon Dr Unit 3 Huntington Beach, CA | 2.0 | 2.5 | 1400 | $2,975 | $2.12 | 10d | 1 | 0.70mi |
| 7290 Edinger Ave Huntington Beach, CA | 1.0–2.0 | 1.0–2.0 | 941 | $3,824 | $4.06 | 1d | 19 | 0.71mi |
| 16121 Malaga Ln Unit D Huntington Beach, CA | 2.0 | 2.0 | 1000 | $2,800 | $2.80 | 1d | 1 | 0.73mi |
| 15596 Dawson Ln Huntington Beach, CA | 3.0 | 2.0 | 1000 | $3,600 | $3.60 | 1d | 1 | 0.86mi |
| 8400 Edinger Ave Huntington Beach, CA | 2.0 | 1.0–2.0 | 778 | $3,007 | $3.87 | 1d | 13 | 0.90mi |
| 7912 Glencoe Dr Huntington Beach, CA | 3.0 | 1.0 | 1100 | $3,900 | $3.55 | 1d | 1 | 0.91mi |
| 7082 Heil Ave #1 Huntington Beach, CA | 3.0 | 2.0 | 1438 | $3,500 | $2.43 | 1d | 1 | 1.19mi |
| 14332 Joyce Ave Westminster, CA | 3.0 | 2.0 | 1100 | $3,890 | $3.54 | 1d | 1 | 1.20mi |
| 16531 Kellog Cir Unit 1 Huntington Beach, CA | 3.0 | 2.0 | 1422 | $3,650 | $2.57 | 1d | 1 | 1.20mi |
| 14322 Joyce Ave Westminster, CA | 3.0 | 2.0 | 1200 | $4,190 | $3.49 | 5d | 1 | 1.20mi |
| 7921 Moonshadow Cir Unit 4 Huntington Beach, CA | 2.0 | 1.0 | 950 | $2,545 | $2.68 | 1d | 1 | 1.26mi |
| 16612 Bartlett Ln Unit 4 Huntington Beach, CA | 2.0 | 1.0 | 1000 | $2,600 | $2.60 | 19d | 1 | 1.27mi |
| 14452 Goldenwest St Westminster, CA | 2.0 | 1.5 | 1300 | $3,098 | $2.38 | 1d | 1 | 1.30mi |
| 7261 La Mancha Cir Unit C Huntington Beach, CA | 2.0 | 2.0 | 921 | $2,500 | $2.71 | 22d | 1 | 1.31mi |
| 16761 Viewpoint Ln Huntington Beach, CA | 2.0 | 1.5–2.0 | 938 | $2,863 | $3.05 | 1d | 15 | 1.32mi |
| 16781 Bardon Ln Unit A Huntington Beach, CA | 3.0 | 2.0 | 1300 | $3,195 | $2.46 | 7d | 1 | 1.33mi |
| 16652 Goldenwest St Apt 3 Huntington Beach, CA | 2.0 | 1.5 | 1200 | $2,600 | $2.17 | 1d | 1 | 1.34mi |
| 16652 Goldenwest St Huntington Beach, CA | 2.0 | 1.5 | 1200 | $2,600 | $2.17 | 10d | 1 | 1.34mi |
| 7643 14th St Westminster, CA | 2.0 | 2.0 | 1002 | $3,250 | $3.24 | 1d | 1 | 1.36mi |
| 16682 Goldenwest St Unit 2 Huntington Beach, CA | 2.0 | 2.0 | 900 | $2,800 | $3.11 | 1d | 1 | 1.36mi |
| 7861 14th St Unit C Westminster, CA | 2.0 | 2.0 | 925 | $2,800 | $3.03 | 1d | 1 | 1.37mi |
| 7861 14th St Westminster, CA | 2.0 | 2.0 | 1025 | $2,700 | $2.63 | 2d | 1 | 1.37mi |
| 7792 15th St Westminster, CA | 1.0 | 1.0 | 950 | $2,400 | $2.53 | 3d | 1 | 1.38mi |
| 16722 Goldenwest St #1 Huntington Beach, CA | 3.0 | 2.0 | 1250 | $3,650 | $2.92 | 1d | 1 | 1.40mi |
| 7012 Main St Westminster, CA | 1.0–2.0 | 1.0 | 812 | $2,395 | $2.95 | 11d | 5 | 1.43mi |
| 7012 Main St Unit 7042-11 Westminster, CA | 2.0 | 1.0 | 900 | $2,395 | $2.66 | 1d | 1 | 1.44mi |
| 7012 Main St Unit 7022-16 Westminster, CA | 2.0 | 1.0 | 900 | $2,395 | $2.66 | 7d | 1 | 1.44mi |
| 7012 Main St Unit 7042-06 Westminster, CA | 2.0 | 1.0 | 900 | $2,395 | $2.66 | 17d | 1 | 1.44mi |
| 7581 Warner Ave Unit B Huntington Beach, CA | 3.0 | 2.0 | 1305 | $3,400 | $2.61 | 1d | 1 | 1.46mi |
| 7661 Baylor Dr Westminster, CA | 1.0–2.0 | 1.0 | 787 | $2,400 | $3.05 | 1d | 2 | 1.46mi |
Listing history 20 events
-
2026-06-18days on market $139,999 Active 180 DOM
-
2026-06-17days on market $139,999 Active 179 DOM
-
2026-06-16days on market $139,999 Active 178 DOM
-
2026-06-15days on market $139,999 Active 177 DOM
-
2026-06-13days on market $139,999 Active 175 DOM
-
2026-06-13days on market $139,999 Active 174 DOM
-
2026-06-10days on market $139,999 Active 172 DOM
-
2026-06-09days on market $139,999 Active 171 DOM
-
2026-06-08days on market $139,999 Active 170 DOM
-
2026-06-07days on market $139,999 Active 169 DOM
-
2026-06-04days on market $139,999 Active 166 DOM
-
2026-06-03days on market $139,999 Active 165 DOM
-
2026-06-02days on market $139,999 Active 164 DOM
-
2026-06-01days on market $139,999 Active 163 DOM
-
2026-05-31days on market $139,999 Active 162 DOM
-
2026-05-05price $139,999
-
2026-04-17price $157,000
-
2026-03-04price $159,000
-
2026-01-10price $179,999
-
2025-12-19$199,999 Active
ⓘ Source: listings_history table (triggers on properties + properties_extension) + one-shot
backfill from property_details.listing_events for pre-trigger history.
Climate risk First Street
- Flood 1/10 Low FEMA zone X · 0% chance over 30 yrs
- Wildfire 1/10 Low
- Heat 5/10 Major 7 d/yr ≥87°F today · 22 d/yr by 30 yrs out
- Wind 1/10 Low
- Air quality 4/10 Moderate 5 unhealthy d/yr today · 7 by 30 yrs out
Nearby sold comps map
Loading sold comps map…
Walkable amenities ~0.75 mi
Loading nearby amenities…
Taxation est. · year 1
- Rental income
- $37,137
- − Mortgage interest
- −$7,842
- − Property taxes
- −$2,100
- − Insurance
- −$700
- − Repairs & maintenance
- −$2,971
- − Management
- −$2,971
- − Depreciation
- −$4,073
- Taxable income
- $16,480
- Est. tax owed @ 24.0%
- −$3,955
- After-tax cash flow
- $13,773/yr
For passive investors: Depreciation is non-cash, so a rental often shows a tax loss while cash-flowing — sheltering income. Rental losses are passive: they offset passive income freely, and up to $25,000/yr can offset ordinary (W-2) income if you actively participate and your MAGI is under $100k (phasing out to $0 by $150k); unused losses carry forward. On sale, claimed depreciation is recaptured at up to 25%, and gains may owe capital-gains tax (a 1031 exchange can defer both). Figures are a year-1 estimate at your 24.0% rate — not tax advice; consult a CPA.
Schools (NCES district)
- District
- Ocean View
- NCES district ID
- 0628140
- Math proficiency
- 57% ▬ 0.00%
- Reading proficiency
- 63% ▼ -1.00%
- Median HH income
- $77,469
- Composite
- 55.3/100
- National rank
- #2725
- State rank
- #207 of 1400 in CA
Livability — Huntington Beach
- Score
- 67/100
- State rank
- #306
- US rank
- #10298
Category grades
Schools grade is shown separately in the Schools card above.
Census & demographics
- Census place
- Huntington Beach, CA
- County
- Orange County · 3,096,323 people
- City population
- 194,835
- Metro
- Los Angeles-Long Beach-Anaheim, CA
- Population (ZIP)
- 89,833
- Household income
- $85,585
- Rent vs Own
- Severe rent burden
- 4639.0
Population outlook (Orange County) Hauer SSP2
- Today (2025)
- 3,477,456 people
- By 2030
- 3,613,117 · +3.9%
- By 2040
- 3,835,945 · +10.3%
- By 2050
- 3,968,736 · +14.1%
- By 2075
- 4,097,053 · +17.8%
- By 2100
- 3,903,633 · +12.3%
Race, ethnicity, and origin ACS 2023
- Neighborhood character
- Diverse neighborhood (Simpson 0.64)
- Race & ethnicity
- Asian 51% Hispanic / Latino 24% White 20% Two or more races 9%
- Hispanic origin (detail)
- Mexican 20%
- Common ancestry
- Slovak 1% Portuguese 1% Lithuanian 1%
- Foreign-born
- 46% · Vietnam, Canada, China
- Languages at home
- 35% English-only · Vietnamese 40% Spanish 18% Chinese 2%
Political lean MEDSL · Orange
- 2024 margin
- Toss-up / Even · D 49.7% · R 47.1% · Other 3.2%
- 2008→2024 swing
- +5.2pp toward D · 2008: -2.6pp · 2024: 2.6pp
- All cycles
- 2024: D+2.6 2020: D+9.0 2016: D+7.7 2012: R+8.3 2008: R+2.6
Not yet ingested
- Civics
- —
Market trends
- HPI YoY
- ▼ -917.95%
- Current HPI
- 410.3463
- Rent YoY
- ▲ 2.01%
- Metro
- Los Angeles-Long Beach-Anaheim, CA
- State GDP YoY
- ▲ 3.21%
- F500 in state
- 116
Industry mix (Fortune 500 HQ in CA)
| Industry | F500 HQs | Revenue |
|---|---|---|
| Technology | 27 | $1,492B |
|
||
| Financial Services | 3 | $174B |
|
||
| Retail | 3 | $44B |
|
||
| Insurance | 3 | $26B |
|
||
| Media / Entertainment | 2 | $115B |
|
||
| Pharmaceuticals / Biotech | 2 | $62B |
|
||
Price history
-30.0% since first listed5 events — show timeline
- 2026-05-05 Price Changed $139,999 CRMLS
- 2026-04-17 Price Changed $157,000 CRMLS
- 2026-03-04 Price Changed $159,000 CRMLS
- 2026-01-10 Price Changed $179,999 CRMLS
- 2025-12-19 Listed $199,999 CRMLS
Cash-flow waterfall
monthlySold comps — $/sqft
last 12 mo · ≤1 miLoading sold comps…