31 Rivermead · East Hartford, CT
Flood risk No data
- FEMA flood zone
- —
- Chance of flooding over 30 yrs
- —
- Est. flood insurance / yr
- —
Fire risk No data
- Est. fire insurance / yr
- —
Heat risk No data
- Hot days now (above threshold)
- —
- Hot days in 30 yrs
- —
Wind risk No data
- Chance of severe wind over 30 yrs
- —
Air-quality risk No data
- Unhealthy air days now
- —
- Unhealthy air days in 30 yrs
- —
Risk factors via First Street. Map © Google.
Why this score? — see what drove the C- grade
The composite is a weighted blend of 9 inputs, each scored 0–100. Each bar is that input's sub-score; the figure is the points it added to the 100-point composite (weight × sub-score).
- Cash flow +15.0/30.0
- ARV discount +15.0/15.0
- 1% rule +5.0/10.0
- DSCR +5.0/10.0
- Livability +3.7/5.0
- Rent growth +2.5/5.0
- Condition / age +2.5/5.0
- Schools +2.1/10.0
- Appreciation +0.0/10.0
$35,000
🖨 Deal sheet 📄 Offer letter ✓ Due diligence
Listing remarks MLS
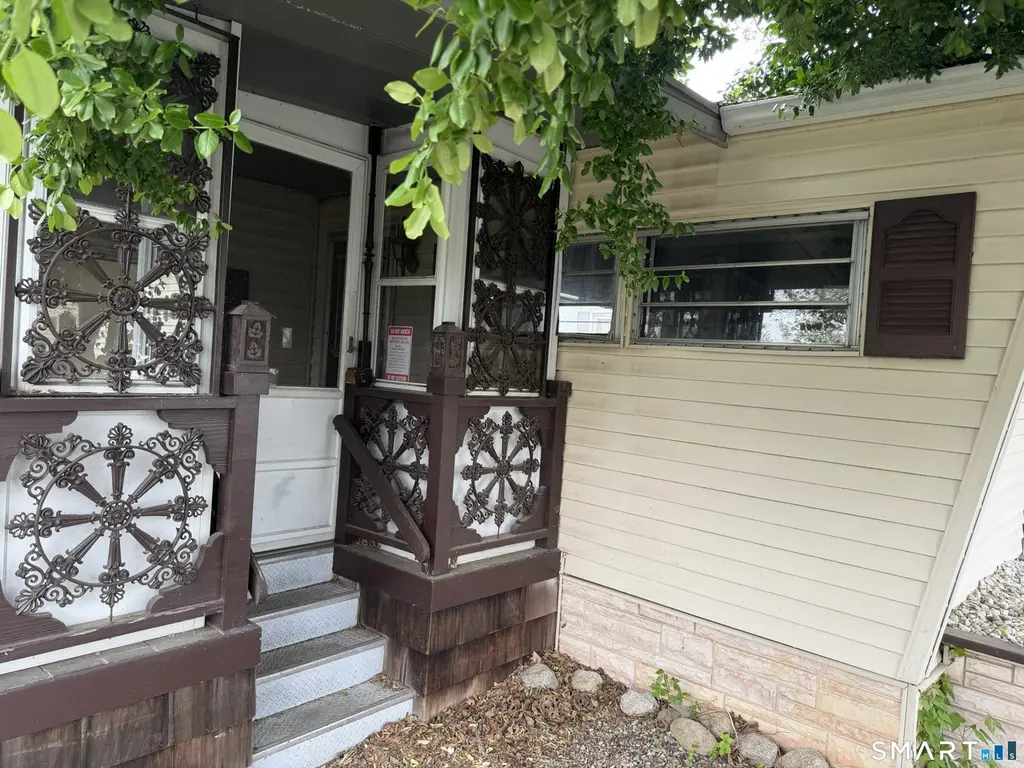
Investor's quick win in East Hartford! With a renovation, this 2-bed, 1-bath mobile home offers strong upside and easy one-level living. The layout is efficient and functional, perfect for an owner-occupant. Enjoy added privacy with a backyard that backs to the woods. Located in the well-maintained Rivermead Pointe community-known for its convenient location and neighborhood feel, Rivermead Pointe awaits. Well-manicured grounds, a club house, and on site laundry facilities are just some of the perks. Plus, pets are welcome!!! Affordable entry point with great potential to add value quickly. Throw that tool belt on, and let's get to growing!
Key facts
- One level living
- Pets are welcome
- 2 parking spots
Tags
Property features AI
Finance
- Other: Listing status: Active
- Financial info: Annual tax amount $770 (2025)
- HOA & community: Homeowners association membership required; Association fee $776
Exterior
- Parking: 2 open parking spaces
- Utilities: Public water; Public sewer
- Home design: Mobile home; Above-grade finished living area approximately 676
- Construction: Built circa (approximate) per public records
- Exterior features: Cleared, level lot
Interior
- Bedrooms: Master bedroom on the first floor; Second bedroom on the first floor
- Bathrooms: 1 full bathroom on the first floor
- Heating & cooling: Natural gas heating
- Interior features: Total of 5 rooms
Neighborhood map
What this means for you Summary
Snapshot
- This is a 2-bed/1.0-bath manufactured listed at $35k.
Deal economics
- At list price, monthly cash flow is $277 ($3k/yr) — positive.
- The deal already cash-flows at list — no discount required.
- Meets the 1% rule at list price ($2k rent vs $35k).
- Cap rate 15.8% vs local median 4.2% in East Hartford — top-decile yield for the area; either an underpriced asset or a hidden risk that comps aren't pricing in. Stress-test before assuming the spread holds.
Location & tenants
- Location reads 73/100 on livability (#76 in CT) — a middle-class / working-renter tenant base. Strengths: housing A+, crime A, commute A-; Watch: schools D+, amenities F, health & safety F.
- East Hartford School District (urban): math 17% / reading 30% proficiency, ranked #140 of 153 in CT (top 92%) — low school quality limits family demand, transient renter base, plan for 1-2y turnover.
- Market conditions: 100 active listings in the ZIP; 1 comparable units currently listed for rent nearby; solid renter incomes; 1,867 units permitted in Capitol Planning Region in 2024 (1,399 in 5+ unit buildings).
Forward outlook
- Local home prices are declining (-3.0%/yr); year-one equity from $242 of loan paydown is wiped out by about $1k of value loss. Plan a longer hold.
- At projected returns (-3.0% appreciation + 3.0% rent growth), your $10k cash investment doubles in ~4 years — after that, you're playing with house money.
Negotiation context
- Only 4 days on market — expect competitive offers; lowballing is unlikely to land.
- 2 sale attempts with the ask held roughly flat each time — persistent listings suggest the price (not the market) is what's stuck; bring a comps-based counter.
Risks & watch-outs
- Watch-outs: HOA is 47% of rent.
Questions for the listing agent
- Built in 1962 — when were the roof, HVAC, electrical panel, plumbing, and water heater last replaced?
- What does the HOA fee cover, when was the last increase, and are there any pending special assessments or reserve-fund shortfalls?
- Is there a deadline driving the sale (1031 exchange, divorce, estate, relocation)? That informs how much negotiation room exists.
- Schools are D-rated, which usually means shorter tenancies and higher turnover. Who's the typical renter profile here, and what's been the actual vacancy rate?
- What's the average days-on-market for RENTAL listings here right now (not sales)? A rising rental-DOM trend means longer vacancies and softer asking-rent achievability than the comps imply.
- What's the recent tenant-quality profile in this submarket — average credit score on applications, eviction rate, late-payment / NSF rate, and stable-employment percentage? A property-management company in the area should have these aggregated.
- How much new for-sale + rental construction is in the pipeline within 1–3 miles? Heavy new supply typically softens prices + rents 12–24 months out; constrained supply supports both.
Investment metrics
- 1% rule
- 4.76% ✓
- Cap rate
- 15.79%
- Cash-on-cash
- 33.91%
- DSCR
- 2.51
- GRM
- 1.8
CMA / ARV
- ARV (median comp)
- $49,455
- List price
- $35,000
- Delta
- -19.12%
- Verdict
- UNDERPRICED
- Comps
- 20 within 1.0 mi
Projected returns pro-forma
-3.0% appreciation · 3.0% rent growth · sell at horizon
- IRR
- 30.1%
- Equity multiple
- 2.27×
- Total profit
- $12,480
- Equity at exit
- $5,219
- IRR
- 37.8%
- Equity multiple
- 4.64×
- Total profit
- $35,668
- Equity at exit
- $3,026
Cash invested: $9,800 (down + closing). Projections, not guarantees.
Landlord ↔ Tenant lean methodology
- Overall (STATE)
- 27 Tenant-Leaning
- State Connecticut
- 27 Tenant-Leaning · D+7
- County
- — inherits STATE
- City
- — inherits STATE
ZIP-level market 06118
- Home prices YoY
- -33.7%
- Active inventory
- 100
- Price-to-rent
- 1.8×
Monthly cashflow live
- Estimated rent
- $1,665 medium interval (Pro) →
- Mortgage (P&I)
- −$184
- Tax from tax record
- −$64 /mo · $770/yr
- Insurance
- −$15
- HOA
- −$776
- Vacancy / Maint / Mgmt
- −$350
- Net cashflow
- $277
Break-even live
UW: 25.0% down · 7.5% · 30yr · 1.5% tax · 5.0% vac · 8.0% maint · 8.0% mgmt
Financing live
Cash to close
- Down payment
- $8,750
- Closing costs
- $1,050
- Reserves months
- —
- Total cash needed
- —
Loan-product check · same deal, 3 products live
Conventional
25% down · 7.5% · 30yr
- Down + closing
- —
- Monthly P&I
- —
- Monthly cashflow
- —
- DSCR
- —
- Eligible?
- —
Personal DTI + credit; lowest rate.
DSCR
20% down · 8.5% · 30yr
- Down + closing
- —
- Monthly P&I
- —
- Monthly cashflow
- —
- DSCR
- —
- Eligible?
- —
No personal income docs; deal must DSCR.
Hard money
10% down · 12.0% · 12mo
- Down + closing
- —
- Monthly P&I
- —
- Monthly cashflow
- —
- DSCR
- —
- Eligible?
- —
Short-term bridge; refi at stabilization.
Rent comps 1 comps
| Address | Beds | Baths | Sqft | Rent | $/sqft | DOM | Units | Dist |
|---|---|---|---|---|---|---|---|---|
| 49 Brewster Rd Unit C Glastonbury, CT | 1.0 | 1.0 | 670 | $1,600 | $2.39 | 3d | 1 | 1.30mi |
HOA detail
- Monthly dues
- $776 · $9,312/yr
- Likely covers
- landscaping
Listing history 15 events
-
2026-06-18statusdays on market $35,000 Active 4 DOM
-
2026-06-17days on market $35,000 New 3 DOM
-
2026-06-16days on market $35,000 New 2 DOM
-
2026-06-15statusdays on market $35,000 New 1 DOM
-
2026-06-13days on market $35,000 Active 37 DOM
-
2026-06-10days on market $35,000 Active 34 DOM
-
2026-06-09days on market $35,000 Active 33 DOM
-
2026-06-08days on market $35,000 Active 32 DOM
-
2026-06-07days on market $35,000 Active 31 DOM
-
2026-06-05days on market $35,000 Active 28 DOM
-
2026-06-03days on market $35,000 Active 27 DOM
-
2026-06-02days on market $35,000 Active 26 DOM
-
2026-06-01days on market $35,000 Active 25 DOM
-
2026-05-31days on market $35,000 Active 24 DOM
-
2026-05-07$40,000 Active 648-char remark
Show marketing remark (648 chars)
Investor's quick win in East Hartford! With a renovation, this 2-bed, 1-bath mobile home offers strong upside and easy one-level living. The layout is efficient and functional, perfect for an owner-occupant. Enjoy added privacy with a backyard that backs to the woods. Located in the well-maintained Rivermead Pointe community-known for its convenient location and neighborhood feel, Rivermead Pointe awaits. Well-manicured grounds, a club house, and on site laundry facilities are just some of the perks. Plus, pets are welcome!!! Affordable entry point with great potential to add value quickly. Throw that tool belt on, and let's get to growing!
ⓘ Source: listings_history table (triggers on properties + properties_extension) + one-shot
backfill from property_details.listing_events for pre-trigger history.
Tax reassessment forecast CT · Partial reset (capped growth)
- Current annual tax
- $770 · $64/mo
- Projected year-2 tax
- $770 · $64/mo
- Expected delta
- $0/yr ($0/mo · 0.0%)
ⓘ Screening estimate from a state-policy table — verify with the county assessor before closing.
Nearby sold comps map
Loading sold comps map…
Walkable amenities ~0.75 mi
Loading nearby amenities…
Taxation est. · year 1
- Rental income
- $19,978
- − Mortgage interest
- −$1,961
- − Property taxes
- −$770
- − Insurance
- −$175
- − Repairs & maintenance
- −$1,598
- − Management
- −$1,598
- − HOA
- −$9,312
- − Depreciation
- −$1,018
- Taxable income
- $3,546
- Est. tax owed @ 24.0%
- −$851
- After-tax cash flow
- $2,472/yr
For passive investors: Depreciation is non-cash, so a rental often shows a tax loss while cash-flowing — sheltering income. Rental losses are passive: they offset passive income freely, and up to $25,000/yr can offset ordinary (W-2) income if you actively participate and your MAGI is under $100k (phasing out to $0 by $150k); unused losses carry forward. On sale, claimed depreciation is recaptured at up to 25%, and gains may owe capital-gains tax (a 1031 exchange can defer both). Figures are a year-1 estimate at your 24.0% rate — not tax advice; consult a CPA.
Schools (NCES district)
- District
- East Hartford School District
- NCES district ID
- 0901260
- Math proficiency
- 17% ▼ -5.00%
- Reading proficiency
- 30% ▼ -7.00%
- Median HH income
- $49,691
- Composite
- 20.74/100
- National rank
- #8519
- State rank
- #140 of 153 in CT
Livability — East Hartford
- Score
- 73/100
- State rank
- #76
- US rank
- #5527
Category grades
Schools grade is shown separately in the Schools card above.
Census & demographics
- Census place
- East Hartford, CT
- County
- Hartford County · 754,208 people
- City population
- 50,918
- Metro
- Hartford-East Hartford-Middletown, CT
- Population (ZIP)
- 27,419
- Household income
- $79,740
- Rent vs Own
- Severe rent burden
- 820.0
Population outlook (Capitol County) Hauer SSP2
- By 2040
- 1,063,519
Race, ethnicity, and origin ACS 2023
- Neighborhood character
- Diverse neighborhood (Simpson 0.69)
- Race & ethnicity
- White 40% Hispanic / Latino 33% Black 20% Two or more races 14% Asian 4%
- Hispanic origin (detail)
- Puerto Rican 22% Dominican 3%
- Common ancestry
- Romanian 4% Lithuanian 4% Scotch-Irish 2%
- Foreign-born
- 17% · Canada, Vietnam, Jamaica
- Languages at home
- 65% English-only · Spanish 23% Other Indo-European 3% Russian/Polish/Slavic 2%
Political lean MEDSL · Capitol
- 2024 margin
- Strong D (+21.9) · D 60.1% · R 38.2% · Other 1.7%
- All cycles
- 2024: D+21.9
Not yet ingested
- Civics
- —
Market trends
- HPI YoY
- ▼ -127.16%
- Current HPI
- 250.5647
- Rent YoY
- —
- Metro
- Hartford-East Hartford-Middletown, CT
- State GDP YoY
- ▲ 1.06%
- F500 in state
- 38
Industry mix (Fortune 500 HQ in CT)
| Industry | F500 HQs | Revenue |
|---|---|---|
| Industrial Machinery | 4 | $38B |
|
||
| Insurance | 3 | $71B |
|
||
| Financial Services | 2 | $25B |
|
||
| Transportation / Logistics | 2 | $18B |
|
||
| Healthcare | 1 | $247B |
|
||
| Telecommunications | 1 | $55B |
|
||
Price history
-12.5% since first listed3 events — show timeline
- 2026-06-14 Listed $35,000 MLS PIN
- 2026-05-29 Price Changed $35,000 Smart MLS
- 2026-05-07 Listed $40,000 Smart MLS
Property tax history
+0.8%/yrLatest (2025): $770 · +4.3% YoY. Source: county tax records.
Cash-flow waterfall
monthlySold comps — $/sqft
last 12 mo · ≤1 miLoading sold comps…