915 Branch St · Saxton, PA
Flood risk 1/10 · Minimal
- FEMA flood zone
- X (unshaded)
- Chance of flooding over 30 yrs
- 0.0%
- Est. flood insurance / yr
- $507 – $1,088
Fire risk 3/10 · Minor
- Est. fire insurance / yr
- $511 – $949
Heat risk 4/10 · Minor
- Hot days now (above 94°F)
- 8 days/yr
- Hot days in 30 yrs
- 18 days/yr
Wind risk 2/10 · Minimal
- Chance of severe wind over 30 yrs
- —
Air-quality risk 2/10 · Minimal
- Unhealthy air days now
- 1 days/yr
- Unhealthy air days in 30 yrs
- 2 days/yr
Risk factors via First Street. Map © Google.
Why this score? — see what drove the C grade
The composite is a weighted blend of 9 inputs, each scored 0–100. Each bar is that input's sub-score; the figure is the points it added to the 100-point composite (weight × sub-score).
- Cash flow +20.1/30.0
- ARV discount +7.5/15.0
- DSCR +6.4/10.0
- Appreciation +6.4/10.0
- 1% rule +5.3/10.0
- Livability +3.4/5.0
- Schools +3.0/10.0
- Rent growth +2.5/5.0
- Condition / age +2.0/5.0
$92,500
🖨 Deal sheet 📄 Offer letter ✓ Due diligence
Listing remarks
3 bedroom, 1 bath, living room, kitchen with dining area, porch, private driveway, 1 lot, central air, heat pump, small shed on property, all appliances included. No owner financing. Disabled access. Must schedule appointment to see.
Key facts
- Private driveway
- Heat pump
- Central air
Tags
Neighborhood map
What this means for you Summary
Snapshot
- This is a 3-bed/1.0-bath other listed at $92k. Condition is rated fair.
Deal economics
- At list price, monthly cash flow is $115 ($1k/yr) — positive.
- The deal already cash-flows at list — no discount required.
- Meets the 1% rule at list price ($955 rent vs $92k).
Location & tenants
- Location reads 68/100 on livability (#867 in PA) — a middle-class / working-renter tenant base. Strengths: crime A+, cost of living A+, housing A+; Watch: schools C-, amenities F, commute F.
- Tussey Mountain SD (rural): math 26% / reading 46% proficiency, ranked #412 of 539 in PA (top 76%) — families likely to look elsewhere, expect single-tenant / working-renter base with shorter leases.
- Market conditions: 22 active listings in the ZIP; 54 units permitted in Bedford County in 2024 (0 in 5+ unit buildings).
Forward outlook
- In year one you build about $3k of equity ($640 loan paydown + $3k appreciation (2.7% local appreciation)).
- Bedford County population projected at -25% by 2050 — secular population decline; favor cash flow + early exit over multi-decade hold.
- At projected returns (2.7% appreciation + 3.0% rent growth), your $26k cash investment doubles in ~5 years — after that, you're playing with house money.
- By year 10, paydown + projected appreciation supports a ~$30k cash-out refi (75% LTV) — recoverable capital for the next deal without selling this one.
Negotiation context
- Only 9 days on market — expect competitive offers; lowballing is unlikely to land.
Questions for the listing agent
- Have any recent inspections been done? Can we get a copy of the seller's disclosures and any deferred-maintenance estimates?
- Built in 1976 — when were the roof, HVAC, electrical panel, plumbing, and water heater last replaced?
- Is there a deadline driving the sale (1031 exchange, divorce, estate, relocation)? That informs how much negotiation room exists.
- What's the average days-on-market for RENTAL listings here right now (not sales)? A rising rental-DOM trend means longer vacancies and softer asking-rent achievability than the comps imply.
- What's the recent tenant-quality profile in this submarket — average credit score on applications, eviction rate, late-payment / NSF rate, and stable-employment percentage? A property-management company in the area should have these aggregated.
- How much new for-sale + rental construction is in the pipeline within 1–3 miles? Heavy new supply typically softens prices + rents 12–24 months out; constrained supply supports both.
Investment metrics
- 1% rule
- 1.03% ✓
- Cap rate
- 7.78%
- Cash-on-cash
- 5.33%
- DSCR
- 1.24
- GRM
- 8.1
CMA / ARV
No comps found within radius.
Projected returns pro-forma
2.71% appreciation · 3.0% rent growth · sell at horizon
- IRR
- 11.7%
- Equity multiple
- 1.66×
- Total profit
- $17,089
- Equity at exit
- $40,115
- IRR
- 14.0%
- Equity multiple
- 3.02×
- Total profit
- $52,357
- Equity at exit
- $60,698
Cash invested: $25,900 (down + closing). Projections, not guarantees.
Landlord ↔ Tenant lean methodology
- Overall (STATE)
- 62 Landlord-Friendly
- State Pennsylvania
- 62 Landlord-Friendly · EVEN
- County
- — inherits STATE
- City
- — inherits STATE
ZIP-level market 16678
- Home prices YoY
- 1.8%
- Active inventory
- 22
- Price-to-rent
- 8.1×
Monthly cashflow live
- Estimated rent
- $955 medium interval (Pro) →
- Mortgage (P&I)
- −$485
- Tax est. 1.5%
- −$116 /mo · $1,388/yr
- Insurance
- −$39
- HOA
- −$0
- Vacancy / Maint / Mgmt
- −$200
- Net cashflow
- $115
Break-even live
UW: 25.0% down · 7.5% · 30yr · 1.5% tax · 5.0% vac · 8.0% maint · 8.0% mgmt
Financing live
Cash to close
- Down payment
- $23,125
- Closing costs
- $2,775
- Reserves months
- —
- Total cash needed
- —
Loan-product check · same deal, 3 products live
Conventional
25% down · 7.5% · 30yr
- Down + closing
- —
- Monthly P&I
- —
- Monthly cashflow
- —
- DSCR
- —
- Eligible?
- —
Personal DTI + credit; lowest rate.
DSCR
20% down · 8.5% · 30yr
- Down + closing
- —
- Monthly P&I
- —
- Monthly cashflow
- —
- DSCR
- —
- Eligible?
- —
No personal income docs; deal must DSCR.
Hard money
10% down · 12.0% · 12mo
- Down + closing
- —
- Monthly P&I
- —
- Monthly cashflow
- —
- DSCR
- —
- Eligible?
- —
Short-term bridge; refi at stabilization.
Listing history 8 events
-
2026-06-18days on market $92,500 Active 9 DOM
-
2026-06-17days on market $92,500 Active 8 DOM
-
2026-06-16days on market $92,500 Active 7 DOM
-
2026-06-15days on market $92,500 Active 6 DOM
-
2026-06-13days on market $92,500 Active 4 DOM
-
2026-06-12days on market $92,500 Active 3 DOM
-
2026-06-09remarks 233-char remark
-
2026-06-09$92,500 Active 1 DOM
ⓘ Source: listings_history table (triggers on properties + properties_extension) + one-shot
backfill from property_details.listing_events for pre-trigger history.
Climate risk First Street
- Flood 1/10 Low FEMA zone X (unshaded) · 0% chance over 30 yrs
- Wildfire 3/10 Moderate
- Heat 4/10 Moderate 8 d/yr ≥94°F today · 18 d/yr by 30 yrs out
- Wind 2/10 Low
- Air quality 2/10 Low 1 unhealthy d/yr today · 2 by 30 yrs out
Nearby sold comps map
Loading sold comps map…
Walkable amenities ~0.75 mi
Loading nearby amenities…
Taxation est. · year 1
- Rental income
- $11,456
- − Mortgage interest
- −$5,181
- − Property taxes
- −$1,388
- − Insurance
- −$462
- − Repairs & maintenance
- −$916
- − Management
- −$916
- − Depreciation
- −$2,691
- Taxable loss
- −$99
- Est. tax savings @ 24.0%
- +$24
- After-tax cash flow
- $1,403/yr
For passive investors: Depreciation is non-cash, so a rental often shows a tax loss while cash-flowing — sheltering income. Rental losses are passive: they offset passive income freely, and up to $25,000/yr can offset ordinary (W-2) income if you actively participate and your MAGI is under $100k (phasing out to $0 by $150k); unused losses carry forward. On sale, claimed depreciation is recaptured at up to 25%, and gains may owe capital-gains tax (a 1031 exchange can defer both). Figures are a year-1 estimate at your 24.0% rate — not tax advice; consult a CPA.
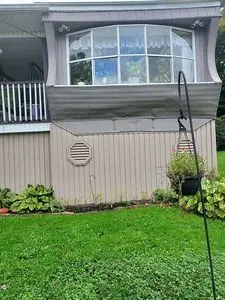
Condition & rehab AI · 1 photo
This property requires significant repairs and updates across multiple systems, including siding, roof, and interior. Landscaping and curb appeal improvements would also enhance its value.
Repairs flagged
- Major siding — Significant wear and tear
- Major roof — Siding condition suggests potential roof issues
- Major interior walls/paint — Overall poor condition
- Major bathrooms — Overall poor condition
- Major kitchen — Overall poor condition
- Major systems — Overall poor condition
Value-add opportunities
- Both paint and interior updates — Improves both appearance and value
- Both roof and siding repairs — Essential for structural integrity and appearance
- Both landscaping and curb appeal — Enhances curb appeal and property value
Renovation cost estimate screening
| Repair item | Severity | Est. cost |
|---|---|---|
| siding · Significant wear and tear | Major | $15,000–50,000 |
| roof · Siding condition suggests potential roof issues | Major | $15,000–50,000 |
| interior walls/paint · Overall poor condition | Major | $15,000–50,000 |
| bathrooms · Overall poor condition | Major | $15,000–50,000 |
| kitchen · Overall poor condition | Major | $15,000–50,000 |
| systems · Overall poor condition | Major | $15,000–50,000 |
| Total estimated repair cost · 6 items | $90,000–300,000 |
Value-add ROI direction
- Both paint and interior updates — Improves both appearance and value ↑
- Both roof and siding repairs — Essential for structural integrity and appearance ↑
- Both landscaping and curb appeal — Enhances curb appeal and property value ↑
ⓘ Cost ranges are severity-bucket heuristics (US national rule-of-thumb). Get contractor quotes + a written scope before underwriting a rehab budget.
Schools (NCES district)
- District
- Tussey Mountain SD
- NCES district ID
- 4223970
- Math proficiency
- 26% ▼ -8.00%
- Reading proficiency
- 46% ▼ -10.00%
- Median HH income
- $40,095
- Composite
- 30.15/100
- National rank
- #6329
- State rank
- #412 of 539 in PA
Livability — Saxton
- Score
- 68/100
- State rank
- #867
- US rank
- #9119
Category grades
Schools grade is shown separately in the Schools card above.
Census & demographics
- Census place
- Saxton, PA
- Population (ZIP)
- 2,461
Population outlook (Bedford County) Hauer SSP2
- Today (2025)
- 45,395 people
- By 2030
- 43,353 · -4.5%
- By 2040
- 38,858 · -14.4%
- By 2050
- 34,162 · -24.7%
- By 2075
- 24,868 · -45.2%
- By 2100
- 16,910 · -62.7%
Race, ethnicity, and origin ACS 2023
- Neighborhood character
- Predominantly White (94%)
- Race & ethnicity
- White 94% Two or more races 4% Hispanic / Latino 1%
- Common ancestry
- Romanian 2% Polish 2% Slovak 2%
- Foreign-born
- 1% · Canada
Political lean MEDSL · Bedford
- 2024 margin
- Solid R (+68.6) · D 15.4% · R 84.0%
- 2008→2024 swing
- -23.8pp toward R · 2008: -44.8pp · 2024: -68.6pp
- All cycles
- 2024: R+68.6 2020: R+67.7 2016: R+67.4 2012: R+54.9 2008: R+44.8
Not yet ingested
- Civics
- —
Market trends
- HPI YoY
- ▲ 2.71%
- Current HPI
- 150.9539
- Rent YoY
- —
- Metro
- —
- State GDP YoY
- ▲ 1.68%
- F500 in state
- 34
Industry mix (Fortune 500 HQ in PA)
| Industry | F500 HQs | Revenue |
|---|---|---|
| Healthcare | 2 | $309B |
|
||
| Insurance | 2 | $27B |
|
||
| Telecommunications / Media | 1 | $124B |
|
||
| Industrial Distribution | 1 | $22B |
|
||
| Financial Services | 1 | $20B |
|
||
| Chemicals / Materials | 1 | $18B |
|
||
Price history
1 event — show timeline
- 2026-06-10 Listed $92,500 FSBO.com
Cash-flow waterfall
monthlySold comps — $/sqft
last 12 mo · ≤1 miLoading sold comps…