479 Dartmoor Ct Unit B · Leisure Village, NJ
Flood risk 1/10 · Minimal
- FEMA flood zone
- X (unshaded)
- Chance of flooding over 30 yrs
- 0.0%
- Est. flood insurance / yr
- $507 – $1,088
Fire risk 1/10 · Minimal
- Est. fire insurance / yr
- $526 – $976
Heat risk 7/10 · Major
- Hot days now (above 103°F)
- 7 days/yr
- Hot days in 30 yrs
- 15 days/yr
Wind risk 6/10 · Moderate
- Chance of severe wind over 30 yrs
- 68.0%
Air-quality risk 3/10 · Minor
- Unhealthy air days now
- 3 days/yr
- Unhealthy air days in 30 yrs
- 4 days/yr
Risk factors via First Street. Map © Google.
Why this score? — see what drove the C grade
The composite is a weighted blend of 9 inputs, each scored 0–100. Each bar is that input's sub-score; the figure is the points it added to the 100-point composite (weight × sub-score).
- Cash flow +21.2/30.0
- 1% rule +9.3/10.0
- ARV discount +8.2/15.0
- DSCR +6.8/10.0
- Livability +3.2/5.0
- Rent growth +2.5/5.0
- Condition / age +2.5/5.0
- Schools +1.9/10.0
- Appreciation +0.0/10.0
$127,900
🖨 Deal sheet 📄 Offer letter ✓ Due diligence
Listing remarks
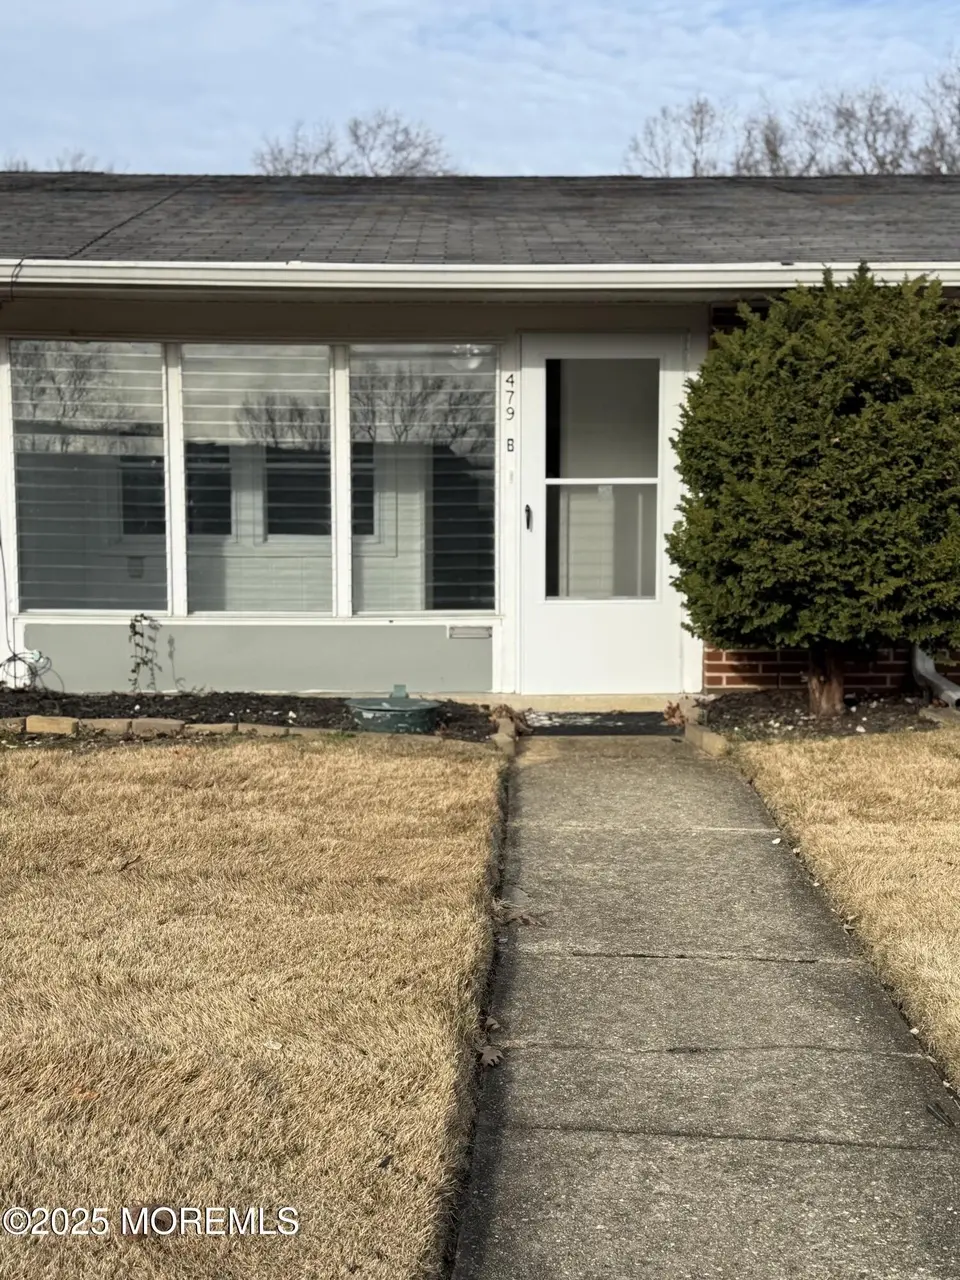
Enjoy this Eton model featuring all laminate flooring, newer windows, BRAND NEW front and back storm doors. Bedroom has 2 large closets. Kitchen offers a BRAND NEW stove, and refrigerator, Spacious living room leads to an enclosed back porch which is carpeted and also has storage closet. Move-in condition!
Key facts
- Parking
- Pool
- Built 1969
Neighborhood map
What this means for you Summary
Snapshot
- This is a 1-bed/1.0-bath single-family listed at $128k.
Deal economics
- At list price, monthly cash flow is $185 ($2k/yr) — positive.
- The deal already cash-flows at list — no discount required.
- Meets the 1% rule at list price ($2k rent vs $128k).
- Cap rate 8.0% vs local median 6.0% in Leisure Village — top-decile yield for the area; either an underpriced asset or a hidden risk that comps aren't pricing in. Stress-test before assuming the spread holds.
Location & tenants
- Location reads 64/100 on livability (#416 in NJ) — a middle-class / working-renter tenant base. Strengths: housing A+, crime B+, cost of living B; Watch: schools D, amenities F, commute F.
- Lakewood Township School District (suburban): math 17% / reading 28% proficiency, ranked #417 of 472 in NJ (top 88%) — low school quality limits family demand, transient renter base, plan for 1-2y turnover; 82% free/reduced lunch — lower-income household profile, screen leases tightly.
- Market conditions: 419 active listings in the ZIP; 1 comparable units currently listed for rent nearby; 4,434 units permitted in Ocean County in 2024 (868 in 5+ unit buildings).
- This rent runs 34% of the median local income ($65k/yr) — at the standard rent-burdened threshold; future hikes will face affordability resistance.
Forward outlook
- Local home prices are declining (-3.0%/yr); year-one equity from $884 of loan paydown is wiped out by about $4k of value loss. Plan a longer hold.
- Ocean County population projected to shrink 8% by 2050 — rents likely to lag national; underwrite the cash flow, not the appreciation.
Negotiation context
- Only 7 days on market — expect competitive offers; lowballing is unlikely to land.
- 4 sale attempts since 27y ago with the ask held roughly flat each time — persistent listings suggest the price (not the market) is what's stuck; bring a comps-based counter.
Risks & watch-outs
- Watch-outs: HOA is 20% of rent.
- Climate carrying-cost: major wind risk, 68% chance of damaging wind over 30y; extreme-heat days projected 7→15/yr by 2055 (HVAC capex compounding) — expect insurance premiums to compound above CPI over the hold.
Questions for the listing agent
- Built in 1969 — when were the roof, HVAC, electrical panel, plumbing, and water heater last replaced?
- What does the HOA fee cover, when was the last increase, and are there any pending special assessments or reserve-fund shortfalls?
- Is there a deadline driving the sale (1031 exchange, divorce, estate, relocation)? That informs how much negotiation room exists.
- Schools are D-rated, which usually means shorter tenancies and higher turnover. Who's the typical renter profile here, and what's been the actual vacancy rate?
- What's the average days-on-market for RENTAL listings here right now (not sales)? A rising rental-DOM trend means longer vacancies and softer asking-rent achievability than the comps imply.
- What's the recent tenant-quality profile in this submarket — average credit score on applications, eviction rate, late-payment / NSF rate, and stable-employment percentage? A property-management company in the area should have these aggregated.
- How much new for-sale + rental construction is in the pipeline within 1–3 miles? Heavy new supply typically softens prices + rents 12–24 months out; constrained supply supports both.
Investment metrics
- 1% rule
- 1.43% ✓
- Cap rate
- 8.03%
- Cash-on-cash
- 6.19%
- DSCR
- 1.28
- GRM
- 5.8
CMA / ARV
- ARV (on-the-fly)
- $129,948
- Comps found
- 12
Show comp detail 12 sales within ~0.75 mi
| Address | Dist | Beds/Ba | Sqft | Sold | Price | $/sf | Match |
|---|---|---|---|---|---|---|---|
| 479 Dartmoor Ct Unit B | 0.00mi | 1/1.0 | 663 (0%) | 0mo | $133,000 | $201 | 100 |
| 533 Dartmoor Ct Unit F | 0.08mi | 1/1.0 | 663 (0%) | 1mo | $103,000 | $155 | 95 |
| 474E Thornbury Ct | 0.10mi | 1/1.0 | 663 (0%) | 9mo | $124,000 | $187 | 88 |
| 474F Thornbury Ct | 0.10mi | 1/1.0 | 663 (0%) | 9mo | $110,000 | $166 | 88 |
| 472B Thornbury Ct | 0.13mi | 1/1.0 | 663 (0%) | 10mo | $135,000 | $204 | 86 |
| 434F Portsmouth Dr | 0.28mi | 1/1.0 | 663 (0%) | 2mo | $149,000 | $225 | 85 |
| 161A Gramercy Ct | 0.43mi | 1/1.0 | 663 (0%) | 1mo | $130,000 | $196 | 79 |
| 434 Portsmouth Dr Unit E | 0.27mi | 1/1.0 | 663 (0%) | 13mo | $132,000 | $199 | 76 |
| 160D Gramercy Ct | 0.43mi | 1/1.0 | 670 (+1%) | 2mo | $123,000 | $184 | 76 |
| 318 Coventry Ct | 0.50mi | 1/1.0 | 663 (0%) | 3mo | $125,000 | $189 | 74 |
| 303A W Malvern Ct | 0.53mi | 1/1.0 | 663 (0%) | 2mo | $127,000 | $192 | 74 |
| 318C Coventry Ct | 0.50mi | 1/1.0 | 663 (0%) | 15mo | $149,900 | $226 | 64 |
Match score weights: distance 35% · size 25% · config 20% · recency 20%. Top-matched comps best support the ARV.
Projected returns pro-forma
-3.0% appreciation · 3.0% rent growth · sell at horizon
- IRR
- -6.5%
- Equity multiple
- 0.76×
- Total profit
- $-8,701
- Equity at exit
- $19,070
- IRR
- 3.3%
- Equity multiple
- 1.24×
- Total profit
- $8,617
- Equity at exit
- $11,058
Cash invested: $35,812 (down + closing). Projections, not guarantees.
Landlord ↔ Tenant lean methodology
- Overall (STATE)
- 21 Tenant-Leaning
- State New Jersey
- 21 Tenant-Leaning · D+6
- County
- — inherits STATE
- City
- — inherits STATE
ZIP-level market 08701
- Active inventory
- 419
- Price-to-rent
- 5.8×
Monthly cashflow live
- Estimated rent
- $1,824 medium interval (Pro) →
- Mortgage (P&I)
- −$671
- Tax est. 1.5%
- −$160 /mo · $1,918/yr
- Insurance
- −$53
- HOA
- −$372
- Vacancy / Maint / Mgmt
- −$383
- Net cashflow
- $185
Break-even live
UW: 25.0% down · 7.5% · 30yr · 1.5% tax · 5.0% vac · 8.0% maint · 8.0% mgmt
Financing live
Cash to close
- Down payment
- $31,975
- Closing costs
- $3,837
- Reserves months
- —
- Total cash needed
- —
Loan-product check · same deal, 3 products live
Conventional
25% down · 7.5% · 30yr
- Down + closing
- —
- Monthly P&I
- —
- Monthly cashflow
- —
- DSCR
- —
- Eligible?
- —
Personal DTI + credit; lowest rate.
DSCR
20% down · 8.5% · 30yr
- Down + closing
- —
- Monthly P&I
- —
- Monthly cashflow
- —
- DSCR
- —
- Eligible?
- —
No personal income docs; deal must DSCR.
Hard money
10% down · 12.0% · 12mo
- Down + closing
- —
- Monthly P&I
- —
- Monthly cashflow
- —
- DSCR
- —
- Eligible?
- —
Short-term bridge; refi at stabilization.
Rent comps 1 comps
| Address | Beds | Baths | Sqft | Rent | $/sqft | DOM | Units | Dist |
|---|---|---|---|---|---|---|---|---|
| 219 Buckingham Ct Lakewood, NJ | 1.0 | 1.0 | 663 | $1,900 | $2.87 | 43d | 1 | 0.41mi |
HOA detail
- Monthly dues
- $372 · $4,464/yr
Listing history 8 events
-
2026-04-24status Pending
-
2026-04-17$127,900 Active
-
2026-04-10price $127,900
-
2026-02-26status Active
-
2026-01-23status Pending
-
2025-12-15$129,900 Active
-
2000-03-02historical
-
1999-08-02$32,900
ⓘ Source: listings_history table (triggers on properties + properties_extension) + one-shot
backfill from property_details.listing_events for pre-trigger history.
Climate risk First Street
- Flood 1/10 Low FEMA zone X (unshaded) · 0% chance over 30 yrs
- Wildfire 1/10 Low
- Heat 7/10 Severe 7 d/yr ≥103°F today · 15 d/yr by 30 yrs out
- Wind 6/10 Major 68% chance of damaging wind over 30 yrs
- Air quality 3/10 Moderate 3 unhealthy d/yr today · 4 by 30 yrs out
Nearby sold comps map
Loading sold comps map…
Walkable amenities ~0.75 mi
Loading nearby amenities…
Taxation est. · year 1
- Rental income
- $21,883
- − Mortgage interest
- −$7,164
- − Property taxes
- −$1,918
- − Insurance
- −$640
- − Repairs & maintenance
- −$1,751
- − Management
- −$1,751
- − HOA
- −$4,464
- − Depreciation
- −$3,721
- Taxable income
- $475
- Est. tax owed @ 24.0%
- −$114
- After-tax cash flow
- $2,103/yr
For passive investors: Depreciation is non-cash, so a rental often shows a tax loss while cash-flowing — sheltering income. Rental losses are passive: they offset passive income freely, and up to $25,000/yr can offset ordinary (W-2) income if you actively participate and your MAGI is under $100k (phasing out to $0 by $150k); unused losses carry forward. On sale, claimed depreciation is recaptured at up to 25%, and gains may owe capital-gains tax (a 1031 exchange can defer both). Figures are a year-1 estimate at your 24.0% rate — not tax advice; consult a CPA.
Schools (NCES district)
- District
- Lakewood Township School District
- NCES district ID
- 3408220
- Math proficiency
- 17% ▼ -4.00%
- Reading proficiency
- 28% ▼ -5.00%
- Median HH income
- $42,301
- Composite
- 19.21/100
- National rank
- #8813
- State rank
- #417 of 472 in NJ
Livability — Leisure Village
- Score
- 64/100
- State rank
- #416
- US rank
- #14624
Category grades
Schools grade is shown separately in the Schools card above.
Census & demographics
- Census place
- Leisure Village, NJ
- County
- Ocean County · 439,426 people
- Metro
- New York-Newark-Jersey City, NY-NJ-PA
- Population (ZIP)
- 139,149
- Household income
- $64,959
- Rent vs Own
- Severe rent burden
- 5757.0
Population outlook (Ocean County) Hauer SSP2
- Today (2025)
- 586,991 people
- By 2030
- 581,403 · -1.0%
- By 2040
- 564,913 · -3.8%
- By 2050
- 538,149 · -8.3%
- By 2075
- 468,845 · -20.1%
- By 2100
- 350,297 · -40.3%
Race, ethnicity, and origin ACS 2023
- Neighborhood character
- Predominantly White (84%)
- Race & ethnicity
- White 84% Hispanic / Latino 11% Two or more races 5% Black 2%
- Hispanic origin (detail)
- Mexican 5% Puerto Rican 2% Dominican 2%
- Common ancestry
- Romanian 6% Italian 5% Scotch-Irish 2%
- Foreign-born
- 8% · Canada, Jamaica
- Languages at home
- 77% English-only · Spanish 9% German/W. Germanic 7% Russian/Polish/Slavic 1%
Political lean MEDSL · Ocean
- 2024 margin
- Solid R (+36.0) · D 31.4% · R 67.4% · Other 1.2%
- 2008→2024 swing
- -17.6pp toward R · 2008: -18.4pp · 2024: -36.0pp
- All cycles
- 2024: R+36.0 2020: R+28.7 2016: R+34.0 2012: R+17.7 2008: R+18.4
Not yet ingested
- Civics
- —
Market trends
- HPI YoY
- ▼ -682.83%
- Current HPI
- 465.344
- Rent YoY
- —
- Metro
- New York-Newark-Jersey City, NY-NJ-PA
- State GDP YoY
- ▲ 2.05%
- F500 in state
- 34
Industry mix (Fortune 500 HQ in NJ)
| Industry | F500 HQs | Revenue |
|---|---|---|
| Consumer Goods | 3 | $31B |
|
||
| Pharmaceuticals | 2 | $153B |
|
||
| Technology | 2 | $21B |
|
||
| Insurance | 2 | $20B |
|
||
| Healthcare | 2 | $19B |
|
||
| Financial Services | 1 | $70B |
|
||
Price history
+288.8% since first listed8 events — show timeline
- 2026-04-24 Pending — MOMLS
- 2026-04-17 Listed $127,900 MOMLS
- 2026-04-10 Price Changed $127,900 MOMLS
- 2026-02-26 Relisted — MOMLS
- 2026-01-23 Pending — MOMLS
- 2025-12-15 Listed $129,900 MOMLS
- 2000-03-02 Listing Removed — BRIGHT MLS
- 1999-08-02 Listed $32,900 BRIGHT MLS
Cash-flow waterfall
monthlySold comps — $/sqft
last 12 mo · ≤1 miLoading sold comps…