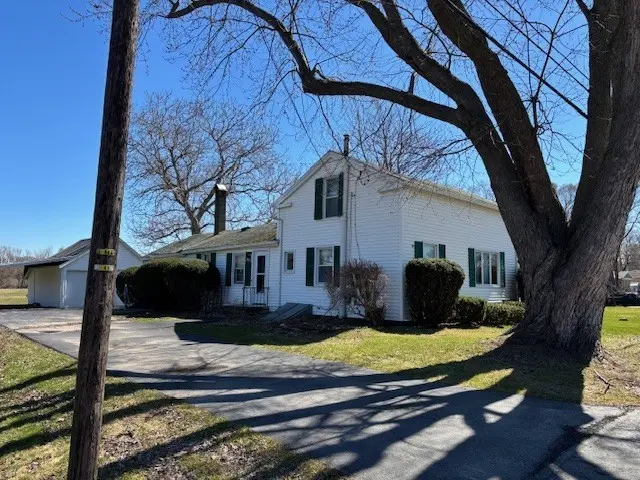
380 N Greece Rd · Hilton, NY
Flood risk 1/10 · Minimal
- FEMA flood zone
- X (unshaded)
- Chance of flooding over 30 yrs
- 0.0%
- Est. flood insurance / yr
- $473 – $860
Fire risk 1/10 · Minimal
- Est. fire insurance / yr
- $691 – $1,283
Heat risk 2/10 · Minimal
- Hot days now (above 95°F)
- 7 days/yr
- Hot days in 30 yrs
- 16 days/yr
Wind risk 1/10 · Minimal
- Chance of severe wind over 30 yrs
- —
Air-quality risk 2/10 · Minimal
- Unhealthy air days now
- 1 days/yr
- Unhealthy air days in 30 yrs
- 1 days/yr
Risk factors via First Street. Map © Google.
Why this score? — see what drove the D- grade
The composite is a weighted blend of 9 inputs, each scored 0–100. Each bar is that input's sub-score; the figure is the points it added to the 100-point composite (weight × sub-score).
- Cash flow +11.0/30.0
- ARV discount +7.5/15.0
- Schools +5.3/10.0
- Livability +3.7/5.0
- 1% rule +3.6/10.0
- DSCR +3.2/10.0
- Rent growth +2.5/5.0
- Condition / age +2.5/5.0
- Appreciation +0.0/10.0
$189,900
🖨 Deal sheet 📄 Offer letter ✓ Due diligence
Listing remarks MLS
Survived Delayed negotiations. .. This is an Estate. .. Check out this three bedroom, 1 bath home w/ detached garage, multiple out buildings and large yard!
Key facts
- 278ft frontage
- New septic
- Rolling horse farm
Tags
Property features AI
Exterior
- Parking: Detached garage with garage door opener; 3 garage spaces
- Utilities: Electricity connected (circuit breakers); Public water connected; Septic tank; Cable available
- Home design: 2-story house; Resale property
- Construction: Vinyl siding; Stone foundation; Copper plumbing
- Exterior features: Enclosed porch; Porch; Blacktop driveway; Barn(s), outbuilding and poultry coop; Rectangular lot; Road frontage on a main thoroughfare
Interior
- Kitchen: Electric oven; Electric range; Refrigerator
- Bedrooms: One bedroom on the main level
- Flooring: Hardwood; Carpet; Varies
- Bathrooms: One full bathroom (main level)
- Heating & cooling: Forced air heating; Gas heating
- Interior features: Separate formal dining room; Eat-in kitchen; Separate formal living room; Leaded glass windows; Thermal windows; Has basement with exterior entry, full walk-up access and sump pump
- Laundry & utility: Main level laundry; Washer; Dryer; Gas water heater
Neighborhood map
What this means for you Summary
Snapshot
- This is a 2-bed/1.0-bath single-family listed at $190k.
Deal economics
- At list price, monthly cash flow is $-79 ($-945/yr) — negative.
- To cash-flow at today's rent, offer at most $176k (7.3% below list).
- To meet the 1% rule (rent ≥ 1% of price), the offer needs to be $163k (14.3% below list).
- Recommended offer: $163k (14.3% below list) — sets the bar for 1% rule.
- Cap rate 5.8% vs local median 2.7% in Hilton — top-decile yield for the area; either an underpriced asset or a hidden risk that comps aren't pricing in. Stress-test before assuming the spread holds.
Location & tenants
- Location reads 73/100 on livability (#324 in NY) — a middle-class / working-renter tenant base. Strengths: housing A+, health & safety A+, schools B+; Watch: crime D, amenities F, commute F.
- Hilton Central School District (suburban): math 53% / reading 67% proficiency, ranked #219 of 590 in NY (top 37%) — acceptable for families but not a draw, mixed tenant base, ~2y average lease; only 16% free/reduced lunch — higher-income household profile.
- Market conditions: 95 active listings in the ZIP; solid renter incomes; 1,169 units permitted in Monroe County in 2024 (591 in 5+ unit buildings).
Forward outlook
- Local home prices are declining (-3.0%/yr); year-one equity from $1k of loan paydown is wiped out by about $6k of value loss. Plan a longer hold.
- Monroe County population projected to shrink 6% by 2050 — rents likely to lag national; underwrite the cash flow, not the appreciation.
Negotiation context
- Only 12 days on market — expect competitive offers; lowballing is unlikely to land.
- 2 sale attempts with the ask held roughly flat each time — persistent listings suggest the price (not the market) is what's stuck; bring a comps-based counter.
Risks & watch-outs
- Watch-outs: built in 1850 — expect roof / HVAC / electrical / plumbing capex.
Questions for the listing agent
- What do current leases actually rent for vs. the listed asking? Can we see a recent rent roll and the last 12 months of T-12 income?
- Built in 1850 — when were the roof, HVAC, electrical panel, plumbing, and water heater last replaced?
- Is there a deadline driving the sale (1031 exchange, divorce, estate, relocation)? That informs how much negotiation room exists.
- Schools are B-rated — typically a magnet for longer-tenancy family renters. What's the average tenant stay here, and is there a school-zone premium baked into asking?
- Crime grade is D in this area — have there been break-ins, vandalism, or insurance claims at this property in the last 3 years? What carrier currently insures it and at what premium?
- The area grade is low — what's the realistic commute time and amenity access for the typical tenant pool here? Any planned neighborhood developments (good or bad) we should know about?
- What's the average days-on-market for RENTAL listings here right now (not sales)? A rising rental-DOM trend means longer vacancies and softer asking-rent achievability than the comps imply.
- What's the recent tenant-quality profile in this submarket — average credit score on applications, eviction rate, late-payment / NSF rate, and stable-employment percentage? A property-management company in the area should have these aggregated.
- How much new for-sale + rental construction is in the pipeline within 1–3 miles? Heavy new supply typically softens prices + rents 12–24 months out; constrained supply supports both.
Investment metrics
- 1% rule
- 0.86% ✗
- Cap rate
- 5.80%
- Cash-on-cash
- -1.78%
- DSCR
- 0.92
- GRM
- 9.7
CMA / ARV
- ARV (median comp)
- $406,705
- List price
- $189,900
- Delta
- -53.31%
- Verdict
- UNDERPRICED
- Comps
- 20 within 1.0 mi
Show comp detail 5 sales within ~0.75 mi
| Address | Dist | Beds/Ba | Sqft | Sold | Price | $/sf | Match |
|---|---|---|---|---|---|---|---|
| 52 Sable Ridge Ln | 0.73mi | 2/2.0 | 1,260 (-9%) | 7mo | $280,000 | $222 | 42 |
| 101 Avery Park Ln | 0.64mi | 3/2.0 (+1) | 1,456 (+5%) | 13mo | $335,000 | $230 | 41 |
| 283 Avery Park Ln Ln | 0.51mi | 3/2.0 (+1) | 1,559 (+13%) | 8mo | $393,000 | $252 | 39 |
| 55 Post Ave | 0.68mi | 3/1.0 (+1) | 1,534 (+11%) | 11mo | $210,000 | $137 | 36 |
| 70 Sable Ridge Ln | 0.69mi | 2/2.0 | 1,260 (-9%) | 16mo | $320,000 | $254 | 35 |
Match score weights: distance 35% · size 25% · config 20% · recency 20%. Top-matched comps best support the ARV.
Projected returns pro-forma
-3.0% appreciation · 3.0% rent growth · sell at horizon
- IRR
- -19.2%
- Equity multiple
- 0.33×
- Total profit
- $-35,733
- Equity at exit
- $28,315
- IRR
- -11.8%
- Equity multiple
- 0.30×
- Total profit
- $-37,347
- Equity at exit
- $16,419
Cash invested: $53,172 (down + closing). Projections, not guarantees.
Landlord ↔ Tenant lean methodology
- Overall (STATE)
- 15 Strongly Tenant-Friendly
- State New York
- 15 Strongly Tenant-Friendly · D+10
- County
- — inherits STATE
- City
- — inherits STATE
ZIP-level market 14468
- Home prices YoY
- -15.1%
- Active inventory
- 95
- Price-to-rent
- 9.7×
Monthly cashflow live
- Estimated rent
- $1,627 medium interval (Pro) →
- Mortgage (P&I)
- −$996
- Tax from tax record
- −$289 /mo · $3,467/yr
- Insurance
- −$79
- HOA
- −$0
- Vacancy / Maint / Mgmt
- −$342
- Net cashflow
- $-79
Break-even live
UW: 25.0% down · 7.5% · 30yr · 1.5% tax · 5.0% vac · 8.0% maint · 8.0% mgmt
Financing live
Cash to close
- Down payment
- $47,475
- Closing costs
- $5,697
- Reserves months
- —
- Total cash needed
- —
Loan-product check · same deal, 3 products live
Conventional
25% down · 7.5% · 30yr
- Down + closing
- —
- Monthly P&I
- —
- Monthly cashflow
- —
- DSCR
- —
- Eligible?
- —
Personal DTI + credit; lowest rate.
DSCR
20% down · 8.5% · 30yr
- Down + closing
- —
- Monthly P&I
- —
- Monthly cashflow
- —
- DSCR
- —
- Eligible?
- —
No personal income docs; deal must DSCR.
Hard money
10% down · 12.0% · 12mo
- Down + closing
- —
- Monthly P&I
- —
- Monthly cashflow
- —
- DSCR
- —
- Eligible?
- —
Short-term bridge; refi at stabilization.
Listing history 6 events
-
2026-05-07$189,900 Active 305-char remark
-
2025-12-24soldstatus $169,000
-
2025-12-23soldstatus $169,000 Closed 156-char remark
Show marketing remark (156 chars)
Survived Delayed negotiations. .. This is an Estate. .. Check out this three bedroom, 1 bath home w/ detached garage, multiple out buildings and large yard!
-
2025-10-15status Pending 156-char remark
Show marketing remark (156 chars)
Survived Delayed negotiations. .. This is an Estate. .. Check out this three bedroom, 1 bath home w/ detached garage, multiple out buildings and large yard!
-
2025-09-22price $179,900 156-char remark
Show marketing remark (156 chars)
Survived Delayed negotiations. .. This is an Estate. .. Check out this three bedroom, 1 bath home w/ detached garage, multiple out buildings and large yard!
-
2025-08-25$189,900 Active 156-char remark
Show marketing remark (156 chars)
Survived Delayed negotiations. .. This is an Estate. .. Check out this three bedroom, 1 bath home w/ detached garage, multiple out buildings and large yard!
ⓘ Source: listings_history table (triggers on properties + properties_extension) + one-shot
backfill from property_details.listing_events for pre-trigger history.
Tax reassessment forecast NY · Partial reset (capped growth)
- Current annual tax
- $3,467 · $289/mo
- Projected year-2 tax
- $3,467 · $289/mo
- Expected delta
- $0/yr ($0/mo · 0.0%)
ⓘ Screening estimate from a state-policy table — verify with the county assessor before closing.
Climate risk First Street
- Flood 1/10 Low FEMA zone X (unshaded) · 0% chance over 30 yrs
- Wildfire 1/10 Low
- Heat 2/10 Low 7 d/yr ≥95°F today · 16 d/yr by 30 yrs out
- Wind 1/10 Low
- Air quality 2/10 Low 1 unhealthy d/yr today · 1 by 30 yrs out
Nearby sold comps map
Loading sold comps map…
Walkable amenities ~0.75 mi
Loading nearby amenities…
Taxation est. · year 1
- Rental income
- $19,521
- − Mortgage interest
- −$10,637
- − Property taxes
- −$3,467
- − Insurance
- −$950
- − Repairs & maintenance
- −$1,562
- − Management
- −$1,562
- − Depreciation
- −$5,524
- Taxable loss
- −$4,181
- Est. tax savings @ 24.0%
- +$1,003
- After-tax cash flow
- $58/yr
For passive investors: Depreciation is non-cash, so a rental often shows a tax loss while cash-flowing — sheltering income. Rental losses are passive: they offset passive income freely, and up to $25,000/yr can offset ordinary (W-2) income if you actively participate and your MAGI is under $100k (phasing out to $0 by $150k); unused losses carry forward. On sale, claimed depreciation is recaptured at up to 25%, and gains may owe capital-gains tax (a 1031 exchange can defer both). Figures are a year-1 estimate at your 24.0% rate — not tax advice; consult a CPA.
Schools (NCES district)
- District
- Hilton Central School District
- NCES district ID
- 3614460
- Math proficiency
- 53% ▼ -11.00%
- Reading proficiency
- 67% ▲ 9.00%
- Median HH income
- $68,270
- Composite
- 52.77/100
- National rank
- #1544
- State rank
- #219 of 590 in NY
Livability — Hilton
- Score
- 73/100
- State rank
- #324
- US rank
- #5354
Category grades
Schools grade is shown separately in the Schools card above.
Census & demographics
- County
- Monroe County · 674,131 people
- City population
- 18,526
- Metro
- Rochester, NY
- Population (ZIP)
- 18,526
- Household income
- $98,693
- Rent vs Own
- Severe rent burden
- 391.0
Population outlook (Monroe County) Hauer SSP2
- Today (2025)
- 759,460 people
- By 2030
- 757,154 · -0.3%
- By 2040
- 740,644 · -2.5%
- By 2050
- 714,443 · -5.9%
- By 2075
- 645,883 · -15.0%
- By 2100
- 547,084 · -28.0%
Race, ethnicity, and origin ACS 2023
- Neighborhood character
- Predominantly White (91%)
- Race & ethnicity
- White 91% Two or more races 6% Hispanic / Latino 5% Black 1%
- Common ancestry
- Romanian 7% Lithuanian 2% Iranian 1%
- Foreign-born
- 3% · Canada
- Languages at home
- 94% English-only · Spanish 3% Other Indo-European 1% German/W. Germanic 1%
Political lean MEDSL · Monroe
- 2024 margin
- D (+19.1) · D 59.5% · R 40.5%
- 2008→2024 swing
- +1.4pp toward D · 2008: 17.7pp · 2024: 19.1pp
- All cycles
- 2024: D+19.1 2020: D+21.0 2016: D+14.1 2012: D+17.4 2008: D+17.7
Not yet ingested
- Civics
- —
Market trends
- HPI YoY
- ▼ -45.39%
- Current HPI
- 256.2599
- Rent YoY
- —
- Metro
- Rochester, NY
- State GDP YoY
- ▲ 2.60%
- F500 in state
- 92
Industry mix (Fortune 500 HQ in NY)
| Industry | F500 HQs | Revenue |
|---|---|---|
| Financial Services | 10 | $950B |
|
||
| Consumer Goods | 9 | $162B |
|
||
| Insurance | 4 | $225B |
|
||
| Telecommunications | 2 | $144B |
|
||
| Pharmaceuticals | 2 | $112B |
|
||
| Media / Entertainment | 2 | $69B |
|
||
Price history
+0.0% since first listed7 events — show timeline
- 2026-05-19 Pending — UNYREIS
- 2026-05-07 Listed $189,900 UNYREIS
- 2025-12-24 Sold (Public Records) $169,000 Public Records
- 2025-12-23 Sold (MLS) $169,000 UNYREIS
- 2025-10-15 Pending — UNYREIS
- 2025-09-22 Price Changed $179,900 UNYREIS
- 2025-08-25 Listed $189,900 UNYREIS
Property tax history
+12.4%/yrLatest (2025): $3,467 · +74.0% YoY. Source: county tax records.
Cash-flow waterfall
monthlySold comps — $/sqft
last 12 mo · ≤1 miLoading sold comps…