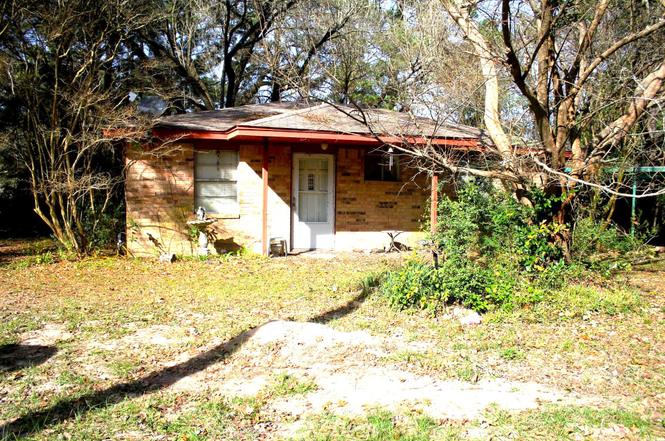
386 Lawrence Rd · Westwood Shores, TX
Flood risk No data
- FEMA flood zone
- —
- Chance of flooding over 30 yrs
- —
- Est. flood insurance / yr
- —
Fire risk No data
- Est. fire insurance / yr
- —
Heat risk No data
- Hot days now (above threshold)
- —
- Hot days in 30 yrs
- —
Wind risk No data
- Chance of severe wind over 30 yrs
- —
Air-quality risk No data
- Unhealthy air days now
- —
- Unhealthy air days in 30 yrs
- —
Risk factors via First Street. Map © Google.
Why this score? — see what drove the B grade
The composite is a weighted blend of 9 inputs, each scored 0–100. Each bar is that input's sub-score; the figure is the points it added to the 100-point composite (weight × sub-score).
- Cash flow +30.0/30.0
- 1% rule +10.0/10.0
- DSCR +10.0/10.0
- ARV discount +7.5/15.0
- Appreciation +4.7/10.0
- Schools +3.8/10.0
- Livability +3.1/5.0
- Rent growth +2.5/5.0
- Condition / age +2.5/5.0
$39,000
🖨 Deal sheet 📄 Offer letter ✓ Due diligence
Listing remarks
Looking for a value-add opportunity in a quiet rural setting? This 2 bedroom, 1 bath brick home sits on approx. 0.30 acres in Trinity and offers plenty of potential for someone ready to bring it back to life and make it their own. The home is approx. 1,096 sq. ft. , with a slab foundation, nice-sized utility room, and a 2-car carport with attached storage. There is a roof opening over the utility room from a fallen limb, and the property has not been lived in for several years, so repairs and finish-out will be needed. Public water is believed to serve the property, with septic system in place (buyer to verify). Nearby access to White Rock Creek/Trinity River/Lake Livingston area and close
Key facts
- Slab foundation
- 2 car carport
- Utility room
Tags
Property features AI
Finance
- Other: Seller disclosure available
- Financial info: Lease not considered
Exterior
- Parking: Detached carport; Carport for 2 vehicles
- Utilities: Public water; Septic tank sewer
- Home design: Residential property; Full ownership; Slab foundation
- Construction: Brick construction; Composition roof
- Exterior features: Partial fencing; Fence
Interior
- Kitchen: Kitchen (12x9)
- Bedrooms: Two bedrooms on the first floor (12x9; 11x10)
- Flooring: Carpet; Vinyl
- Bathrooms: One full bathroom on the first floor (9x5)
- Heating & cooling: Central heating (electric); Central air conditioning (electric)
- Interior features: Kitchen and family room combined; Pantry and walk-in pantry; Ceiling fans
- Laundry & utility: Utility room on the first floor (11x5)
Neighborhood map
What this means for you Summary
Snapshot
- This is a 2-bed/1.0-bath single-family listed at $39k.
Deal economics
- At list price, monthly cash flow is $545 ($7k/yr) — positive.
- The deal already cash-flows at list — no discount required.
- Meets the 1% rule at list price ($1k rent vs $39k).
- Recommended offer: $38k (1.5% below list) — sets the bar for market timing.
- Cap rate 23.1% vs local median 3.6% in Westwood Shores — top-decile yield for the area; either an underpriced asset or a hidden risk that comps aren't pricing in. Stress-test before assuming the spread holds.
Location & tenants
- Location reads 62/100 on livability (#914 in TX) — a middle-class / working-renter tenant base. Strengths: crime A+, cost of living A+, housing A+; Watch: amenities F, commute F, health & safety F.
- Groveton ISD (rural): math 45% / reading 46% proficiency, ranked #281 of 826 in TX (top 34%) — families likely to look elsewhere, expect single-tenant / working-renter base with shorter leases.
- Zoned schools: Groveton J H-H S (math 50% / reading 49%, grade D, #509 of 1,632 statewide, top 34%, 428 students, 62% FRL).
- Market conditions: 468 active listings in the ZIP; 1 units permitted in Trinity County in 2024 (0 in 5+ unit buildings).
Forward outlook
- In year one you build about $68 of equity ($270 loan paydown + $-202 appreciation (-0.5% local appreciation)).
- Trinity County population projected at -13% by 2050 — secular population decline; favor cash flow + early exit over multi-decade hold.
- At projected returns (-0.5% appreciation + 3.0% rent growth), your $11k cash investment doubles in ~2 years — after that, you're playing with house money.
Negotiation context
- It's been on market 19 days — a 2% lower offer ($38k) is reasonable based on typical stale-listing flexibility.
- 2 sale attempts; this cycle's ask is 12% above the opening price — seller raised mid-cycle; expect resistance to lowballs.
Risks & watch-outs
- Watch-outs: property tax is 4.5% of price.
Questions for the listing agent
- Property tax is high relative to price — has the assessment been appealed recently, and will the sale trigger a re-assessment?
- Is there a deadline driving the sale (1031 exchange, divorce, estate, relocation)? That informs how much negotiation room exists.
- Schools are F-rated, which usually means shorter tenancies and higher turnover. Who's the typical renter profile here, and what's been the actual vacancy rate?
- What's the average days-on-market for RENTAL listings here right now (not sales)? A rising rental-DOM trend means longer vacancies and softer asking-rent achievability than the comps imply.
- What's the recent tenant-quality profile in this submarket — average credit score on applications, eviction rate, late-payment / NSF rate, and stable-employment percentage? A property-management company in the area should have these aggregated.
- How much new for-sale + rental construction is in the pipeline within 1–3 miles? Heavy new supply typically softens prices + rents 12–24 months out; constrained supply supports both.
Investment metrics
- 1% rule
- 2.96% ✓
- Cap rate
- 23.05%
- Cash-on-cash
- 59.86%
- DSCR
- 3.66
- GRM
- 2.8
CMA / ARV
- ARV (on-the-fly)
- $137,000
- Comps found
- 2
Show comp detail 2 sales within ~0.75 mi
| Address | Dist | Beds/Ba | Sqft | Sold | Price | $/sf | Match |
|---|---|---|---|---|---|---|---|
| 411 Lawrence Rd | 0.04mi | 1/1.0 (-1) | 1,000 (-9%) | 9mo | $104,900 | $105 | 71 |
| 440 Lakeside Dr | 0.53mi | 2/1.5 | 1,247 (+14%) | 21mo | $156,000 | $125 | 33 |
Match score weights: distance 35% · size 25% · config 20% · recency 20%. Top-matched comps best support the ARV.
Projected returns pro-forma
-0.52% appreciation · 3.0% rent growth · sell at horizon
- IRR
- 61.2%
- Equity multiple
- 3.99×
- Total profit
- $32,694
- Equity at exit
- $10,327
- IRR
- 63.8%
- Equity multiple
- 8.10×
- Total profit
- $77,540
- Equity at exit
- $11,643
Cash invested: $10,920 (down + closing). Projections, not guarantees.
Landlord ↔ Tenant lean methodology
- Overall (STATE)
- 87 Strongly Landlord-Friendly
- State Texas
- 87 Strongly Landlord-Friendly · R+5
- County
- — inherits STATE
- City
- — inherits STATE
ZIP-level market 75862
- Home prices YoY
- -0.3%
- Active inventory
- 468
- Price-to-rent
- 2.8×
Monthly cashflow live
- Estimated rent
- $1,155 medium interval (Pro) →
- Mortgage (P&I)
- −$205
- Tax from tax record
- −$147 /mo · $1,759/yr
- Insurance
- −$16
- HOA
- −$0
- Vacancy / Maint / Mgmt
- −$242
- Net cashflow
- $545
Break-even live
UW: 25.0% down · 7.5% · 30yr · 1.5% tax · 5.0% vac · 8.0% maint · 8.0% mgmt
Financing live
Cash to close
- Down payment
- $9,750
- Closing costs
- $1,170
- Reserves months
- —
- Total cash needed
- —
Loan-product check · same deal, 3 products live
Conventional
25% down · 7.5% · 30yr
- Down + closing
- —
- Monthly P&I
- —
- Monthly cashflow
- —
- DSCR
- —
- Eligible?
- —
Personal DTI + credit; lowest rate.
DSCR
20% down · 8.5% · 30yr
- Down + closing
- —
- Monthly P&I
- —
- Monthly cashflow
- —
- DSCR
- —
- Eligible?
- —
No personal income docs; deal must DSCR.
Hard money
10% down · 12.0% · 12mo
- Down + closing
- —
- Monthly P&I
- —
- Monthly cashflow
- —
- DSCR
- —
- Eligible?
- —
Short-term bridge; refi at stabilization.
Listing history 12 events
-
2026-06-19days on market $39,000 Active 19 DOM
-
2026-06-18days on market $39,000 Active 18 DOM
-
2026-06-17days on market $39,000 Active 17 DOM
-
2026-06-16days on market $39,000 Active 16 DOM
-
2026-06-15days on market $39,000 Active 15 DOM
-
2026-06-14days on market $39,000 Active 13 DOM
-
2026-06-13days on market $39,000 Active 12 DOM
-
2026-06-10days on market $39,000 Active 10 DOM
-
2026-06-09days on market $39,000 Active 9 DOM
-
2026-06-08days on market $39,000 Active 8 DOM
-
2026-06-07remarks 699-char remark
-
2026-06-07$39,000 Active 7 DOM
ⓘ Source: listings_history table (triggers on properties + properties_extension) + one-shot
backfill from property_details.listing_events for pre-trigger history.
Tax reassessment forecast TX · Resets to sale price
- Current annual tax
- $1,759 · $147/mo
- Projected year-2 tax
- $1,759 · $147/mo
- Expected delta
- $0/yr ($0/mo · 0.0%)
ⓘ Screening estimate from a state-policy table — verify with the county assessor before closing.
Nearby sold comps map
Loading sold comps map…
Walkable amenities ~0.75 mi
Loading nearby amenities…
Taxation est. · year 1
- Rental income
- $13,854
- − Mortgage interest
- −$2,185
- − Property taxes
- −$1,759
- − Insurance
- −$195
- − Repairs & maintenance
- −$1,108
- − Management
- −$1,108
- − Depreciation
- −$1,135
- Taxable income
- $6,365
- Est. tax owed @ 24.0%
- −$1,528
- After-tax cash flow
- $5,009/yr
For passive investors: Depreciation is non-cash, so a rental often shows a tax loss while cash-flowing — sheltering income. Rental losses are passive: they offset passive income freely, and up to $25,000/yr can offset ordinary (W-2) income if you actively participate and your MAGI is under $100k (phasing out to $0 by $150k); unused losses carry forward. On sale, claimed depreciation is recaptured at up to 25%, and gains may owe capital-gains tax (a 1031 exchange can defer both). Figures are a year-1 estimate at your 24.0% rate — not tax advice; consult a CPA.
Schools (NCES district)
- District
- Groveton ISD
- NCES district ID
- 4821900
- Math proficiency
- 45% ▼ -2.00%
- Reading proficiency
- 46% ▲ 1.00%
- Median HH income
- $36,375
- Composite
- 37.76/100
- National rank
- #4348
- State rank
- #281 of 826 in TX
Livability — Westwood Shores
- Score
- 62/100
- State rank
- #914
- US rank
- #16347
Category grades
Schools grade is shown separately in the Schools card above.
Census & demographics
- Population (ZIP)
- 10,030
Population outlook (Trinity County) Hauer SSP2
- Today (2025)
- 13,746 people
- By 2030
- 13,333 · -3.0%
- By 2040
- 12,542 · -8.8%
- By 2050
- 11,942 · -13.1%
- By 2075
- 10,871 · -20.9%
- By 2100
- 9,784 · -28.8%
Race, ethnicity, and origin ACS 2023
- Neighborhood character
- Predominantly White (74%)
- Race & ethnicity
- White 74% Hispanic / Latino 12% Black 10% Two or more races 7%
- Hispanic origin (detail)
- Mexican 11%
- Common ancestry
- Lithuanian 3% Serbian 2% Slovak 2%
- Foreign-born
- 4% · Canada
- Languages at home
- 89% English-only · Spanish 9% French/Haitian/Cajun 2%
Political lean MEDSL · Trinity
- 2024 margin
- Solid R (+67.0) · D 16.2% · R 83.2%
- 2008→2024 swing
- -31.3pp toward R · 2008: -35.7pp · 2024: -67.0pp
- All cycles
- 2024: R+67.0 2020: R+61.3 2016: R+59.9 2012: R+46.9 2008: R+35.7
Not yet ingested
- Civics
- —
Market trends
- HPI YoY
- ▼ -0.52%
- Current HPI
- 174.6638
- Rent YoY
- —
- Metro
- —
- State GDP YoY
- ▲ 3.95%
- F500 in state
- 110
Industry mix (Fortune 500 HQ in TX)
| Industry | F500 HQs | Revenue |
|---|---|---|
| Energy | 16 | $1,198B |
|
||
| Technology | 5 | $198B |
|
||
| Engineering / Construction | 4 | $72B |
|
||
| Energy Services | 3 | $60B |
|
||
| Utilities | 3 | $41B |
|
||
| Healthcare | 2 | $330B |
|
||
Price history
+11.7% since first listed5 events — show timeline
- 2026-06-06 Relisted — HARMLS
- 2026-01-07 Pending — HARMLS
- 2026-01-06 Price Changed $39,000 HARMLS
- 2026-01-06 Listing Removed — HARMLS
- 2025-12-29 Listed $34,900 HARMLS
Property tax history
+13.7%/yrLatest (2025): $1,759 · +6.4% YoY. Source: county tax records.
Cash-flow waterfall
monthlySold comps — $/sqft
last 12 mo · ≤1 miLoading sold comps…