 🏗️ New Construction
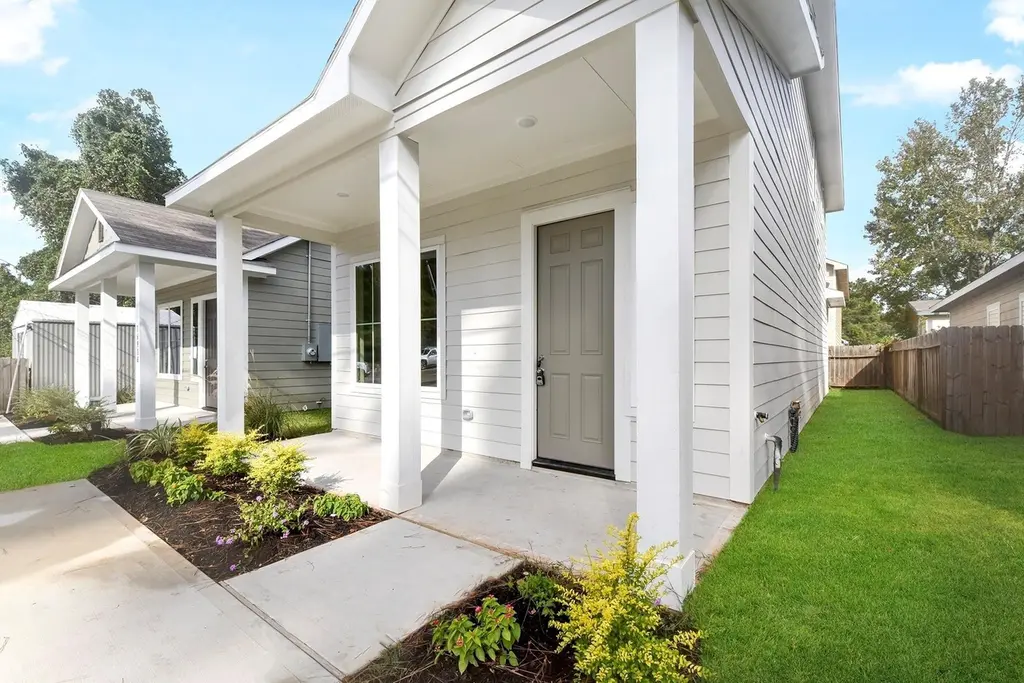
16912 Kempwood · Conroe, TX
Flood risk 1/10 · Minimal
- FEMA flood zone
- X (unshaded)
- Chance of flooding over 30 yrs
- 0.0%
- Est. flood insurance / yr
- $507 – $1,088
Fire risk 5/10 · Moderate
- Est. fire insurance / yr
- $1,222 – $2,270
Heat risk 8/10 · Major
- Hot days now (above 110°F)
- 7 days/yr
- Hot days in 30 yrs
- 24 days/yr
Wind risk 8/10 · Major
- Chance of severe wind over 30 yrs
- 99.0%
Air-quality risk 2/10 · Minimal
- Unhealthy air days now
- 1 days/yr
- Unhealthy air days in 30 yrs
- 1 days/yr
Risk factors via First Street. Map © Google.
Why this score? — see what drove the C+ grade
The composite is a weighted blend of 9 inputs, each scored 0–100. Each bar is that input's sub-score; the figure is the points it added to the 100-point composite (weight × sub-score).
- Cash flow +26.7/30.0
- DSCR +9.2/10.0
- ARV discount +7.5/15.0
- 1% rule +6.3/10.0
- Schools +5.4/10.0
- Livability +3.7/5.0
- Rent growth +2.6/5.0
- Condition / age +2.5/5.0
- Appreciation +0.0/10.0
$167,000
🖨 Deal sheet 📄 Offer letter ✓ Due diligence
Listing remarks
Welcome to this beautifully updated 3-bedroom, 2-bath home featuring modern finishes throughout. The open concept kitchen is a chef’s dream with a large island, sleek countertops, and stainless steel appliances. Contemporary fixtures add a touch of elegance in every room, creating a clean and stylish living space. Enjoy the ease of a built-in sprinkler system to keep your yard green year-round. Conveniently located just minutes from major shopping centers, dining, and entertainment, this home offers the perfect blend of comfort and convenience. Schedule your private tour today this one won’t last long!
Key facts
- Open concept kitchen
- Large island
- 2,256 sq ft lot
Tags
Property features AI
Finance
- HOA & community: Spectrum Association with an annual fee of $384
Exterior
- Utilities: Public water; Public sewer
- Home design: Residential property; New construction (2025)
- Construction: Built by Stonecreek Builders; Cement siding; Slab foundation; Composition roof
- Exterior features: Located in a subdivision; Additional parcel included
Interior
- Bedrooms: 3 total rooms (includes all rooms)
- Bathrooms: 2 full bathrooms
- Heating & cooling: Central heating (electric); Central air conditioning; Gas cooling
- Interior features: Microwave
Neighborhood map
What this means for you Summary
Snapshot
- This is a 3-bed/2.0-bath land listed at $167k.
Deal economics
- At list price, monthly cash flow is $472 ($6k/yr) — positive.
- The deal already cash-flows at list — no discount required.
- Meets the 1% rule at list price ($2k rent vs $167k).
- Recommended offer: $164k (1.5% below list) — sets the bar for market timing.
- Cap rate 9.6% vs local median 3.1% in Conroe — top-decile yield for the area; either an underpriced asset or a hidden risk that comps aren't pricing in. Stress-test before assuming the spread holds.
Location & tenants
- Location reads 74/100 on livability (#169 in TX, #4,447 nationally) — a middle-class / working-renter tenant base. Strengths: cost of living A+, housing A+, amenities B; Watch: commute F, health & safety F.
- Montgomery ISD (rural): math 63% / reading 57% proficiency, ranked #49 of 826 in TX (top 6%) — acceptable for families but not a draw, mixed tenant base, ~2y average lease.
- Zoned schools: Lake Creek H S (math 53% / reading 68%, grade C+, #268 of 1,632 statewide, top 17%, 1,649 students, 23% FRL) — zoned schools at 23% FRL track the district average.
- Market conditions: Rents flat; 2283 active listings in the ZIP; 14 comparable units currently listed for rent nearby; rentals lingering (median 44d on market — plan ~5-8 weeks vacancy on turnover, expect pricing pressure); 79% of comp listings sitting > 30 days — soft ceiling on asking rent; high-income renter base; 13,259 units permitted in Montgomery County in 2024 (1,402 in 5+ unit buildings).
Forward outlook
- Local home prices are declining (-3.0%/yr); year-one equity from $1k of loan paydown is wiped out by about $5k of value loss. Plan a longer hold.
- Montgomery County population projected at +65% by 2050 — long-run rental-demand tailwind backs the buy-and-hold thesis.
Negotiation context
- It's been on market 29 days — a 2% lower offer ($164k) is reasonable based on typical stale-listing flexibility.
- 6 sale attempts since 2y ago with the ask held roughly flat each time — persistent listings suggest the price (not the market) is what's stuck; bring a comps-based counter.
Risks & watch-outs
- Climate carrying-cost: severe wind risk, 99% chance of damaging wind over 30y; moderate wildfire risk; extreme-heat days projected 7→24/yr by 2055 (HVAC capex compounding) — expect insurance premiums to compound above CPI over the hold.
Questions for the listing agent
- What does the HOA fee cover, when was the last increase, and are there any pending special assessments or reserve-fund shortfalls?
- Is there a deadline driving the sale (1031 exchange, divorce, estate, relocation)? That informs how much negotiation room exists.
- Schools are D-rated, which usually means shorter tenancies and higher turnover. Who's the typical renter profile here, and what's been the actual vacancy rate?
- What's the average days-on-market for RENTAL listings here right now (not sales)? A rising rental-DOM trend means longer vacancies and softer asking-rent achievability than the comps imply.
- What's the recent tenant-quality profile in this submarket — average credit score on applications, eviction rate, late-payment / NSF rate, and stable-employment percentage? A property-management company in the area should have these aggregated.
- How much new for-sale + rental construction is in the pipeline within 1–3 miles? Heavy new supply typically softens prices + rents 12–24 months out; constrained supply supports both.
Investment metrics
- 1% rule
- 1.13% ✓
- Cap rate
- 9.56%
- Cash-on-cash
- 11.65%
- DSCR
- 1.52
- GRM
- 7.4
CMA / ARV
- ARV (median comp)
- $173,791
- List price
- $167,000
- Delta
- -3.91%
- Verdict
- FAIR
- Comps
- 20 within 1.0 mi
Projected returns pro-forma
-3.0% appreciation · 0.4% rent growth · sell at horizon
- IRR
- -1.7%
- Equity multiple
- 0.94×
- Total profit
- $-3,108
- Equity at exit
- $25,913
- IRR
- 5.1%
- Equity multiple
- 1.34×
- Total profit
- $16,407
- Equity at exit
- $15,026
Cash invested: $48,662 (down + closing). Projections, not guarantees.
Landlord ↔ Tenant lean methodology
- Overall (STATE)
- 87 Strongly Landlord-Friendly
- State Texas
- 87 Strongly Landlord-Friendly · R+5
- County
- — inherits STATE
- City
- — inherits STATE
ZIP-level market 77316
- Home prices YoY
- -10.7%
- Rents YoY
- 0.4%
- Active inventory
- 2283
- Price-to-rent
- 7.1×
Monthly cashflow live
- Estimated rent
- $1,957 high interval (Pro) →
- Mortgage (P&I)
- −$911
- Tax from tax record
- −$58 /mo · $692/yr
- Insurance
- −$72
- HOA
- −$32
- Vacancy / Maint / Mgmt
- −$411
- Net cashflow
- $472
Break-even live
UW: 25.0% down · 7.5% · 30yr · 1.5% tax · 5.0% vac · 8.0% maint · 8.0% mgmt
Financing live
Cash to close
- Down payment
- $43,448
- Closing costs
- $5,214
- Reserves months
- —
- Total cash needed
- —
Loan-product check · same deal, 3 products live
Conventional
25% down · 7.5% · 30yr
- Down + closing
- —
- Monthly P&I
- —
- Monthly cashflow
- —
- DSCR
- —
- Eligible?
- —
Personal DTI + credit; lowest rate.
DSCR
20% down · 8.5% · 30yr
- Down + closing
- —
- Monthly P&I
- —
- Monthly cashflow
- —
- DSCR
- —
- Eligible?
- —
No personal income docs; deal must DSCR.
Hard money
10% down · 12.0% · 12mo
- Down + closing
- —
- Monthly P&I
- —
- Monthly cashflow
- —
- DSCR
- —
- Eligible?
- —
Short-term bridge; refi at stabilization.
Rent comps 14 comps
| Address | Beds | Baths | Sqft | Rent | $/sqft | DOM | Units | Dist |
|---|---|---|---|---|---|---|---|---|
| 16928 Kempwood Montgomery, TX | 3.0 | 2.0 | 1100 | $1,450 | $1.32 | 43d | 1 | 0.05mi |
| 16967 W Ivanhoe Montgomery, TX | 3.0 | 2.0 | 1012 | $1,350 | $1.33 | 12d | 1 | 0.12mi |
| 16984 W Juneau Montgomery, TX | 3.0 | 3.0 | 1530 | $2,900 | $1.90 | 43d | 1 | 0.13mi |
| 16913 Glenheath Montgomery, TX | 4.0 | 2.5 | 1700 | $1,571 | $0.92 | 43d | 1 | 0.16mi |
| 16915 Balmoral Montgomery, TX | 3.0 | 2.0 | 1200 | $1,200 | $1.00 | 43d | 1 | 0.28mi |
| 1050 S Pine Lake Rd Montgomery, TX | 2.0 | 2.0 | 1052 | $1,845 | $1.75 | 24d | 1 | 0.65mi |
| 15 April Vlg Montgomery, TX | 2.0 | 2.0 | 1218 | $1,650 | $1.35 | 43d | 1 | 0.84mi |
| 275 Pine Terrace Dr Unit 5106C Montgomery, TX | 3.0 | 2.5 | 1773 | $2,820 | $1.59 | 43d | 1 | 0.96mi |
| 298 Capetown Way Unit A Montgomery, TX | 2.0 | 1.5 | 1100 | $1,400 | $1.27 | 43d | 1 | 1.01mi |
| 135 April Point Dr N Montgomery, TX | 3.0 | 3.0 | 1624 | $1,900 | $1.17 | 43d | 1 | 1.10mi |
| 130 April Point Dr N Montgomery, TX | 3.0 | 3.0 | 1680 | $2,250 | $1.34 | 43d | 1 | 1.10mi |
| 124 April Point Dr N Montgomery, TX | 4.0 | 3.0 | 1624 | $2,900 | $1.79 | 43d | 1 | 1.13mi |
| 124 April Point Dr S #124 Montgomery, TX | 2.0 | 1.0 | 1300 | $1,490 | $1.15 | 20d | 1 | 1.25mi |
| 702 Crystal River Rd Montgomery, TX | 4.0 | 2.5 | 1820 | $4,000 | $2.20 | 43d | 1 | 1.28mi |
HOA detail
- Monthly dues
- $32 · $384/yr
Listing history 35 events
-
2026-06-02days on market $167,000 Pending 29 DOM
-
2026-06-01days on market $167,000 Pending 28 DOM
-
2026-05-31days on market $167,000 Pending 27 DOM
-
2026-05-04$167,000 Active 627-char remark
-
2026-04-24historical
-
2026-04-13price $168,900
-
2026-04-06price $169,900
-
2026-03-11price $173,490
-
2026-02-17price $174,490
-
2026-01-20price $177,900
-
2025-11-24price $178,900
-
2025-10-16price $179,900
-
2025-10-05price $180,000
-
2025-08-13$184,990 Active
-
2025-08-02historical
-
2025-05-27price $187,499
-
2025-05-14$189,999 Active
-
2025-05-14historical
-
2025-04-03price $189,999
-
2025-03-29price $190,999
-
2025-03-23price $192,999
-
2025-03-03price $194,999
-
2025-02-01price $199,999
-
2024-12-20price $214,999
-
2024-12-16price $229,999
-
2024-10-31$209,000 Active
-
2024-10-31historical
-
2024-09-29price $209,000
-
2024-09-27price $199,999
-
2024-08-16$224,999 Active
-
2024-03-28soldstatus Sold
-
2024-01-30status Pending
-
2024-01-18status Option Pending
-
2024-01-18status Pending
-
2024-01-12$39,000 Active
ⓘ Source: listings_history table (triggers on properties + properties_extension) + one-shot
backfill from property_details.listing_events for pre-trigger history.
Tax reassessment forecast TX · Resets to sale price
- Current annual tax
- $692 · $58/mo
- Projected year-2 tax
- $3,056 · $255/mo
- Expected delta
- +$2,364/yr (+$197/mo · 341.3%)
ⓘ Screening estimate from a state-policy table — verify with the county assessor before closing.
Climate risk First Street
- Flood 1/10 Low FEMA zone X (unshaded) · 0% chance over 30 yrs
- Wildfire 5/10 Major
- Heat 8/10 Severe 7 d/yr ≥110°F today · 24 d/yr by 30 yrs out
- Wind 8/10 Severe 99% chance of damaging wind over 30 yrs
- Air quality 2/10 Low 1 unhealthy d/yr today · 1 by 30 yrs out
Nearby sold comps map
Loading sold comps map…
Walkable amenities ~0.75 mi
Loading nearby amenities…
Taxation est. · year 1
- Rental income
- $23,483
- − Mortgage interest
- −$9,735
- − Property taxes
- −$692
- − Insurance
- −$869
- − Repairs & maintenance
- −$1,879
- − Management
- −$1,879
- − HOA
- −$384
- − Depreciation
- −$5,056
- Taxable income
- $2,990
- Est. tax owed @ 24.0%
- −$718
- After-tax cash flow
- $4,952/yr
For passive investors: Depreciation is non-cash, so a rental often shows a tax loss while cash-flowing — sheltering income. Rental losses are passive: they offset passive income freely, and up to $25,000/yr can offset ordinary (W-2) income if you actively participate and your MAGI is under $100k (phasing out to $0 by $150k); unused losses carry forward. On sale, claimed depreciation is recaptured at up to 25%, and gains may owe capital-gains tax (a 1031 exchange can defer both). Figures are a year-1 estimate at your 24.0% rate — not tax advice; consult a CPA.
Schools (NCES district)
- District
- Montgomery ISD
- NCES district ID
- 4831260
- Math proficiency
- 63% ▼ -3.00%
- Reading proficiency
- 57% ▼ -3.00%
- Median HH income
- $75,596
- Composite
- 53.55/100
- National rank
- #1445
- State rank
- #49 of 826 in TX
Livability — Conroe
- Score
- 74/100
- State rank
- #169
- US rank
- #4447
Category grades
Schools grade is shown separately in the Schools card above.
Census & demographics
- County
- Montgomery County · 663,713 people
- City population
- 205,417
- Metro
- Houston-The Woodlands-Sugar Land, TX
- Population (ZIP)
- 34,694
- Household income
- $124,055
- Rent vs Own
- Severe rent burden
- 273.0
Population outlook (Montgomery County) Hauer SSP2
- Today (2025)
- 713,896 people
- By 2030
- 805,263 · +12.8%
- By 2040
- 992,708 · +39.1%
- By 2050
- 1,179,590 · +65.2%
- By 2075
- 1,628,084 · +128.1%
- By 2100
- 1,937,880 · +171.5%
Race, ethnicity, and origin ACS 2023
- Neighborhood character
- Predominantly White (80%)
- Race & ethnicity
- White 80% Hispanic / Latino 14% Two or more races 11% Black 1% Asian 1%
- Hispanic origin (detail)
- Mexican 9%
- Common ancestry
- Lithuanian 6% Slovak 3% Romanian 3%
- Foreign-born
- 6% · Canada
- Languages at home
- 90% English-only · Spanish 8%
Political lean MEDSL · Montgomery
- 2024 margin
- Solid R (+45.5) · D 26.8% · R 72.3%
- 2008→2024 swing
- +7.2pp toward D · 2008: -52.7pp · 2024: -45.5pp
- All cycles
- 2024: R+45.5 2020: R+43.8 2016: R+51.4 2012: R+60.7 2008: R+52.7
Not yet ingested
- Civics
- —
Market trends
- HPI YoY
- ▼ -31.44%
- Current HPI
- 262.6973
- Rent YoY
- ▲ 0.40%
- Metro
- Houston-The Woodlands-Sugar Land, TX
- State GDP YoY
- ▲ 3.95%
- F500 in state
- 110
Industry mix (Fortune 500 HQ in TX)
| Industry | F500 HQs | Revenue |
|---|---|---|
| Energy | 16 | $1,198B |
|
||
| Technology | 5 | $198B |
|
||
| Engineering / Construction | 4 | $72B |
|
||
| Energy Services | 3 | $60B |
|
||
| Utilities | 3 | $41B |
|
||
| Healthcare | 2 | $330B |
|
||
Price history
+328.2% since first listed34 events — show timeline
- 2026-06-03 Pending — HARMLS
- 2026-05-21 Pending — HARMLS
- 2026-05-04 Listed $167,000 HARMLS
- 2026-04-24 Listing Removed — HARMLS
- 2026-04-13 Price Changed $168,900 HARMLS
- 2026-04-06 Price Changed $169,900 HARMLS
- 2026-03-11 Price Changed $173,490 HARMLS
- 2026-02-17 Price Changed $174,490 HARMLS
- 2026-01-20 Price Changed $177,900 HARMLS
- 2025-11-24 Price Changed $178,900 HARMLS
- 2025-10-16 Price Changed $179,900 HARMLS
- 2025-10-05 Price Changed $180,000 HARMLS
- 2025-08-13 Listed $184,990 HARMLS
- 2025-08-02 Listing Removed — HARMLS
- 2025-05-27 Price Changed $187,499 HARMLS
- 2025-05-14 Listing Removed — HARMLS
- 2025-05-14 Listed $189,999 HARMLS
- 2025-04-03 Price Changed $189,999 HARMLS
- 2025-03-29 Price Changed $190,999 HARMLS
- 2025-03-23 Price Changed $192,999 HARMLS
- 2025-03-03 Price Changed $194,999 HARMLS
- 2025-02-01 Price Changed $199,999 HARMLS
- 2024-12-20 Price Changed $214,999 HARMLS
- 2024-12-16 Price Changed $229,999 HARMLS
- 2024-10-31 Listing Removed — HARMLS
- 2024-10-31 Listed $209,000 HARMLS
- 2024-09-29 Price Changed $209,000 HARMLS
- 2024-09-27 Price Changed $199,999 HARMLS
- 2024-08-16 Listed $224,999 HARMLS
- 2024-03-28 Sold (MLS) — HARMLS
- 2024-01-30 Pending — HARMLS
- 2024-01-18 Pending — HARMLS
- 2024-01-18 Pending — HARMLS
- 2024-01-12 Listed $39,000 HARMLS
Property tax history
+13.4%/yrLatest (2025): $692 · +57.9% YoY. Source: county tax records.
Cash-flow waterfall
monthlySold comps — $/sqft
last 12 mo · ≤1 miLoading sold comps…