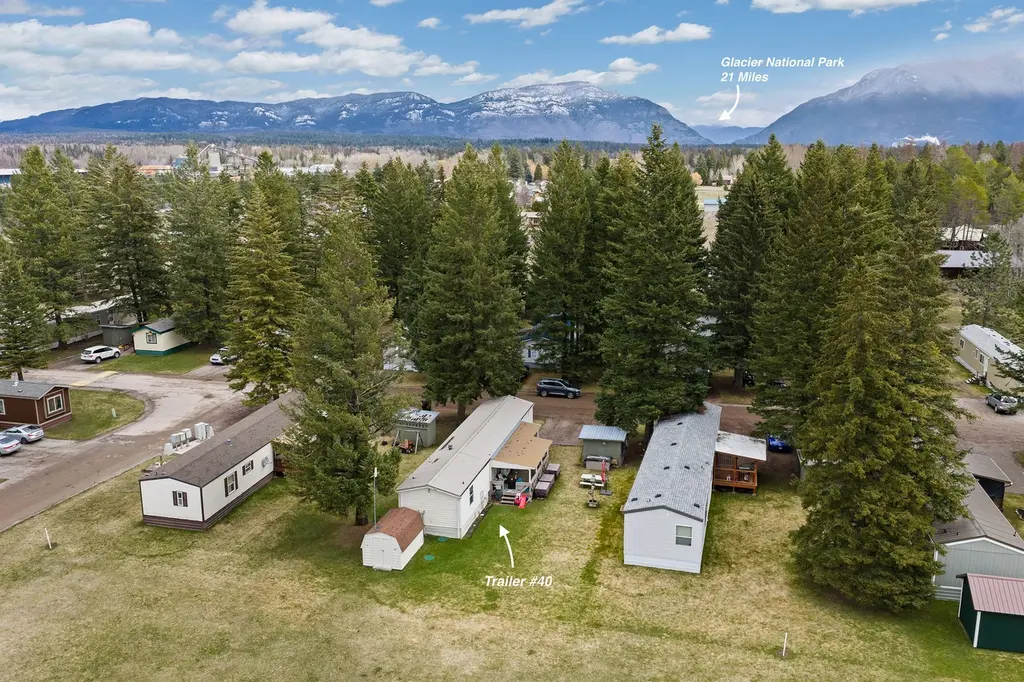
320 Braig Rd #40 · Columbia Falls, MT
Flood risk 5/10 · Moderate
- FEMA flood zone
- X (unshaded)
- Chance of flooding over 30 yrs
- 0.53%
- Est. flood insurance / yr
- $507 – $1,088
Fire risk 5/10 · Moderate
- Est. fire insurance / yr
- $918 – $1,706
Heat risk 2/10 · Minimal
- Hot days now (above 90°F)
- 7 days/yr
- Hot days in 30 yrs
- 15 days/yr
Wind risk 1/10 · Minimal
- Chance of severe wind over 30 yrs
- —
Air-quality risk 9/10 · Severe
- Unhealthy air days now
- 15 days/yr
- Unhealthy air days in 30 yrs
- 18 days/yr
Risk factors via First Street. Map © Google.
Why this score? — see what drove the B grade
The composite is a weighted blend of 9 inputs, each scored 0–100. Each bar is that input's sub-score; the figure is the points it added to the 100-point composite (weight × sub-score).
- Cash flow +30.0/30.0
- 1% rule +10.0/10.0
- DSCR +10.0/10.0
- ARV discount +7.5/15.0
- Condition / age +4.0/5.0
- Livability +3.4/5.0
- Schools +3.0/10.0
- Rent growth +2.5/5.0
- Appreciation +0.0/10.0
$75,000
🖨 Deal sheet (PDF) 📄 Offer letter ✓ Due diligence
Key facts
- Built 1994
- Listed 43 days
Property features AI
Finance
- Other: Taxes listed
- Financial info: Land is leased
- HOA & community: Located in Half Moon Mobile Park
Exterior
- Home design: Manufactured home (single wide); Residential property
- Construction: Foundation: see remarks
- Exterior features: Covered patio/porch; Deck; Front yard; Back yard
Interior
- Kitchen: Dishwasher; Microwave; Range; Refrigerator
- Bathrooms: 2 full bathrooms
- Interior features: Water softener; Covered deck and front porch
- Laundry & utility: Washer hookup; Washer; Dryer
Neighborhood map
What this means for you Summary
Snapshot
- This is a 3-bed/2.0-bath single-family listed at $75k. Condition is rated good.
Deal economics
- At list price, monthly cash flow is $740 ($9k/yr) — positive.
- The deal already cash-flows at list — no discount required.
- Meets the 1% rule at list price ($2k rent vs $75k).
- Recommended offer: $73k (3.0% below list) — sets the bar for market timing.
- Cap rate 18.1% vs local median 1.2% in Columbia Falls — top-decile yield for the area; either an underpriced asset or a hidden risk that comps aren't pricing in. Stress-test before assuming the spread holds.
Location & tenants
- Location reads 68/100 on livability (#96 in MT) — a middle-class / working-renter tenant base. Strengths: cost of living A+, housing A, schools B; Watch: employment D, amenities F, commute F.
- Columbia Falls H S (town): math 25% / reading 40% proficiency, ranked #198 of 339 in MT (top 58%) — families likely to look elsewhere, expect single-tenant / working-renter base with shorter leases.
- Market conditions: 168 active listings in the ZIP; solid renter incomes; 281 units permitted in Flathead County in 2024 (80 in 5+ unit buildings).
Forward outlook
- Local home prices are declining (-3.0%/yr); year-one equity from $519 of loan paydown is wiped out by about $2k of value loss. Plan a longer hold.
- Flathead County population projected at +20% by 2050 — long-run rental-demand tailwind backs the buy-and-hold thesis.
- At projected returns (-3.0% appreciation + 3.0% rent growth), your $21k cash investment doubles in ~3 years — after that, you're playing with house money.
Negotiation context
- It's been on market 44 days — a 3% lower offer ($73k) is reasonable based on typical stale-listing flexibility.
Risks & watch-outs
- Climate carrying-cost: moderate flood risk; moderate wildfire risk — expect insurance premiums to compound above CPI over the hold.
Questions for the listing agent
- It's been on market 44 days. Have you received any prior offers? Is the seller open to a 3% concession, seller financing, or rate buy-down credit?
- Is there a deadline driving the sale (1031 exchange, divorce, estate, relocation)? That informs how much negotiation room exists.
- Schools are B-rated — typically a magnet for longer-tenancy family renters. What's the average tenant stay here, and is there a school-zone premium baked into asking?
- What's the average days-on-market for RENTAL listings here right now (not sales)? A rising rental-DOM trend means longer vacancies and softer asking-rent achievability than the comps imply.
- What's the recent tenant-quality profile in this submarket — average credit score on applications, eviction rate, late-payment / NSF rate, and stable-employment percentage? A property-management company in the area should have these aggregated.
- How much new for-sale + rental construction is in the pipeline within 1–3 miles? Heavy new supply typically softens prices + rents 12–24 months out; constrained supply supports both.
Investment metrics
- 1% rule
- 2.12% ✓
- Cap rate
- 18.13%
- Cash-on-cash
- 42.26%
- DSCR
- 2.88
- GRM
- 3.9
CMA / ARV
No comps found within radius.
Projected returns pro-forma
-3.0% appreciation · 3.0% rent growth · sell at horizon
- IRR
- 39.0%
- Equity multiple
- 2.67×
- Total profit
- $34,971
- Equity at exit
- $11,183
- IRR
- 45.4%
- Equity multiple
- 5.34×
- Total profit
- $91,198
- Equity at exit
- $6,485
Cash invested: $21,000 (down + closing). Projections, not guarantees.
Landlord ↔ Tenant lean methodology
- Overall (STATE)
- 82 Strongly Landlord-Friendly
- State Montana
- 82 Strongly Landlord-Friendly · R+11
- County
- — inherits STATE
- City
- — inherits STATE
ZIP-level market 59912
- Active inventory
- 168
- Price-to-rent
- 3.9×
Monthly cashflow live
- Estimated rent
- $1,592 medium interval (Pro) →
- Mortgage (P&I)
- −$393
- Tax est. 1.5%
- −$94 /mo · $1,125/yr
- Insurance
- −$31
- HOA
- −$0
- Vacancy / Maint / Mgmt
- −$334
- Net cashflow
- $740
Break-even live
Sensitivity live
| Price | -10% $791 | -5% $765 | +0% $740 | +5% $714 | +10% $688 |
|---|---|---|---|---|---|
| Rent | -10% $614 | -5% $677 | +0% $740 | +5% $802 | +10% $865 |
| Rate | -1.0pp $777 | -0.5pp $759 | base $740 | +0.5pp $720 | +1.0pp $700 |
UW: 25.0% down · 7.5% · 30yr · 1.5% tax · 5.0% vac · 8.0% maint · 8.0% mgmt
Financing live
Cash to close
- Down payment
- $18,750
- Closing costs
- $2,250
- Reserves months
- —
- Total cash needed
- —
Loan-product check · same deal, 3 products live
Conventional
25% down · 7.5% · 30yr
- Down + closing
- —
- Monthly P&I
- —
- Monthly cashflow
- —
- DSCR
- —
- Eligible?
- —
Personal DTI + credit; lowest rate.
DSCR
20% down · 8.5% · 30yr
- Down + closing
- —
- Monthly P&I
- —
- Monthly cashflow
- —
- DSCR
- —
- Eligible?
- —
No personal income docs; deal must DSCR.
Hard money
10% down · 12.0% · 12mo
- Down + closing
- —
- Monthly P&I
- —
- Monthly cashflow
- —
- DSCR
- —
- Eligible?
- —
Short-term bridge; refi at stabilization.
Listing history 19 events
-
2026-06-21days on market $75,000 Active 44 DOM
-
2026-06-19pricedays on market $75,000 Active 42 DOM
-
2026-06-18days on market $90,000 Active 41 DOM
-
2026-06-17days on market $90,000 Active 40 DOM
-
2026-06-16days on market $90,000 Active 39 DOM
-
2026-06-15days on market $90,000 Active 38 DOM
-
2026-06-14days on market $90,000 Active 36 DOM
-
2026-06-13days on market $90,000 Active 35 DOM
-
2026-06-10pricedays on market $90,000 Active 33 DOM
-
2026-06-09days on market $99,000 Active 32 DOM
-
2026-06-08days on market $99,000 Active 31 DOM
-
2026-06-07days on market $99,000 Active 30 DOM
-
2026-06-05days on market $99,000 Active 27 DOM
-
2026-06-03days on market $99,000 Active 26 DOM
-
2026-06-02days on market $99,000 Active 25 DOM
-
2026-06-01days on market $99,000 Active 24 DOM
-
2026-05-31days on market $99,000 Active 23 DOM
-
2026-05-30days on market $99,000 Active 22 DOM
-
2026-05-08$104,500 Active
ⓘ Source: listings_history table (triggers on properties + properties_extension) + one-shot
backfill from property_details.listing_events for pre-trigger history.
Climate risk First Street
- Flood 5/10 Major FEMA zone X (unshaded) · 53% chance over 30 yrs
- Wildfire 5/10 Major
- Heat 2/10 Low 7 d/yr ≥90°F today · 15 d/yr by 30 yrs out
- Wind 1/10 Low
- Air quality 9/10 Extreme 15 unhealthy d/yr today · 18 by 30 yrs out
Nearby sold comps map
Loading sold comps map…
Walkable amenities ~0.75 mi
Loading nearby amenities…
Taxation est. · year 1
- Rental income
- $19,106
- − Mortgage interest
- −$4,201
- − Property taxes
- −$1,125
- − Insurance
- −$375
- − Repairs & maintenance
- −$1,528
- − Management
- −$1,528
- − Depreciation
- −$2,182
- Taxable income
- $8,166
- Est. tax owed @ 24.0%
- −$1,960
- After-tax cash flow
- $6,914/yr
For passive investors: Depreciation is non-cash, so a rental often shows a tax loss while cash-flowing — sheltering income. Rental losses are passive: they offset passive income freely, and up to $25,000/yr can offset ordinary (W-2) income if you actively participate and your MAGI is under $100k (phasing out to $0 by $150k); unused losses carry forward. On sale, claimed depreciation is recaptured at up to 25%, and gains may owe capital-gains tax (a 1031 exchange can defer both). Figures are a year-1 estimate at your 24.0% rate — not tax advice; consult a CPA.
Condition & rehab AI · 12 photos
This manufactured home is in good condition with minimal repairs needed. Upgrades to exterior paint, flooring, and appliances would significantly enhance its resale and rental value.
Value-add opportunities
- Both Paint exterior siding — Fresh paint enhances curb appeal and value.
- Both Replace carpet with hardwood flooring — Hardwood flooring is more durable and adds value.
- Both Install new window treatments — New treatments improve aesthetics and energy efficiency.
- Both Upgrade kitchen appliances — Modern appliances increase functionality and appeal.
- Both Add outdoor lighting — Enhances safety and curb appeal at night.
Renovation cost estimate screening
Value-add ROI direction
- Both Paint exterior siding — Fresh paint enhances curb appeal and value. ↑
- Both Replace carpet with hardwood flooring — Hardwood flooring is more durable and adds value. ↑
- Both Install new window treatments — New treatments improve aesthetics and energy efficiency. ↑
- Both Upgrade kitchen appliances — Modern appliances increase functionality and appeal. ↑
- Both Add outdoor lighting — Enhances safety and curb appeal at night. ↑
ⓘ Cost ranges are severity-bucket heuristics (US national rule-of-thumb). Get contractor quotes + a written scope before underwriting a rehab budget.
Schools (NCES district)
- District
- Columbia Falls H S
- NCES district ID
- 3007140
- Math proficiency
- 25% ▼ -5.00%
- Reading proficiency
- 40% ▼ -5.00%
- Median HH income
- $44,266
- Composite
- 30.43/100
- National rank
- #11516
- State rank
- #198 of 339 in MT
Livability — Columbia Falls
- Score
- 68/100
- State rank
- #96
- US rank
- #9792
Category grades
Schools grade is shown separately in the Schools card above.
Census & demographics
- County
- Flathead County · 94,027 people
- City population
- 15,752
- Metro
- Kalispell, MT
- Population (ZIP)
- 15,752
- Household income
- $76,617
- Rent vs Own
- Severe rent burden
- 242.0
Population outlook (Flathead County) Hauer SSP2
- Today (2025)
- 108,002 people
- By 2030
- 113,362 · +5.0%
- By 2040
- 122,245 · +13.2%
- By 2050
- 129,517 · +19.9%
- By 2075
- 146,737 · +35.9%
- By 2100
- 155,045 · +43.6%
Race, ethnicity, and origin ACS 2023
- Neighborhood character
- Predominantly White (93%)
- Race & ethnicity
- White 93% Two or more races 4% Hispanic / Latino 2%
- Common ancestry
- Portuguese 7% Slovak 3% Italian 3%
- Foreign-born
- 2% · Canada
- Languages at home
- 97% English-only · German/W. Germanic 1% Spanish 1% Russian/Polish/Slavic 1%
Political lean MEDSL · Flathead
- 2024 margin
- Solid R (+33.8) · D 31.8% · R 65.5% · Other 2.7%
- 2008→2024 swing
- -12.2pp toward R · 2008: -21.6pp · 2024: -33.8pp
- All cycles
- 2024: R+33.8 2020: R+29.9 2016: R+36.5 2012: R+33.4 2008: R+21.6
Not yet ingested
- Civics
- —
Market trends
- HPI YoY
- ▼ -219.09%
- Current HPI
- 252.1381
- Rent YoY
- —
- Metro
- Kalispell, MT
- State GDP YoY
- ▲ 3.41%
- F500 in state
- 2
Industry mix (Fortune 500 HQ in MT)
| Industry | F500 HQs | Revenue |
|---|---|---|
| Technology / Analytics | 1 | $2B |
|
||
Price history
1 event — show timeline
- 2026-05-08 Listed $104,500 MRMLS
Cash-flow waterfall
monthlySold comps — $/sqft
last 12 mo · ≤1 miLoading sold comps…