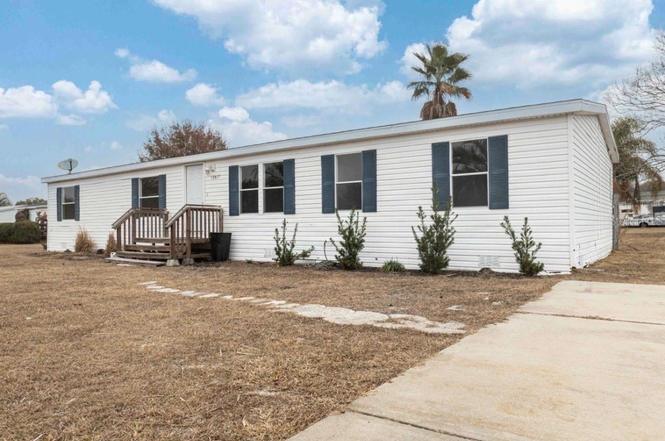
13877 County Road 109f · The Villages, FL
Flood risk 4/10 · Minor
- FEMA flood zone
- X (unshaded)
- Chance of flooding over 30 yrs
- 0.22%
- Est. flood insurance / yr
- $507 – $1,088
Fire risk 4/10 · Minor
- Est. fire insurance / yr
- $947 – $1,759
Heat risk 9/10 · Severe
- Hot days now (above 109°F)
- 7 days/yr
- Hot days in 30 yrs
- 22 days/yr
Wind risk 9/10 · Severe
- Chance of severe wind over 30 yrs
- 99.0%
Air-quality risk 3/10 · Minor
- Unhealthy air days now
- 2 days/yr
- Unhealthy air days in 30 yrs
- 2 days/yr
Risk factors via First Street. Map © Google.
Why this score? — see what drove the C+ grade
The composite is a weighted blend of 9 inputs, each scored 0–100. Each bar is that input's sub-score; the figure is the points it added to the 100-point composite (weight × sub-score).
- Cash flow +23.7/30.0
- ARV discount +13.1/15.0
- DSCR +7.6/10.0
- 1% rule +5.2/10.0
- Schools +5.2/10.0
- Rent growth +3.5/5.0
- Livability +3.5/5.0
- Condition / age +2.5/5.0
- Appreciation +0.0/10.0
$236,000
🖨 Deal sheet 📄 Offer letter ✓ Due diligence
Listing remarks MLS
BEAUTIFUL 4/2 POOL HOME
Key facts
- Remodeled
- Split floor plan
- No hoa fees
Tags
Property features AI
Finance
- Other: Property type: Residential; Property subtype: Manufactured Home; Total acreage: Between 1/2 and less than 1 acre; Lot is cleared and on a paved road; Living area approximately 1,960 square feet; Unfurnished; No CDD; not homestead; One septic system; Direction faces: East
Exterior
- Utilities: Public water; Septic tank; Electricity connected; Water connected; Sewer connected; Cable available; Underground utilities
- Home design: Manufactured double-wide home; One story; East-facing entry
- Construction: Vinyl siding; Shingle roof; Crawlspace foundation; Built as a manufactured home
- Exterior features: Private mailbox; Storage
Interior
- Kitchen: Built-in oven; Dishwasher; Microwave; Refrigerator; Freezer
- Bedrooms: 4 bedrooms
- Flooring: Vinyl
- Bathrooms: 2 full bathrooms
- Heating & cooling: Central heating; Central air conditioning
- Interior features: Ceiling fans; High ceilings; Split bedroom layout; Walk-in closets; Formal dining room separate; Inside utility
- Laundry & utility: Washer and dryer inside
Neighborhood map
What this means for you Summary
Snapshot
- This is a 4-bed/2.0-bath manufactured listed at $236k.
Deal economics
- At list price, monthly cash flow is $451 ($5k/yr) — positive.
- The deal already cash-flows at list — no discount required.
- Meets the 1% rule at list price ($2k rent vs $236k).
- Recommended offer: $215k (9.0% below list) — sets the bar for market timing.
- Cap rate 8.6% vs local median 5.0% in The Villages — top-decile yield for the area; either an underpriced asset or a hidden risk that comps aren't pricing in. Stress-test before assuming the spread holds.
Location & tenants
- Location reads 70/100 on livability (#431 in FL) — a middle-class / working-renter tenant base. Strengths: schools A+, crime A+, housing A; Watch: amenities F, commute F, health & safety F.
- Sumter (rural): math 61% / reading 61% proficiency, ranked #11 of 73 in FL (top 15%) — acceptable for families but not a draw, mixed tenant base, ~2y average lease.
- Market conditions: Rents rising fast (+4.0%/yr); 576 active listings in the ZIP; 11 comparable units currently listed for rent nearby; rentals at typical pace (median 21d on market — plan ~3-4 weeks tenant-placement turnaround); 3,961 units permitted in Sumter County in 2024 (248 in 5+ unit buildings).
- At $2,396/mo this rent would consume 49% of the median local household income ($59k/yr) (locally 1047% of renters already pay >50% of income on rent) — very limited rent-growth headroom before tenants either downsize or default.
Forward outlook
- Local home prices are declining (-3.0%/yr); year-one equity from $2k of loan paydown is wiped out by about $7k of value loss. Plan a longer hold.
- Sumter County population projected at +45% by 2050 — long-run rental-demand tailwind backs the buy-and-hold thesis.
Negotiation context
- It's been on market 104 days — a 9% lower offer ($215k) is reasonable based on typical stale-listing flexibility.
- 4 sale attempts since 21y ago with the ask held roughly flat each time — persistent listings suggest the price (not the market) is what's stuck; bring a comps-based counter.
- Current owner paid $100k; list at $236k implies a 136% gain — meaningful room to come down on a strong offer.
Risks & watch-outs
- Climate carrying-cost: severe wind risk, 99% chance of damaging wind over 30y; extreme-heat days projected 7→22/yr by 2055 (HVAC capex compounding) — expect insurance premiums to compound above CPI over the hold.
Questions for the listing agent
- It's been on market 104 days. Have you received any prior offers? Is the seller open to a 9% concession, seller financing, or rate buy-down credit?
- Why hasn't it sold? Are there any deal-killer items the seller is aware of (foundation, flood, title, zoning, code violations)?
- Is there a deadline driving the sale (1031 exchange, divorce, estate, relocation)? That informs how much negotiation room exists.
- Schools are A-rated — typically a magnet for longer-tenancy family renters. What's the average tenant stay here, and is there a school-zone premium baked into asking?
- What's the average days-on-market for RENTAL listings here right now (not sales)? A rising rental-DOM trend means longer vacancies and softer asking-rent achievability than the comps imply.
- What's the recent tenant-quality profile in this submarket — average credit score on applications, eviction rate, late-payment / NSF rate, and stable-employment percentage? A property-management company in the area should have these aggregated.
- How much new for-sale + rental construction is in the pipeline within 1–3 miles? Heavy new supply typically softens prices + rents 12–24 months out; constrained supply supports both.
Investment metrics
- 1% rule
- 1.02% ✓
- Cap rate
- 8.59%
- Cash-on-cash
- 8.19%
- DSCR
- 1.36
- GRM
- 8.2
CMA / ARV
- ARV (on-the-fly)
- $269,412
- Comps found
- 4
Show comp detail 4 sales within ~0.75 mi
| Address | Dist | Beds/Ba | Sqft | Sold | Price | $/sf | Match |
|---|---|---|---|---|---|---|---|
| 7602 County Road 109g | 0.40mi | 3/2.0 (-1) | 1,716 (0%) | 3mo | $209,000 | $122 | 74 |
| 8442 County Road 109 | 0.45mi | 3/2.0 (-1) | 1,664 (-3%) | 1mo | $297,000 | $178 | 68 |
| 7823 County Road 109 | 0.21mi | 4/2.0 | 1,932 (+13%) | 7mo | $302,500 | $157 | 63 |
| 13530 County Road 109e-1 | 0.35mi | 3/2.0 (-1) | 1,560 (-9%) | 6mo | $110,000 | $71 | 58 |
Match score weights: distance 35% · size 25% · config 20% · recency 20%. Top-matched comps best support the ARV.
Projected returns pro-forma
-3.0% appreciation · 4.03% rent growth · sell at horizon
- IRR
- -2.8%
- Equity multiple
- 0.89×
- Total profit
- $-7,076
- Equity at exit
- $35,188
- IRR
- 7.9%
- Equity multiple
- 1.62×
- Total profit
- $41,028
- Equity at exit
- $20,405
Cash invested: $66,080 (down + closing). Projections, not guarantees.
Landlord ↔ Tenant lean methodology
- Overall (STATE)
- 87 Strongly Landlord-Friendly
- State Florida
- 87 Strongly Landlord-Friendly · R+3
- County
- — inherits STATE
- City
- — inherits STATE
ZIP-level market 32159
- Home prices YoY
- -16.0%
- Rents YoY
- 4.0%
- Active inventory
- 576
- Price-to-rent
- 8.2×
Monthly cashflow live
- Estimated rent
- $2,396 high interval (Pro) →
- Mortgage (P&I)
- −$1,238
- Tax from tax record
- −$106 /mo · $1,269/yr
- Insurance
- −$98
- HOA
- −$0
- Vacancy / Maint / Mgmt
- −$503
- Net cashflow
- $451
Break-even live
UW: 25.0% down · 7.5% · 30yr · 1.5% tax · 5.0% vac · 8.0% maint · 8.0% mgmt
Financing live
Cash to close
- Down payment
- $59,000
- Closing costs
- $7,080
- Reserves months
- —
- Total cash needed
- —
Loan-product check · same deal, 3 products live
Conventional
25% down · 7.5% · 30yr
- Down + closing
- —
- Monthly P&I
- —
- Monthly cashflow
- —
- DSCR
- —
- Eligible?
- —
Personal DTI + credit; lowest rate.
DSCR
20% down · 8.5% · 30yr
- Down + closing
- —
- Monthly P&I
- —
- Monthly cashflow
- —
- DSCR
- —
- Eligible?
- —
No personal income docs; deal must DSCR.
Hard money
10% down · 12.0% · 12mo
- Down + closing
- —
- Monthly P&I
- —
- Monthly cashflow
- —
- DSCR
- —
- Eligible?
- —
Short-term bridge; refi at stabilization.
Rent comps 11 comps
| Address | Beds | Baths | Sqft | Rent | $/sqft | DOM | Units | Dist |
|---|---|---|---|---|---|---|---|---|
| 13904 County Road 109D Lady Lake, FL | 3.0 | 2.0 | 1568 | $1,550 | $0.99 | 21d | 1 | 0.22mi |
| 1505 Doria Ln Lady Lake, FL | 3.0 | 2.0 | 2048 | $3,500 | $1.71 | 21d | 1 | 0.47mi |
| 1377 Camero Dr Lady Lake, FL | 3.0 | 2.0 | 1462 | $5,500 | $3.76 | 21d | 1 | 0.50mi |
| 17817 SE 115th Ct Unit 1 Summerfield, FL | 3.0 | 2.0 | 2144 | $2,300 | $1.07 | 21d | 1 | 0.74mi |
| 17951 SE 115th Cir Summerfield, FL | 3.0 | 2.0 | 1829 | $2,100 | $1.15 | 14d | 1 | 0.91mi |
| 13740 Lead LN The Villages, FL | 1.0–3.0 | 1.0–2.0 | 1029 | $2,150 | $2.09 | 21d | 38 | 0.91mi |
| 13765 NE 136th Loop Lady Lake, FL | 1.0–3.0 | 1.0–2.0 | 1078 | $1,991 | $1.85 | 21d | 36 | 0.94mi |
| 17408 SE 121st Cir Summerfield, FL | 3.0 | 2.0 | 1733 | $1,850 | $1.07 | 21d | 1 | 1.29mi |
| 2126 Sansores St Lady Lake, FL | 3.0 | 2.0 | 1748 | $3,700 | $2.12 | 21d | 1 | 1.35mi |
| 17472 SE 121st Cir Summerfield, FL | 3.0 | 2.0 | 1330 | $1,950 | $1.47 | 14d | 1 | 1.42mi |
| 2137 Gerardo Ave Lady Lake, FL | 3.0 | 2.0 | 1940 | $5,600 | $2.89 | 21d | 1 | 1.48mi |
Listing history 11 events
-
2026-03-05price $236,000
-
2026-02-14$239,000 Active
-
2025-09-03historical
-
2025-06-03price $244,999
-
2025-03-03$249,999 Active
-
2005-11-29soldstatus $100,000 23-char remark
Show marketing remark (23 chars)
BEAUTIFUL 4/2 POOL HOME
-
2005-11-25$124,900 23-char remark
Show marketing remark (23 chars)
BEAUTIFUL 4/2 POOL HOME
-
2005-10-03soldstatus $100,000
-
2005-09-22soldstatus $100,000
-
2005-02-28$118,900
-
1983-06-01soldstatus $532,000
ⓘ Source: listings_history table (triggers on properties + properties_extension) + one-shot
backfill from property_details.listing_events for pre-trigger history.
Tax reassessment forecast FL · Resets to sale price
- Current annual tax
- $1,269 · $106/mo
- Projected year-2 tax
- $1,959 · $163/mo
- Expected delta
- +$690/yr (+$58/mo · 54.4%)
ⓘ Screening estimate from a state-policy table — verify with the county assessor before closing.
Climate risk First Street
- Flood 4/10 Moderate FEMA zone X (unshaded) · 22% chance over 30 yrs
- Wildfire 4/10 Moderate
- Heat 9/10 Extreme 7 d/yr ≥109°F today · 22 d/yr by 30 yrs out
- Wind 9/10 Extreme 99% chance of damaging wind over 30 yrs
- Air quality 3/10 Moderate 2 unhealthy d/yr today · 2 by 30 yrs out
Nearby sold comps map
Loading sold comps map…
Walkable amenities ~0.75 mi
Loading nearby amenities…
Taxation est. · year 1
- Rental income
- $28,752
- − Mortgage interest
- −$13,220
- − Property taxes
- −$1,269
- − Insurance
- −$1,180
- − Repairs & maintenance
- −$2,300
- − Management
- −$2,300
- − Depreciation
- −$6,865
- Taxable income
- $1,618
- Est. tax owed @ 24.0%
- −$388
- After-tax cash flow
- $5,026/yr
For passive investors: Depreciation is non-cash, so a rental often shows a tax loss while cash-flowing — sheltering income. Rental losses are passive: they offset passive income freely, and up to $25,000/yr can offset ordinary (W-2) income if you actively participate and your MAGI is under $100k (phasing out to $0 by $150k); unused losses carry forward. On sale, claimed depreciation is recaptured at up to 25%, and gains may owe capital-gains tax (a 1031 exchange can defer both). Figures are a year-1 estimate at your 24.0% rate — not tax advice; consult a CPA.
Schools (NCES district)
- District
- Sumter
- NCES district ID
- 1201800
- Math proficiency
- 61% ▼ -4.00%
- Reading proficiency
- 61% ▼ -2.00%
- Median HH income
- $48,240
- Composite
- 51.74/100
- National rank
- #1682
- State rank
- #11 of 73 in FL
Livability — The Villages
- Score
- 70/100
- State rank
- #431
- US rank
- #7363
Category grades
Schools grade is shown separately in the Schools card above.
Census & demographics
- County
- Lake County · 364,602 people
- City population
- 83,973
- Metro
- Orlando-Kissimmee-Sanford, FL
- Population (ZIP)
- 32,107
- Household income
- $58,518
- Rent vs Own
- Severe rent burden
- 1047.0
Population outlook (Sumter County) Hauer SSP2
- Today (2025)
- 161,172 people
- By 2030
- 180,083 · +11.7%
- By 2040
- 209,892 · +30.2%
- By 2050
- 234,186 · +45.3%
- By 2075
- 284,602 · +76.6%
- By 2100
- 317,039 · +96.7%
Race, ethnicity, and origin ACS 2023
- Neighborhood character
- Predominantly White (86%)
- Race & ethnicity
- White 86% Hispanic / Latino 6% Two or more races 5% Black 4% Asian 1%
- Hispanic origin (detail)
- Puerto Rican 3%
- Common ancestry
- Romanian 4% Lithuanian 3% Slovak 3%
- Foreign-born
- 5% · Canada, Jamaica
- Languages at home
- 93% English-only · Spanish 4% German/W. Germanic 1% Other Indo-European 1%
Political lean MEDSL · Sumter
- 2024 margin
- Solid R (+37.6) · D 30.9% · R 68.6%
- 2008→2024 swing
- -10.6pp toward R · 2008: -27.0pp · 2024: -37.6pp
- All cycles
- 2024: R+37.6 2020: R+36.1 2016: R+39.2 2012: R+34.9 2008: R+27.0
Not yet ingested
- Civics
- —
Market trends
- HPI YoY
- ▼ -45.24%
- Current HPI
- 237.6208
- Rent YoY
- ▲ 4.03%
- Metro
- Orlando-Kissimmee-Sanford, FL
- State GDP YoY
- ▲ 3.28%
- F500 in state
- 36
Industry mix (Fortune 500 HQ in FL)
| Industry | F500 HQs | Revenue |
|---|---|---|
| Industrial Technology | 2 | $29B |
|
||
| Insurance | 2 | $17B |
|
||
| Retail | 1 | $60B |
|
||
| Technology Distribution | 1 | $58B |
|
||
| Homebuilding | 1 | $35B |
|
||
| Technology Manufacturing | 1 | $35B |
|
||
Price history
-55.6% since first listed11 events — show timeline
- 2026-03-05 Price Changed $236,000 Stellar MLS as Distributed by MLS Grid
- 2026-02-14 Listed $239,000 Stellar MLS as Distributed by MLS Grid
- 2025-09-03 Listing Removed — Stellar MLS as Distributed by MLS Grid
- 2025-06-03 Price Changed $244,999 Stellar MLS as Distributed by MLS Grid
- 2025-03-03 Listed $249,999 Stellar MLS as Distributed by MLS Grid
- 2005-11-29 Sold (MLS) $100,000 Stellar MLS as Distributed by MLS Grid
- 2005-11-25 Listed $124,900 Stellar MLS as Distributed by MLS Grid
- 2005-10-03 Sold (Public Records) $100,000 Public Records
- 2005-09-22 Sold (MLS) $100,000 Stellar MLS as Distributed by MLS Grid
- 2005-02-28 Listed $118,900 Stellar MLS as Distributed by MLS Grid
- 1983-06-01 Sold (Public Records) $532,000 Public Records
Property tax history
+0.6%/yrLatest (2025): $1,269 · -1.0% YoY. Source: county tax records.
Cash-flow waterfall
monthlySold comps — $/sqft
last 12 mo · ≤1 miLoading sold comps…