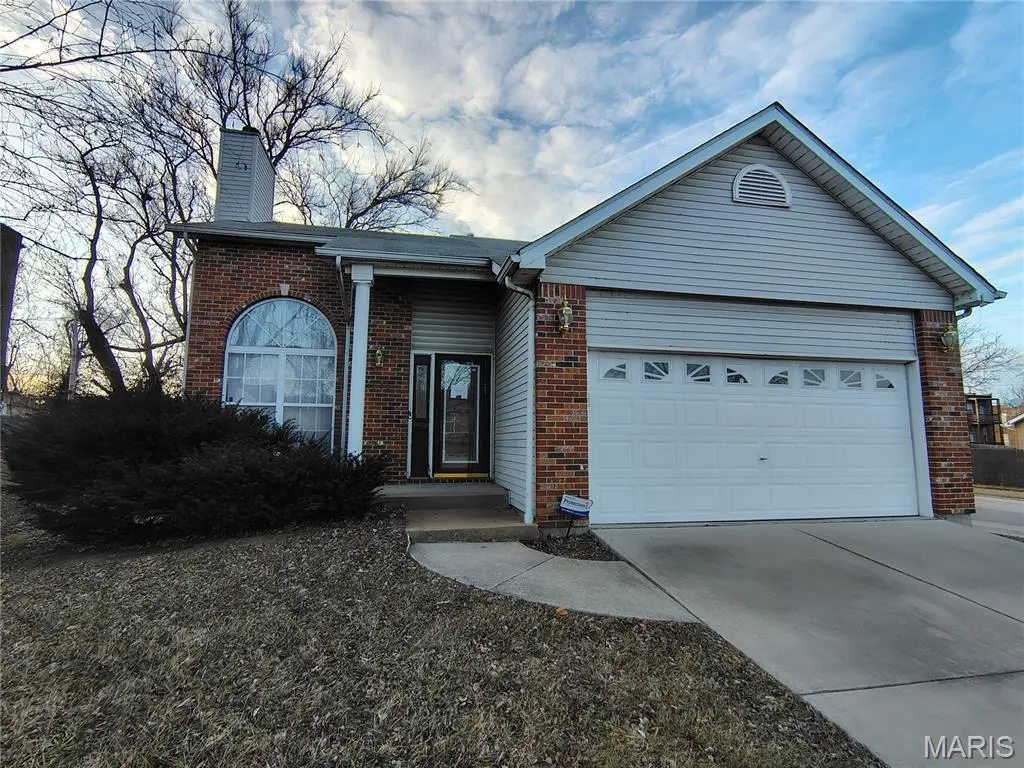
1543 Hogan St · St. Louis, MO
Flood risk 1/10 · Minimal
- FEMA flood zone
- X (unshaded)
- Chance of flooding over 30 yrs
- 0.0%
- Est. flood insurance / yr
- $473 – $860
Fire risk 1/10 · Minimal
- Est. fire insurance / yr
- $1,054 – $1,958
Heat risk 5/10 · Moderate
- Hot days now (above 109°F)
- 7 days/yr
- Hot days in 30 yrs
- 21 days/yr
Wind risk 2/10 · Minimal
- Chance of severe wind over 30 yrs
- 1.0%
Air-quality risk 3/10 · Minor
- Unhealthy air days now
- 3 days/yr
- Unhealthy air days in 30 yrs
- 4 days/yr
Risk factors via First Street. Map © Google.
Why this score? — see what drove the B- grade
The composite is a weighted blend of 9 inputs, each scored 0–100. Each bar is that input's sub-score; the figure is the points it added to the 100-point composite (weight × sub-score).
- Cash flow +23.7/30.0
- ARV discount +14.2/15.0
- DSCR +7.6/10.0
- Appreciation +6.0/10.0
- 1% rule +5.6/10.0
- Rent growth +2.5/5.0
- Livability +2.5/5.0
- Condition / age +2.5/5.0
- Schools +1.2/10.0
$154,900
🖨 Deal sheet 📄 Offer letter ✓ Due diligence
Listing remarks MLS
Opportunity awaits with this 3 bed, 2 bath home on a corner lot in a great location. This home has a fenced backyard and some custom landscaping. The main floor has a large bedroom, living room, kitchen, full bathroom and mud room. The upstairs has 2 dormer style bedrooms with closets. Large basement. This property is now active in an online auction. All offers must be submitted through the property's listing page on WWW.AUCTION.COM. The sale will be subject to a 5% buyer's premium pursuant to the Auction Terms and Conditions (minimums may apply). All auction bids will be processed subject to seller approval. If your offer is accepted, you agree to an offer submission technology fee of $212.00. The fee will be collected & disbursed by the settlement agent at closing. NO SHOWINGS-- PROPERTY IS OCCUPIED-- NO SHOWINGS ALLOWED. Do Not Trespass. Inspections are not available - sold as-is. No for sale sign. Contact with occupants is prohibited. **Under FinCEN s new RRE Rule, transfers will be subject to reporting when buyers use entities or trusts to take title to residential real estate, when the transaction is all cash, privately financed or HELOC**
Key facts
- Full bathroom
- Large bedroom
- Custom landscaping
Tags
Neighborhood map
What this means for you Summary
Snapshot
- This is a 3-bed/2.5-bath single-family listed at $155k.
Deal economics
- At list price, monthly cash flow is $295 ($4k/yr) — positive.
- The deal already cash-flows at list — no discount required.
- Meets the 1% rule at list price ($2k rent vs $155k).
- Recommended offer: $146k (6.0% below list) — sets the bar for market timing.
- Cap rate 8.6% vs local median 5.0% in St. Louis — top-decile yield for the area; either an underpriced asset or a hidden risk that comps aren't pricing in. Stress-test before assuming the spread holds.
Location & tenants
- Location reads: area grade B — affects rentability + tenant quality, not the cash-flow math above.
- St. Louis City (urban): math 10% / reading 18% proficiency, ranked #312 of 324 in MO (top 96%) — low school quality limits family demand, transient renter base, plan for 1-2y turnover; 80% free/reduced lunch — lower-income household profile, screen leases tightly.
- Market conditions: 15 active listings in the ZIP; 40 comparable units currently listed for rent nearby; rentals leasing fast (median 4d on market — plan ~1-2 weeks tenant-placement turnaround); 294 units permitted in St. Louis city in 2024 (227 in 5+ unit buildings).
Forward outlook
- In year one you build about $4k of equity ($1k loan paydown + $3k appreciation (1.9% local appreciation)).
- St. Louis County population projected to shrink 6% by 2050 — rents likely to lag national; underwrite the cash flow, not the appreciation.
- At projected returns (1.9% appreciation + 3.0% rent growth), your $43k cash investment doubles in ~5 years — after that, you're playing with house money.
- By year 8, paydown + projected appreciation supports a ~$30k cash-out refi (75% LTV) — recoverable capital for the next deal without selling this one.
Negotiation context
- It's been on market 65 days — a 6% lower offer ($146k) is reasonable based on typical stale-listing flexibility.
- Current owner paid $125k; 24% above their basis — modest negotiation headroom, anchor on the comps not their cost.
Risks & watch-outs
- Climate carrying-cost: extreme-heat days projected 7→21/yr by 2055 (HVAC capex compounding) — expect insurance premiums to compound above CPI over the hold.
Questions for the listing agent
- It's been on market 65 days. Have you received any prior offers? Is the seller open to a 6% concession, seller financing, or rate buy-down credit?
- Why hasn't it sold? Are there any deal-killer items the seller is aware of (foundation, flood, title, zoning, code violations)?
- Is there a deadline driving the sale (1031 exchange, divorce, estate, relocation)? That informs how much negotiation room exists.
- What's the average days-on-market for RENTAL listings here right now (not sales)? A rising rental-DOM trend means longer vacancies and softer asking-rent achievability than the comps imply.
- What's the recent tenant-quality profile in this submarket — average credit score on applications, eviction rate, late-payment / NSF rate, and stable-employment percentage? A property-management company in the area should have these aggregated.
- How much new for-sale + rental construction is in the pipeline within 1–3 miles? Heavy new supply typically softens prices + rents 12–24 months out; constrained supply supports both.
Investment metrics
- 1% rule
- 1.06% ✓
- Cap rate
- 8.58%
- Cash-on-cash
- 8.16%
- DSCR
- 1.36
- GRM
- 7.9
CMA / ARV
- ARV (median comp)
- $181,987
- List price
- $154,900
- Delta
- -14.88%
- Verdict
- UNDERPRICED
- Comps
- 20 within 1.0 mi
Projected returns pro-forma
1.91% appreciation · 3.0% rent growth · sell at horizon
- IRR
- 12.3%
- Equity multiple
- 1.66×
- Total profit
- $28,653
- Equity at exit
- $60,317
- IRR
- 15.2%
- Equity multiple
- 3.01×
- Total profit
- $87,094
- Equity at exit
- $86,263
Cash invested: $43,372 (down + closing). Projections, not guarantees.
Landlord ↔ Tenant lean methodology
- Overall (STATE)
- 81 Strongly Landlord-Friendly
- State Missouri
- 81 Strongly Landlord-Friendly · R+10
- County
- — inherits STATE
- City
- — inherits STATE
ZIP-level market 63106
- Home prices YoY
- 1.4%
- Active inventory
- 15
- Price-to-rent
- 7.9×
Monthly cashflow live
- Estimated rent
- $1,640 high interval (Pro) →
- Mortgage (P&I)
- −$812
- Tax from tax record
- −$124 /mo · $1,486/yr
- Insurance
- −$65
- HOA
- −$0
- Vacancy / Maint / Mgmt
- −$344
- Net cashflow
- $295
Break-even live
UW: 25.0% down · 7.5% · 30yr · 1.5% tax · 5.0% vac · 8.0% maint · 8.0% mgmt
Financing live
Cash to close
- Down payment
- $38,725
- Closing costs
- $4,647
- Reserves months
- —
- Total cash needed
- —
Loan-product check · same deal, 3 products live
Conventional
25% down · 7.5% · 30yr
- Down + closing
- —
- Monthly P&I
- —
- Monthly cashflow
- —
- DSCR
- —
- Eligible?
- —
Personal DTI + credit; lowest rate.
DSCR
20% down · 8.5% · 30yr
- Down + closing
- —
- Monthly P&I
- —
- Monthly cashflow
- —
- DSCR
- —
- Eligible?
- —
No personal income docs; deal must DSCR.
Hard money
10% down · 12.0% · 12mo
- Down + closing
- —
- Monthly P&I
- —
- Monthly cashflow
- —
- DSCR
- —
- Eligible?
- —
Short-term bridge; refi at stabilization.
Rent comps 40 comps
| Address | Beds | Baths | Sqft | Rent | $/sqft | DOM | Units | Dist |
|---|---|---|---|---|---|---|---|---|
| 1115 Carr St St. Louis, MO | 1.0–2.0 | 1.0 | 747 | $1,123 | $1.50 | 4d | 13 | 0.67mi |
| 2239 University St Saint Louis, MO | 3.0 | 1.5 | 1116 | $1,295 | $1.16 | 11d | 1 | 0.70mi |
| 1635 Washington Ave Saint Louis, MO | 1.0–2.0 | 1.0 | 1135 | $1,495 | $1.32 | 2d | 4 | 0.75mi |
| 715 N 21st St St. Louis, MO | 1.0–2.0 | 1.0–2.0 | 900 | $1,355 | $1.51 | 23d | 1 | 0.75mi |
| 1901 Washington Ave Saint Louis, MO | 1.0–2.0 | 1.0–2.0 | 1076 | $1,500 | $1.39 | 4d | 38 | 0.75mi |
| 1531 Washington Ave St. Louis, MO | 1.0–2.0 | 1.0 | 656 | $1,609 | $2.45 | 1d | 5 | 0.76mi |
| 1300 Convention Plz Saint Louis, MO | 2.0 | 1.0 | 877 | $1,350 | $1.54 | 43d | 1 | 0.77mi |
| 1706 Washington Ave St. Louis, MO | 1.0–2.0 | 1.0–2.0 | 997 | $1,761 | $1.77 | 1d | 10 | 0.78mi |
| 1800 Washington Ave Saint Louis, MO | 1.0–2.0 | 1.0–2.0 | 927 | $1,645 | $1.77 | 43d | 13 | 0.78mi |
| 2034 Lucas Ave St. Louis, MO | 1.0–2.0 | 1.0 | 1080 | $1,525 | $1.41 | 43d | 1 | 0.78mi |
| 1900 Washington Ave Saint Louis, MO | 1.0–2.0 | 1.0–2.0 | 960 | $1,650 | $1.72 | 1d | 12 | 0.79mi |
| 2206 Lucas Ave St. Louis, MO | 1.0–2.0 | 1.0–2.0 | 1047 | $1,900 | $1.81 | 1d | 20 | 0.81mi |
| 1204 N 8th St St. Louis, MO | 1.0–3.0 | 1.0 | 740 | $1,062 | $1.44 | 1d | 19 | 0.81mi |
| 1815 Locust St Saint Louis, MO | 1.0–2.0 | 1.0–2.0 | 983 | $1,543 | $1.57 | 43d | 7 | 0.81mi |
| 1307 Washington Ave St. Louis, MO | 1.0–2.0 | 1.0 | 1261 | $1,485 | $1.18 | 7d | 17 | 0.81mi |
| 1133 Washington Ave St. Louis, MO | 2.0 | 1.0–2.0 | 637 | $1,292 | $2.03 | 43d | 1 | 0.87mi |
| 1717 Olive St Saint Louis, MO | 2.0 | 1.0–2.0 | 957 | $2,982 | $3.12 | 1d | 64 | 0.89mi |
| 2217 Locust St Saint Louis, MO | 2.0 | 2.0 | 830 | $1,475 | $1.78 | 43d | 1 | 0.89mi |
| 416 N 23rd St St. Louis, MO | 1.0–2.0 | 1.0 | 780 | $1,775 | $2.28 | 4d | 23 | 0.89mi |
| 2605-2637 Washington Ave St. Louis, MO | 1.0–2.0 | 1.0–2.0 | 775 | $1,645 | $2.12 | 11d | 7 | 0.92mi |
| 2200 Locust St Saint Louis, MO | 1.0–2.0 | 1.0–1.5 | 862 | $1,695 | $1.97 | 3d | 6 | 0.92mi |
| 1110 Washington Ave Saint Louis, MO | 1.0–2.0 | 1.0–2.0 | 1006 | $1,426 | $1.42 | 2d | 19 | 0.92mi |
| 2323 Locust St Saint Louis, MO | 1.0–2.0 | 1.0 | 1239 | $1,750 | $1.41 | 43d | 2 | 0.94mi |
| 1910 Agnes St Saint Louis, MO | 3.0 | 1.0 | 704 | $1,200 | $1.70 | 43d | 1 | 0.96mi |
| 1000 Washington Ave Saint Louis, MO | 1.0–2.0 | 1.0–2.0 | 959 | $1,950 | $2.03 | 1d | 24 | 0.96mi |
| 1405 Pine St St. Louis, MO | 2.0 | 2.0 | 1020 | $1,240 | $1.22 | 3d | 1 | 0.98mi |
| 110 N 17th St Saint Louis, MO | 2.0 | 1.0 | 653 | $1,095 | $1.68 | 7d | 1 | 0.98mi |
| 1226 Olive St St. Louis, MO | 1.0–2.0 | 1.0–2.0 | 1157 | $1,700 | $1.47 | 1d | 2 | 0.99mi |
| 300 N Tucker Blvd St. Louis, MO | 1.0–2.0 | 1.0–2.0 | 1013 | $1,875 | $1.85 | 1d | 10 | 0.99mi |
| 1014 Locust St Saint Louis, MO | 1.0–2.0 | 1.0–2.0 | 1110 | $2,070 | $1.86 | 1d | 2 | 1.02mi |
| 206 N 9th St Unit 1207 St. Louis, MO | 2.0 | 1.0 | 843 | $1,100 | $1.30 | 43d | 1 | 1.15mi |
| 206 N 9th St Unit 307 St. Louis, MO | 2.0 | 1.0 | 897 | $1,100 | $1.23 | 4d | 1 | 1.15mi |
| 206 N 9th St Unit 916 St. Louis, MO | 2.0 | 2.0 | 914 | $1,250 | $1.37 | 23d | 1 | 1.15mi |
| 206 N 9th St Unit 1306 St. Louis, MO | 2.0 | 2.0 | 897 | $1,250 | $1.39 | 43d | 1 | 1.15mi |
| 800 Olive St Saint Louis, MO | 1.0–2.0 | 1.0–2.0 | 1063 | $2,319 | $2.18 | 1d | 26 | 1.17mi |
| 720 Olive St St. Louis, MO | 3.0 | 1.0–2.0 | 1778 | $5,000 | $2.81 | 1d | 15 | 1.20mi |
| 555 N 4th St St. Louis, MO | 1.0–2.0 | 1.0–1.5 | 1180 | $1,775 | $1.50 | 43d | 12 | 1.24mi |
| 555 N 4th St St. Louis, MO | 2.0 | 1.0 | 1080 | $1,450 | $1.34 | 16d | 1 | 1.24mi |
| 515 Olive St Saint Louis, MO | 1.0–2.0 | 1.0–2.5 | 1117 | $3,100 | $2.78 | 1d | 26 | 1.25mi |
| 400 N 4th St Saint Louis, MO | 2.0 | 1.0–2.0 | 1162 | $3,160 | $2.72 | 1d | 1 | 1.32mi |
Listing history 5 events
-
2026-05-15status Pending 1178-char remark
Show marketing remark (1178 chars)
Opportunity awaits with this 3 bed, 2 bath home on a corner lot in a great location. This home has a fenced backyard and some custom landscaping. The main floor has a large bedroom, living room, kitchen, full bathroom and mud room. The upstairs has 2 dormer style bedrooms with closets. Large basement. This property is now active in an online auction. All offers must be submitted through the property's listing page on WWW.AUCTION.COM. The sale will be subject to a 5% buyer's premium pursuant to the Auction Terms and Conditions (minimums may apply). All auction bids will be processed subject to seller approval. If your offer is accepted, you agree to an offer submission technology fee of $212.00. The fee will be collected & disbursed by the settlement agent at closing. NO SHOWINGS-- PROPERTY IS OCCUPIED-- NO SHOWINGS ALLOWED. Do Not Trespass. Inspections are not available - sold as-is. No for sale sign. Contact with occupants is prohibited. **Under FinCEN s new RRE Rule, transfers will be subject to reporting when buyers use entities or trusts to take title to residential real estate, when the transaction is all cash, privately financed or HELOC**
-
2026-03-11$154,900 Active 1178-char remark
Show marketing remark (1178 chars)
Opportunity awaits with this 3 bed, 2 bath home on a corner lot in a great location. This home has a fenced backyard and some custom landscaping. The main floor has a large bedroom, living room, kitchen, full bathroom and mud room. The upstairs has 2 dormer style bedrooms with closets. Large basement. This property is now active in an online auction. All offers must be submitted through the property's listing page on WWW.AUCTION.COM. The sale will be subject to a 5% buyer's premium pursuant to the Auction Terms and Conditions (minimums may apply). All auction bids will be processed subject to seller approval. If your offer is accepted, you agree to an offer submission technology fee of $212.00. The fee will be collected & disbursed by the settlement agent at closing. NO SHOWINGS-- PROPERTY IS OCCUPIED-- NO SHOWINGS ALLOWED. Do Not Trespass. Inspections are not available - sold as-is. No for sale sign. Contact with occupants is prohibited. **Under FinCEN s new RRE Rule, transfers will be subject to reporting when buyers use entities or trusts to take title to residential real estate, when the transaction is all cash, privately financed or HELOC**
-
2002-01-31soldstatus $125,000
-
2002-01-31soldstatus $125,000
-
1997-06-03soldstatus
ⓘ Source: listings_history table (triggers on properties + properties_extension) + one-shot
backfill from property_details.listing_events for pre-trigger history.
Tax reassessment forecast MO · Resets to sale price
- Current annual tax
- $1,486 · $124/mo
- Projected year-2 tax
- $1,503 · $125/mo
- Expected delta
- +$16/yr (+$1/mo · 1.1%)
ⓘ Screening estimate from a state-policy table — verify with the county assessor before closing.
Climate risk First Street
- Flood 1/10 Low FEMA zone X (unshaded) · 0% chance over 30 yrs
- Wildfire 1/10 Low
- Heat 5/10 Major 7 d/yr ≥109°F today · 21 d/yr by 30 yrs out
- Wind 2/10 Low 100% chance of damaging wind over 30 yrs
- Air quality 3/10 Moderate 3 unhealthy d/yr today · 4 by 30 yrs out
Nearby sold comps map
Loading sold comps map…
Walkable amenities ~0.75 mi
Loading nearby amenities…
Taxation est. · year 1
- Rental income
- $19,680
- − Mortgage interest
- −$8,677
- − Property taxes
- −$1,486
- − Insurance
- −$774
- − Repairs & maintenance
- −$1,574
- − Management
- −$1,574
- − Depreciation
- −$4,506
- Taxable income
- $1,088
- Est. tax owed @ 24.0%
- −$261
- After-tax cash flow
- $3,278/yr
For passive investors: Depreciation is non-cash, so a rental often shows a tax loss while cash-flowing — sheltering income. Rental losses are passive: they offset passive income freely, and up to $25,000/yr can offset ordinary (W-2) income if you actively participate and your MAGI is under $100k (phasing out to $0 by $150k); unused losses carry forward. On sale, claimed depreciation is recaptured at up to 25%, and gains may owe capital-gains tax (a 1031 exchange can defer both). Figures are a year-1 estimate at your 24.0% rate — not tax advice; consult a CPA.
Schools (NCES district)
- District
- St. Louis City
- NCES district ID
- 2929280
- Math proficiency
- 10% ▼ -6.00%
- Reading proficiency
- 18% ▼ -3.00%
- Median HH income
- $35,685
- Composite
- 11.54/100
- National rank
- #9699
- State rank
- #312 of 324 in MO
Livability — St. Louis
No livability data for this city. (Only ~50 U.S. cities are tracked.)
Census & demographics
- Census place
- St. Louis, MO
- City population
- 283,259
- Population (ZIP)
- 7,742
Population outlook (St. Louis County) Hauer SSP2
- Today (2025)
- 315,737 people
- By 2030
- 313,865 · -0.6%
- By 2040
- 305,439 · -3.3%
- By 2050
- 296,529 · -6.1%
- By 2075
- 271,028 · -14.2%
- By 2100
- 255,359 · -19.1%
Race, ethnicity, and origin ACS 2023
- Neighborhood character
- Predominantly Black (89%)
- Race & ethnicity
- Black 89% White 7% Two or more races 2% Hispanic / Latino 2%
- Foreign-born
- 5% · Canada
- Languages at home
- 93% English-only · Spanish 2%
Political lean MEDSL · St. Louis
- 2024 margin
- Solid D (+64.7) · D 81.4% · R 16.7% · Other 2.0%
- 2008→2024 swing
- -3.5pp toward R · 2008: 68.2pp · 2024: 64.7pp
- All cycles
- 2024: D+64.7 2020: D+66.2 2016: D+63.7 2012: D+66.6 2008: D+68.2
Not yet ingested
- Civics
- —
Market trends
- HPI YoY
- ▲ 1.91%
- Current HPI
- 133.284
- Rent YoY
- —
- Metro
- —
- State GDP YoY
- ▲ 1.84%
- F500 in state
- 20
Industry mix (Fortune 500 HQ in MO)
| Industry | F500 HQs | Revenue |
|---|---|---|
| Healthcare | 1 | $163B |
|
||
| Insurance | 1 | $21B |
|
||
| Industrial Technology | 1 | $17B |
|
||
| Retail | 1 | $16B |
|
||
| Industrial Distribution | 1 | $10B |
|
||
| Utilities | 1 | $9B |
|
||
Price history
+23.9% since first listed5 events — show timeline
- 2026-05-15 Pending — MARIS as Distributed by MLS Grid
- 2026-03-11 Listed $154,900 MARIS as Distributed by MLS Grid
- 2002-01-31 Sold (Public Records) $125,000 Public Records
- 2002-01-31 Sold (Public Records) $125,000 Public Records
- 1997-06-03 Sold (Public Records) — Public Records
Property tax history
+1.4%/yrLatest (2024): $1,486 · +5.1% YoY. Source: county tax records.
Cash-flow waterfall
monthlySold comps — $/sqft
last 12 mo · ≤1 miLoading sold comps…