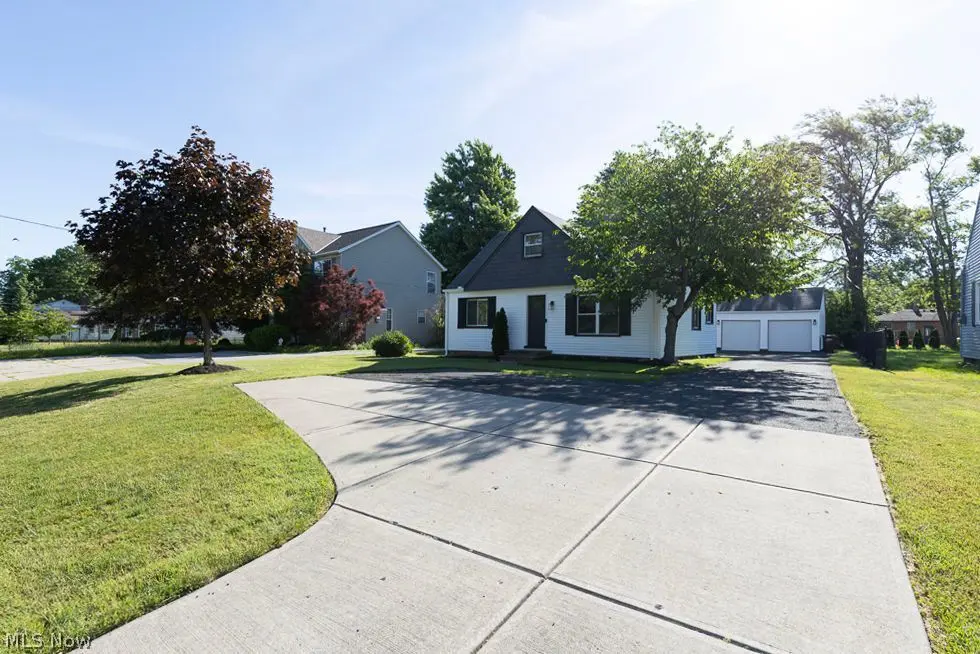
1995 Columbia Rd · Westlake, OH
Flood risk 1/10 · Minimal
- FEMA flood zone
- X (unshaded)
- Chance of flooding over 30 yrs
- 0.0%
- Est. flood insurance / yr
- $507 – $1,088
Fire risk 1/10 · Minimal
- Est. fire insurance / yr
- $713 – $1,323
Heat risk 3/10 · Minor
- Hot days now (above 95°F)
- 7 days/yr
- Hot days in 30 yrs
- 17 days/yr
Wind risk 1/10 · Minimal
- Chance of severe wind over 30 yrs
- —
Air-quality risk 2/10 · Minimal
- Unhealthy air days now
- 2 days/yr
- Unhealthy air days in 30 yrs
- 2 days/yr
Risk factors via First Street. Map © Google.
Why this score? — see what drove the D- grade
The composite is a weighted blend of 9 inputs, each scored 0–100. Each bar is that input's sub-score; the figure is the points it added to the 100-point composite (weight × sub-score).
- Cash flow +12.2/30.0
- Schools +6.6/10.0
- Livability +4.1/5.0
- DSCR +3.6/10.0
- 1% rule +3.4/10.0
- Rent growth +3.1/5.0
- Condition / age +2.5/5.0
- ARV discount +0.2/15.0
- Appreciation +0.0/10.0
$300,000
🖨 Deal sheet (PDF) 📄 Offer letter ✓ Due diligence
Listing remarks
Come find where affordability & luxury meet in Westlake. First-floor living in Prime location to Center Ridge, Hilliard, & Detroit, this home offers convenience & aesthetic appeal. Welcome to modern living w/ o the cookie-cutter feel in this home. As you arrive, you’ll appreciate guest parking up front, along with add’l turnaround space, carport, & 2-car garage tucked privately out back. There, feel the serenity—peaceful, inviting, & designed for relaxation. The carport now serves as an entertainment area, complete with wood-paneled ceiling, ambient lighting, & patio furnishings. 4 bedrooms in this revived Cape Cod. Entering the home from th
Key facts
- Guest parking
- Wood paneled ceiling
- First floor living
Tags
Neighborhood map
What this means for you Summary
Snapshot
- This is a 4-bed/1.0-bath single-family listed at $300k.
Deal economics
- At list price, monthly cash flow is $-63 ($-752/yr) — negative.
- To cash-flow at today's rent, offer at most $289k (3.7% below list).
- To meet the 1% rule (rent ≥ 1% of price), the offer needs to be $252k (16.0% below list).
- Recommended offer: $252k (16.0% below list) — sets the bar for 1% rule.
- Cap rate 6.0% vs local median 3.4% in Westlake — top-decile yield for the area; either an underpriced asset or a hidden risk that comps aren't pricing in. Stress-test before assuming the spread holds.
Location & tenants
- Location reads 82/100 on livability (#79 in OH, #1,202 nationally) — a professional / high-income tenant draw. Strengths: crime A+, employment A+, housing A+; Watch: amenities F, commute F.
- Westlake City (suburban): math 71% / reading 79% proficiency, ranked #76 of 656 in OH (top 12%) — strong family-tenant draw, lease renewals of 3-5y typical; only 15% free/reduced lunch — higher-income household profile.
- Zoned schools: Westlake Elementary School (math 80% / reading 75%, grade A, #213 of 1,584 statewide, top 14%, 1,217 students, 15% FRL); Lee Burneson Middle School (math 75% / reading 83%, grade A+, #54 of 654 statewide, top 9%, 498 students, 16% FRL); Westlake High School (math 56% / reading 81%, grade B, #130 of 781 statewide, top 17%, 1,066 students, 15% FRL) — zoned schools at 16% FRL track the district average.
- Market conditions: Rents rising (+2.3%/yr); 166 active listings in the ZIP; 1 comparable units currently listed for rent nearby; high-income renter base; 1,441 units permitted in Cuyahoga County in 2024 (700 in 5+ unit buildings).
Forward outlook
- Local home prices are declining (-3.0%/yr); year-one equity from $2k of loan paydown is wiped out by about $9k of value loss. Plan a longer hold.
- Cuyahoga County population projected to shrink 8% by 2050 — rents likely to lag national; underwrite the cash flow, not the appreciation.
Negotiation context
- Only 6 days on market — expect competitive offers; lowballing is unlikely to land.
- Current owner paid $82k; list at $300k implies a 264% gain — meaningful room to come down on a strong offer.
Risks & watch-outs
- Watch-outs: built in 1952 — expect roof / HVAC / electrical / plumbing capex.
Questions for the listing agent
- What do current leases actually rent for vs. the listed asking? Can we see a recent rent roll and the last 12 months of T-12 income?
- Built in 1952 — when were the roof, HVAC, electrical panel, plumbing, and water heater last replaced?
- Is there a deadline driving the sale (1031 exchange, divorce, estate, relocation)? That informs how much negotiation room exists.
- Schools are A-rated — typically a magnet for longer-tenancy family renters. What's the average tenant stay here, and is there a school-zone premium baked into asking?
- The area grade is low — what's the realistic commute time and amenity access for the typical tenant pool here? Any planned neighborhood developments (good or bad) we should know about?
- What's the average days-on-market for RENTAL listings here right now (not sales)? A rising rental-DOM trend means longer vacancies and softer asking-rent achievability than the comps imply.
- What's the recent tenant-quality profile in this submarket — average credit score on applications, eviction rate, late-payment / NSF rate, and stable-employment percentage? A property-management company in the area should have these aggregated.
- How much new for-sale + rental construction is in the pipeline within 1–3 miles? Heavy new supply typically softens prices + rents 12–24 months out; constrained supply supports both.
Investment metrics
- 1% rule
- 0.84% ✗
- Cap rate
- 6.04%
- Cash-on-cash
- -0.89%
- DSCR
- 0.96
- GRM
- 9.9
CMA / ARV
- ARV (on-the-fly)
- $258,336
- Comps found
- 9
Show comp detail 9 sales within ~0.75 mi
| Address | Dist | Beds/Ba | Sqft | Sold | Price | $/sf | Match |
|---|---|---|---|---|---|---|---|
| 2353 W Hedgewood Dr | 0.37mi | 3/2.0 (-1) | 1,248 (0%) | 8mo | $305,700 | $245 | 67 |
| 2009 Columbia Rd | 0.01mi | 3/1.5 (-1) | 1,388 (+11%) | 13mo | $186,000 | $134 | 63 |
| 2253 Canterbury Rd | 0.58mi | 3/1.0 (-1) | 1,276 (+2%) | 6mo | $189,900 | $149 | 59 |
| 25352 Westwood Rd | 0.64mi | 4/2.5 | 1,188 (-5%) | 10mo | $376,000 | $316 | 48 |
| 2138 Hawkins Rd | 0.74mi | 3/2.0 (-1) | 1,229 (-2%) | 9mo | $330,000 | $269 | 47 |
| 1830 Columbia Rd | 0.13mi | 3/2.5 (-1) | 1,389 (+11%) | 22mo | $350,000 | $252 | 46 |
| 1410 Columbia Rd | 0.55mi | 3/1.0 (-1) | 1,320 (+6%) | 18mo | $245,000 | $186 | 44 |
| 25669 W Hedgewood Dr | 0.46mi | 3/2.0 (-1) | 1,165 (-7%) | 18mo | $217,000 | $186 | 44 |
| 2247 Walter Rd | 0.56mi | 3/2.0 (-1) | 1,400 (+12%) | 16mo | $290,000 | $207 | 31 |
Match score weights: distance 35% · size 25% · config 20% · recency 20%. Top-matched comps best support the ARV.
Projected returns pro-forma
-3.0% appreciation · 2.32% rent growth · sell at horizon
- IRR
- -18.5%
- Equity multiple
- 0.35×
- Total profit
- $-54,290
- Equity at exit
- $44,731
- IRR
- -12.3%
- Equity multiple
- 0.29×
- Total profit
- $-59,239
- Equity at exit
- $25,939
Cash invested: $84,000 (down + closing). Projections, not guarantees.
Landlord ↔ Tenant lean methodology
- Overall (STATE)
- 73 Landlord-Friendly
- State Ohio
- 73 Landlord-Friendly · R+6
- County
- — inherits STATE
- City
- — inherits STATE
ZIP-level market 44145
- Rents YoY
- 2.3%
- Active inventory
- 166
- Price-to-rent
- 9.9×
Monthly cashflow live
- Estimated rent
- $2,520 medium interval (Pro) →
- Mortgage (P&I)
- −$1,573
- Tax from tax record
- −$356 /mo · $4,266/yr
- Insurance
- −$125
- HOA
- −$0
- Vacancy / Maint / Mgmt
- −$529
- Net cashflow
- $-63
Break-even live
Sensitivity live
| Price | -10% $107 | -5% $22 | +0% $-63 | +5% $-148 | +10% $-232 |
|---|---|---|---|---|---|
| Rent | -10% $-262 | -5% $-162 | +0% $-63 | +5% $37 | +10% $136 |
| Rate | -1.0pp $88 | -0.5pp $14 | base $-63 | +0.5pp $-140 | +1.0pp $-219 |
UW: 25.0% down · 7.5% · 30yr · 1.5% tax · 5.0% vac · 8.0% maint · 8.0% mgmt
Financing live
Cash to close
- Down payment
- $75,000
- Closing costs
- $9,000
- Reserves months
- —
- Total cash needed
- —
Loan-product check · same deal, 3 products live
Conventional
25% down · 7.5% · 30yr
- Down + closing
- —
- Monthly P&I
- —
- Monthly cashflow
- —
- DSCR
- —
- Eligible?
- —
Personal DTI + credit; lowest rate.
DSCR
20% down · 8.5% · 30yr
- Down + closing
- —
- Monthly P&I
- —
- Monthly cashflow
- —
- DSCR
- —
- Eligible?
- —
No personal income docs; deal must DSCR.
Hard money
10% down · 12.0% · 12mo
- Down + closing
- —
- Monthly P&I
- —
- Monthly cashflow
- —
- DSCR
- —
- Eligible?
- —
Short-term bridge; refi at stabilization.
Rent comps 1 comps
| Address | Beds | Baths | Sqft | Rent | $/sqft | DOM | Units | Dist |
|---|---|---|---|---|---|---|---|---|
| 25312 Hall Dr Westlake, OH | 4.0 | 1.5 | 1260 | $2,280 | $1.81 | 45d | 1 | 1.14mi |
Listing history 5 events
-
2026-06-21days on market $300,000 Active 6 DOM
-
2026-06-18days on market $300,000 Active 3 DOM
-
2026-06-17days on market $300,000 Active 2 DOM
-
2026-06-15remarks 657-char remark
-
2026-06-15$300,000 Active 1 DOM
ⓘ Source: listings_history table (triggers on properties + properties_extension) + one-shot
backfill from property_details.listing_events for pre-trigger history.
Tax reassessment forecast OH · Partial reset (capped growth)
- Current annual tax
- $4,266 · $356/mo
- Projected year-2 tax
- $4,473 · $373/mo
- Expected delta
- +$207/yr (+$17/mo · 4.9%)
ⓘ Screening estimate from a state-policy table — verify with the county assessor before closing.
Climate risk First Street
- Flood 1/10 Low FEMA zone X (unshaded) · 0% chance over 30 yrs
- Wildfire 1/10 Low
- Heat 3/10 Moderate 7 d/yr ≥95°F today · 17 d/yr by 30 yrs out
- Wind 1/10 Low
- Air quality 2/10 Low 2 unhealthy d/yr today · 2 by 30 yrs out
Nearby sold comps map
Loading sold comps map…
Walkable amenities ~0.75 mi
Loading nearby amenities…
Taxation est. · year 1
- Rental income
- $30,244
- − Mortgage interest
- −$16,805
- − Property taxes
- −$4,266
- − Insurance
- −$1,500
- − Repairs & maintenance
- −$2,420
- − Management
- −$2,420
- − Depreciation
- −$8,727
- Taxable loss
- −$5,893
- Est. tax savings @ 24.0%
- +$1,414
- After-tax cash flow
- $662/yr
For passive investors: Depreciation is non-cash, so a rental often shows a tax loss while cash-flowing — sheltering income. Rental losses are passive: they offset passive income freely, and up to $25,000/yr can offset ordinary (W-2) income if you actively participate and your MAGI is under $100k (phasing out to $0 by $150k); unused losses carry forward. On sale, claimed depreciation is recaptured at up to 25%, and gains may owe capital-gains tax (a 1031 exchange can defer both). Figures are a year-1 estimate at your 24.0% rate — not tax advice; consult a CPA.
Schools (NCES district)
- District
- Westlake City
- NCES district ID
- 3904506
- Math proficiency
- 71% ▼ -12.00%
- Reading proficiency
- 79% ▼ -7.00%
- Median HH income
- $74,709
- Composite
- 65.85/100
- National rank
- #451
- State rank
- #76 of 656 in OH
Livability — Westlake
- Score
- 82/100
- State rank
- #79
- US rank
- #1202
Category grades
Schools grade is shown separately in the Schools card above.
Census & demographics
- Census place
- Westlake, OH
- County
- Cuyahoga County · 1,090,369 people
- City population
- 34,104
- Metro
- Cleveland-Elyria, OH
- Population (ZIP)
- 34,104
- Household income
- $112,200
- Rent vs Own
- Severe rent burden
- 690.0
Population outlook (Cuyahoga County) Hauer SSP2
- Today (2025)
- 1,244,621 people
- By 2030
- 1,230,093 · -1.2%
- By 2040
- 1,189,108 · -4.5%
- By 2050
- 1,145,706 · -7.9%
- By 2075
- 1,076,557 · -13.5%
- By 2100
- 978,987 · -21.3%
Race, ethnicity, and origin ACS 2023
- Neighborhood character
- Predominantly White (85%)
- Race & ethnicity
- White 85% Asian 7% Two or more races 5% Hispanic / Latino 4% Black 2%
- Common ancestry
- Romanian 7% Lithuanian 3% Subsaharan African 2%
- Foreign-born
- 13% · Canada, China, South Korea
- Languages at home
- 84% English-only · Arabic 5% Other Indo-European 4% Russian/Polish/Slavic 2%
Political lean MEDSL · Cuyahoga
- 2024 margin
- Solid D (+31.5) · D 65.4% · R 33.9%
- 2008→2024 swing
- -7.4pp toward R · 2008: 38.9pp · 2024: 31.5pp
- All cycles
- 2024: D+31.5 2020: D+34.1 2016: D+35.0 2012: D+38.7 2008: D+38.9
Not yet ingested
- Civics
- —
Market trends
- HPI YoY
- ▼ -191.97%
- Current HPI
- 202.4805
- Rent YoY
- ▲ 2.32%
- Metro
- Cleveland-Elyria, OH
- State GDP YoY
- ▲ 1.98%
- F500 in state
- 48
Industry mix (Fortune 500 HQ in OH)
| Industry | F500 HQs | Revenue |
|---|---|---|
| Insurance | 3 | $145B |
|
||
| Industrial Machinery | 3 | $49B |
|
||
| Financial Services | 3 | $24B |
|
||
| Consumer Goods | 2 | $93B |
|
||
| Aerospace / Defense | 2 | $47B |
|
||
| Utilities | 2 | $33B |
|
||
Price history
+263.6% since first listed2 events — show timeline
- 2026-06-12 Listed $300,000 MLSNOW
- 2020-09-16 Sold (Public Records) $82,500 Public Records
Property tax history
+9.1%/yrLatest (2025): $4,266 · -1.0% YoY. Source: county tax records.
Cash-flow waterfall
monthlySold comps — $/sqft
last 12 mo · ≤1 miLoading sold comps…