 🏷️ Likely Rental
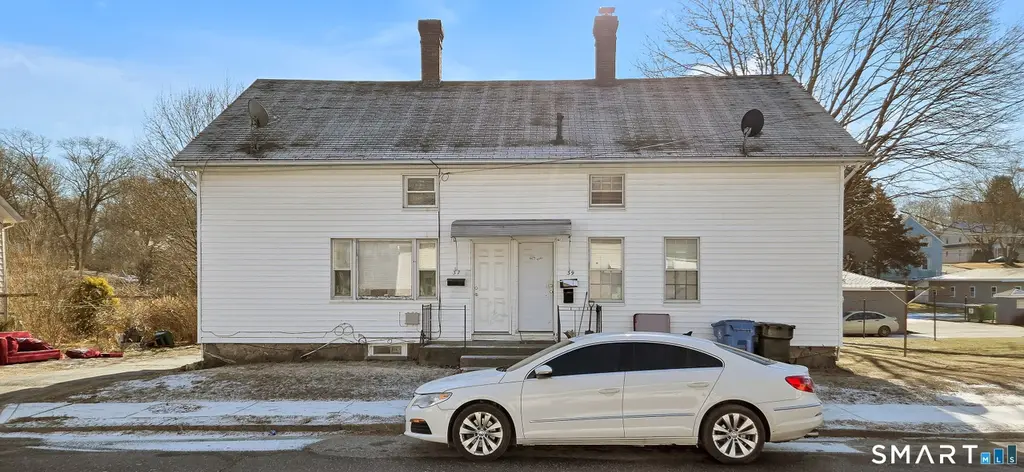
37-39 S B St · Norwich, CT
Flood risk 1/10 · Minimal
- FEMA flood zone
- X (unshaded)
- Chance of flooding over 30 yrs
- 0.0%
- Est. flood insurance / yr
- $473 – $860
Fire risk 2/10 · Minimal
- Est. fire insurance / yr
- $829 – $1,539
Heat risk 5/10 · Moderate
- Hot days now (above 98°F)
- 7 days/yr
- Hot days in 30 yrs
- 17 days/yr
Wind risk 6/10 · Moderate
- Chance of severe wind over 30 yrs
- 63.0%
Air-quality risk 3/10 · Minor
- Unhealthy air days now
- 2 days/yr
- Unhealthy air days in 30 yrs
- 3 days/yr
Risk factors via First Street. Map © Google.
Why this score? — see what drove the A- grade
The composite is a weighted blend of 9 inputs, each scored 0–100. Each bar is that input's sub-score; the figure is the points it added to the 100-point composite (weight × sub-score).
- Cash flow +30.0/30.0
- ARV discount +15.0/15.0
- 1% rule +10.0/10.0
- DSCR +10.0/10.0
- Appreciation +10.0/10.0
- Livability +4.0/5.0
- Rent growth +2.5/5.0
- Schools +2.1/10.0
- Condition / age +1.0/5.0
$270,000
🖨 Deal sheet 📄 Offer letter ✓ Due diligence
Multi-family units
County records classify this as Multi-Family (2-4 Unit). Listing-text estimate: 3 units. confirmed
Listing remarks
CASH ONLY !! Add-value 3-family investment opportunity located in Norwich, Connecticut. This property offers investors the rare ability to unlock significant upside through renovation, lease-up, and rent stabilization in a market with strong workforce housing demand. The property consists of one spacious 4-bedroom unit and two additional 1-bedroom units, creating a desirable unit mix that appeals to a broad tenant base. Currently operating below its full income potential, the asset presents a clear path to increased cash flow through unit improvements and leasing strategy. Additional features include off-street parking, separate tenant-paid utilities, public water and sewer, and gas heat an
Key facts
- Generous lot
- Off street parking
- 0.44 acre lot
Tags
Property features AI
Finance
- Other: Living area approximately 2,318 (public record)
Exterior
- Utilities: Public water connected; Public sewer connected
- Home design: Multi-family property (3-family)
- Construction: Frame construction; Masonry foundation; Asphalt shingle roof
- Exterior features: Level lot; Vinyl siding
Interior
- Bedrooms: 6 bedrooms
- Bathrooms: 3 full bathrooms
- Heating & cooling: Hot water heating; Electric heat fuel
- Interior features: 12 total rooms; Full basement
Neighborhood map
What this means for you Summary
Snapshot
- This is a 3 × 2-bed/1.0-bath units multifamily listed at $270k. Condition is rated poor.
Deal economics
- At list price, monthly cash flow is $2k ($24k/yr) — positive. Per door: $674/mo.
- The deal already cash-flows at list — no discount required.
- Meets the 1% rule at list price ($5k rent vs $270k).
- Cap rate 15.3% vs local median 4.0% in Norwich — top-decile yield for the area; either an underpriced asset or a hidden risk that comps aren't pricing in. Stress-test before assuming the spread holds.
Location & tenants
- Location reads 81/100 on livability (#18 in CT, #1,391 nationally) — a professional / high-income tenant draw. Strengths: housing A+, health & safety A+, commute A-; Watch: schools D+.
- Norwich School District (urban): math 19% / reading 29% proficiency, ranked #139 of 153 in CT (top 91%) — low school quality limits family demand, transient renter base, plan for 1-2y turnover; 62% free/reduced lunch — lower-income household profile, screen leases tightly.
- Market conditions: 7 active listings in the ZIP; 487 units permitted in Southeastern Connecticut Planning Region in 2024 (244 in 5+ unit buildings).
Forward outlook
- In year one you build about $29k of equity ($2k loan paydown + $27k appreciation (10.0% local appreciation)).
- At projected returns (10.0% appreciation + 3.0% rent growth), your $76k cash investment doubles in ~2 years — after that, you're playing with house money.
- By year 2, paydown + projected appreciation supports a ~$46k cash-out refi (75% LTV) — recoverable capital for the next deal without selling this one.
Negotiation context
- Only 12 days on market — expect competitive offers; lowballing is unlikely to land.
- 2 sale attempts with the ask held roughly flat each time — persistent listings suggest the price (not the market) is what's stuck; bring a comps-based counter.
Risks & watch-outs
- Watch-outs: built in 1875 — expect roof / HVAC / electrical / plumbing capex.
- Climate carrying-cost: major wind risk, 63% chance of damaging wind over 30y; extreme-heat days projected 7→17/yr by 2055 (HVAC capex compounding) — expect insurance premiums to compound above CPI over the hold.
Questions for the listing agent
- Can we see the unit-by-unit rent roll, current vacancy, and any below-market leases? What's the average tenancy length?
- What capital expenditures (roof, boiler, parking lot, exteriors) have been made in the last 5 years, and what's planned in the next 2?
- Have any recent inspections been done? Can we get a copy of the seller's disclosures and any deferred-maintenance estimates?
- Built in 1875 — when were the roof, HVAC, electrical panel, plumbing, and water heater last replaced?
- Is there a deadline driving the sale (1031 exchange, divorce, estate, relocation)? That informs how much negotiation room exists.
- Schools are D-rated, which usually means shorter tenancies and higher turnover. Who's the typical renter profile here, and what's been the actual vacancy rate?
- What's the average days-on-market for RENTAL listings here right now (not sales)? A rising rental-DOM trend means longer vacancies and softer asking-rent achievability than the comps imply.
- What's the recent tenant-quality profile in this submarket — average credit score on applications, eviction rate, late-payment / NSF rate, and stable-employment percentage? A property-management company in the area should have these aggregated.
- How much new apartment / multifamily construction is in the pipeline within 1–3 miles? Heavy new supply (>2% of stock underway) typically softens rents 12–24 months out; light construction supports rent growth.
Investment metrics
- 1% rule
- 1.82% ✓
- Cap rate
- 15.29%
- Cash-on-cash
- 32.12%
- DSCR
- 2.43
- GRM
- 4.6
CMA / ARV
- ARV (on-the-fly)
- $338,428
- Comps found
- 7
Show comp detail 7 sales within ~0.75 mi
| Address | Dist | Beds/Ba | Sqft | Sold | Price | $/sf | Match |
|---|---|---|---|---|---|---|---|
| 1 S C St | 0.15mi | 7/— (+1) | 2,352 (+2%) | 3mo | $210,000 | $89 | 83 |
| 2-4 N A St | 0.24mi | 6/2.0 | 2,318 (0%) | 3mo | $385,000 | $166 | 82 |
| 10 N A St | 0.23mi | 6/3.0 | 2,318 (0%) | 8mo | $390,000 | $168 | 82 |
| 33 N A St | 0.17mi | 7/3.0 (+1) | 2,331 (+1%) | 6mo | $375,000 | $161 | 81 |
| 44 Providence St | 0.15mi | 5/3.5 (-1) | 2,290 (-1%) | 7mo | $333,500 | $146 | 78 |
| 42-44 S B St | 0.02mi | 7/3.0 (+1) | 2,318 (0%) | 24mo | $250,500 | $108 | 74 |
| 207 Norwich Ave | 0.71mi | 6/2.0 | 2,116 (-9%) | 6mo | $285,000 | $135 | 43 |
Match score weights: distance 35% · size 25% · config 20% · recency 20%. Top-matched comps best support the ARV.
Projected returns pro-forma
10.0% appreciation · 3.0% rent growth · sell at horizon
- IRR
- 48.8%
- Equity multiple
- 4.65×
- Total profit
- $275,986
- Equity at exit
- $243,237
- IRR
- 42.5%
- Equity multiple
- 10.41×
- Total profit
- $711,544
- Equity at exit
- $524,551
Cash invested: $75,600 (down + closing). Projections, not guarantees.
Landlord ↔ Tenant lean methodology
- Overall (STATE)
- 27 Tenant-Leaning
- State Connecticut
- 27 Tenant-Leaning · D+7
- County
- — inherits STATE
- City
- — inherits STATE
ZIP-level market 06380
- Home prices YoY
- 4.2%
- Active inventory
- 7
- Price-to-rent
- 13.7×
Monthly cashflow live
- Estimated rent
- $4,923 medium interval (Pro) →
- Mortgage (P&I)
- −$1,416
- Tax est. 1.5%
- −$338 /mo · $4,050/yr
- Insurance
- −$112
- HOA
- −$0
- Vacancy / Maint / Mgmt
- −$1,034
- Net cashflow
- $2,023
Break-even live
3-unit breakdown (identical units grouped — click to expand)
| Units | Beds | Baths | Est. rent |
|---|---|---|---|
| 3× units | 2 | 1 | $4,923 |
| #1 | 2 | 1 | $1,641 |
| #2 | 2 | 1 | $1,641 |
| #3 | 2 | 1 | $1,641 |
| Total (3 units) | $4,923 | ||
UW: 25.0% down · 7.5% · 30yr · 1.5% tax · 5.0% vac · 8.0% maint · 8.0% mgmt
Financing live
Cash to close
- Down payment
- $67,500
- Closing costs
- $8,100
- Reserves months
- —
- Total cash needed
- —
Loan-product check · same deal, 3 products live
Conventional
25% down · 7.5% · 30yr
- Down + closing
- —
- Monthly P&I
- —
- Monthly cashflow
- —
- DSCR
- —
- Eligible?
- —
Personal DTI + credit; lowest rate.
DSCR
20% down · 8.5% · 30yr
- Down + closing
- —
- Monthly P&I
- —
- Monthly cashflow
- —
- DSCR
- —
- Eligible?
- —
No personal income docs; deal must DSCR.
Hard money
10% down · 12.0% · 12mo
- Down + closing
- —
- Monthly P&I
- —
- Monthly cashflow
- —
- DSCR
- —
- Eligible?
- —
Short-term bridge; refi at stabilization.
Listing history 12 events
-
2026-06-10status $270,000 Under Contract 12 DOM
-
2026-06-09days on market $270,000 Active 12 DOM
-
2026-06-08days on market $270,000 Active 11 DOM
-
2026-06-07days on market $270,000 Active 10 DOM
-
2026-06-02days on market $270,000 Active 5 DOM
-
2026-06-01days on market $270,000 Active 4 DOM
-
2026-05-31days on market $270,000 Active 3 DOM
-
2026-05-30days on market $270,000 Active 2 DOM
-
2026-05-28$270,000 Active
-
2026-04-21historical
-
2026-03-30status Under Contract
-
2026-03-24$320,000 Active
ⓘ Source: listings_history table (triggers on properties + properties_extension) + one-shot
backfill from property_details.listing_events for pre-trigger history.
Climate risk First Street
- Flood 1/10 Low FEMA zone X (unshaded) · 0% chance over 30 yrs
- Wildfire 2/10 Low
- Heat 5/10 Major 7 d/yr ≥98°F today · 17 d/yr by 30 yrs out
- Wind 6/10 Major 63% chance of damaging wind over 30 yrs
- Air quality 3/10 Moderate 2 unhealthy d/yr today · 3 by 30 yrs out
Nearby sold comps map
Loading sold comps map…
Walkable amenities ~0.75 mi
Loading nearby amenities…
Taxation est. · year 1
- Rental income
- $59,076
- − Mortgage interest
- −$15,124
- − Property taxes
- −$4,050
- − Insurance
- −$1,350
- − Repairs & maintenance
- −$4,726
- − Management
- −$4,726
- − Depreciation
- −$7,855
- Taxable income
- $21,245
- Est. tax owed @ 24.0%
- −$5,099
- After-tax cash flow
- $19,180/yr
For passive investors: Depreciation is non-cash, so a rental often shows a tax loss while cash-flowing — sheltering income. Rental losses are passive: they offset passive income freely, and up to $25,000/yr can offset ordinary (W-2) income if you actively participate and your MAGI is under $100k (phasing out to $0 by $150k); unused losses carry forward. On sale, claimed depreciation is recaptured at up to 25%, and gains may owe capital-gains tax (a 1031 exchange can defer both). Figures are a year-1 estimate at your 24.0% rate — not tax advice; consult a CPA.
Condition & rehab AI · 13 photos
This multi-family property requires extensive renovations to improve its condition and increase its value. The roof, siding, flooring, appliances, fixtures, and HVAC all need major repairs, while routine maintenance is also required. The property has significant potential for increased value through renovations.
Repairs flagged
- Major Roof — Significant damage and wear visible
- Major Siding — Worn and damaged siding needs replacement
- Major Flooring — Worn and damaged flooring needs replacement
- Major Appliances — Old and worn appliances need replacement
- Major Fixtures — Old and worn fixtures need replacement
- Major Paint — Worn and peeling paint needs repainting
- Major HVAC — Old and inefficient heating and cooling systems need replacement
Value-add opportunities
- Both New roof — New roof will improve the overall condition and appearance of the property
- Both New siding — New siding will improve the curb appeal and increase the property's value
- Both New flooring — New flooring will improve the living spaces and increase the property's value
- Both New appliances — New appliances will improve the functionality and increase the property's value
- Both New fixtures — New fixtures will improve the functionality and increase the property's value
- Both Repainting — Repainting will improve the appearance and increase the property's value
- Both HVAC replacement — New HVAC will improve the comfort and increase the property's value
Renovation cost estimate screening
| Repair item | Severity | Est. cost |
|---|---|---|
| Roof · Significant damage and wear visible | Major | $15,000–50,000 |
| Siding · Worn and damaged siding needs replacement | Major | $15,000–50,000 |
| Flooring · Worn and damaged flooring needs replacement | Major | $15,000–50,000 |
| Appliances · Old and worn appliances need replacement | Major | $15,000–50,000 |
| Fixtures · Old and worn fixtures need replacement | Major | $15,000–50,000 |
| Paint · Worn and peeling paint needs repainting | Major | $15,000–50,000 |
| HVAC · Old and inefficient heating and cooling systems need replacement | Major | $15,000–50,000 |
| Total estimated repair cost · 7 items | $105,000–350,000 |
Value-add ROI direction
- Both New roof — New roof will improve the overall condition and appearance of the property ↑
- Both New siding — New siding will improve the curb appeal and increase the property's value ↑
- Both New flooring — New flooring will improve the living spaces and increase the property's value ↑
- Both New appliances — New appliances will improve the functionality and increase the property's value ↑
- Both New fixtures — New fixtures will improve the functionality and increase the property's value ↑
- Both Repainting — Repainting will improve the appearance and increase the property's value ↑
- Both HVAC replacement — New HVAC will improve the comfort and increase the property's value ↑
ⓘ Cost ranges are severity-bucket heuristics (US national rule-of-thumb). Get contractor quotes + a written scope before underwriting a rehab budget.
Schools (NCES district)
- District
- Norwich School District
- NCES district ID
- 0903120
- Math proficiency
- 19% ▼ -8.00%
- Reading proficiency
- 29% ▼ -7.00%
- Median HH income
- $50,813
- Composite
- 21.27/100
- National rank
- #8395
- State rank
- #139 of 153 in CT
Livability — Norwich
- Score
- 81/100
- State rank
- #18
- US rank
- #1391
Category grades
Schools grade is shown separately in the Schools card above.
Census & demographics
- Census place
- Norwich, CT
- City population
- 37,216
- Population (ZIP)
- 2,427
Population outlook (Southeastern Connecticut County) Hauer SSP2
- By 2040
- 293,442
Race, ethnicity, and origin ACS 2023
- Neighborhood character
- Diverse neighborhood (Simpson 0.58)
- Race & ethnicity
- White 57% Hispanic / Latino 30% Black 8% Two or more races 7% Native American 3%
- Hispanic origin (detail)
- Mexican 4% Puerto Rican 15% Cuban 2%
- Common ancestry
- Lithuanian 12% Romanian 6% American 2%
- Foreign-born
- 9% · Canada
- Languages at home
- 77% English-only · Spanish 18% French/Haitian/Cajun 5%
Political lean MEDSL · Southeastern Connecticut
- 2024 margin
- D (+13.0) · D 55.6% · R 42.6% · Other 1.8%
- All cycles
- 2024: D+13.0
Not yet ingested
- Civics
- —
Market trends
- HPI YoY
- ▲ 10.21%
- Current HPI
- 255.5889
- Rent YoY
- —
- Metro
- —
- State GDP YoY
- ▲ 1.06%
- F500 in state
- 38
Industry mix (Fortune 500 HQ in CT)
| Industry | F500 HQs | Revenue |
|---|---|---|
| Industrial Machinery | 4 | $38B |
|
||
| Insurance | 3 | $71B |
|
||
| Financial Services | 2 | $25B |
|
||
| Transportation / Logistics | 2 | $18B |
|
||
| Healthcare | 1 | $247B |
|
||
| Telecommunications | 1 | $55B |
|
||
Price history
-15.6% since first listed4 events — show timeline
- 2026-05-28 Listed $270,000 Smart MLS
- 2026-04-21 Listing Removed — Smart MLS
- 2026-03-30 Pending — Smart MLS
- 2026-03-24 Listed $320,000 Smart MLS
Cash-flow waterfall
monthlySold comps — $/sqft
last 12 mo · ≤1 miLoading sold comps…