 Duplex
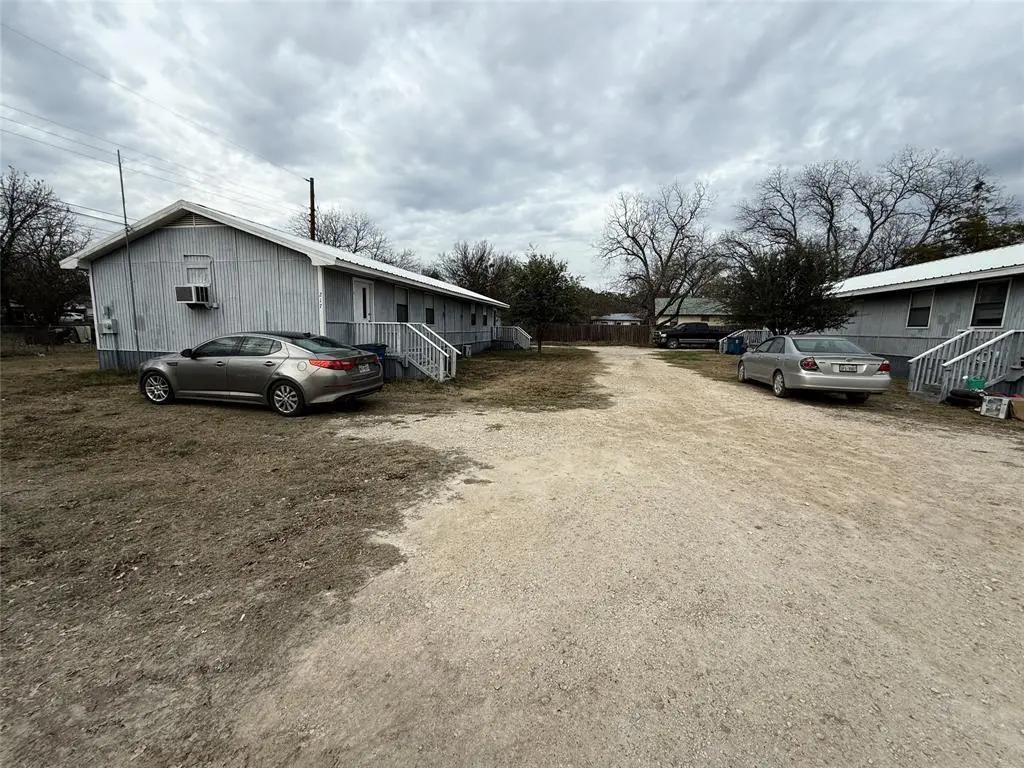
217 2nd St · Cross Plains, TX
Flood risk 4/10 · Minor
- FEMA flood zone
- X
- Chance of flooding over 30 yrs
- 0.22%
- Est. flood insurance / yr
- $507 – $1,088
Fire risk 7/10 · Major
- Est. fire insurance / yr
- $1,222 – $2,270
Heat risk 7/10 · Major
- Hot days now (above 104°F)
- 7 days/yr
- Hot days in 30 yrs
- 23 days/yr
Wind risk 4/10 · Minor
- Chance of severe wind over 30 yrs
- 24.0%
Air-quality risk 1/10 · Minimal
- Unhealthy air days now
- 0 days/yr
- Unhealthy air days in 30 yrs
- 0 days/yr
Risk factors via First Street. Map © Google.
Why this score? — see what drove the D+ grade
The composite is a weighted blend of 9 inputs, each scored 0–100. Each bar is that input's sub-score; the figure is the points it added to the 100-point composite (weight × sub-score).
- Cash flow +13.3/30.0
- Appreciation +8.4/10.0
- ARV discount +7.5/15.0
- DSCR +4.0/10.0
- Schools +4.0/10.0
- 1% rule +3.6/10.0
- Livability +3.4/5.0
- Rent growth +2.5/5.0
- Condition / age +2.5/5.0
$230,000
🖨 Deal sheet 📄 Offer letter ✓ Due diligence
Multi-family units
County records classify this as Multi-Family (2-4 Unit). Listing-text estimate: 2 units. confirmed
Listing remarks MLS
Income-Producing Duplex Portfolio - 4 Units - Cash Flowing Located at 217 Southeast 2nd Street in Cross Plains, this well-positioned two-building, four-unit duplex complex presents a compelling opportunity for investors seeking immediate cash flow with long-term upside. The property consists of two separate duplex buildings, offering operational flexibility and reduced risk through unit diversification. All four units are currently cash flowing, making this a true turnkey investment from day one. Recent improvements include minor updates to the HVAC systems, enhancing efficiency and reliability, as well as newer appliances throughout the units—helping to reduce near-term capital expenditures and support tenant retention. The layout and configuration appeal to long-term renters, while the separate building setup provides potential advantages for future value-add strategies, individual building disposition, or refinancing options. Highlights for Investors: Two buildings - four total units - duplex configuration Currently cash flowing Updated HVAC components Newer appliances Low-maintenance asset with stabilized income Strong fit for buy-and-hold or portfolio expansion This is an excellent opportunity to acquire a stabilized multifamily asset in a solid rental market, offering both immediate income and long-term appreciation potential.
Key facts
- Newer appliances
- Four total units
- Stabilized income
Tags
Neighborhood map
What this means for you Summary
Snapshot
- This is a 2 × 2-bed/?-bath units multifamily listed at $230k.
Deal economics
- At list price, monthly cash flow is $0 ($-4/yr) — negative. Per door: $0/mo.
- To cash-flow at today's rent, offer at most $230k (0.0% below list).
- To meet the 1% rule (rent ≥ 1% of price), the offer needs to be $199k (13.6% below list).
- Recommended offer: $199k (13.6% below list) — sets the bar for 1% rule.
Location & tenants
- Location reads 68/100 on livability (#486 in TX) — a middle-class / working-renter tenant base. Strengths: cost of living A+, health & safety A+, housing A; Watch: schools D+, employment D, amenities F.
- Cross Plains ISD (rural): math 45% / reading 45% proficiency, ranked #581 of 1,141 in TX (top 51%) — families likely to look elsewhere, expect single-tenant / working-renter base with shorter leases.
- Market conditions: 26 active listings in the ZIP; 11 units permitted in Callahan County in 2024 (0 in 5+ unit buildings).
Forward outlook
- In year one you build about $17k of equity ($2k loan paydown + $16k appreciation (6.9% local appreciation)).
- Callahan County population projected to shrink 5% by 2050 — rents likely to lag national; underwrite the cash flow, not the appreciation.
- At projected returns (6.9% appreciation + 3.0% rent growth), your $64k cash investment doubles in ~4 years — after that, you're playing with house money.
- By year 3, paydown + projected appreciation supports a ~$43k cash-out refi (75% LTV) — recoverable capital for the next deal without selling this one.
Negotiation context
- It's been on market 181 days — a 12% lower offer ($202k) is reasonable based on typical stale-listing flexibility.
- 3 sale attempts since 7y ago with the ask held roughly flat each time — persistent listings suggest the price (not the market) is what's stuck; bring a comps-based counter.
Risks & watch-outs
- Climate carrying-cost: major wildfire risk; extreme-heat days projected 7→23/yr by 2055 (HVAC capex compounding) — expect insurance premiums to compound above CPI over the hold.
Questions for the listing agent
- What do current leases actually rent for vs. the listed asking? Can we see a recent rent roll and the last 12 months of T-12 income?
- It's been on market 181 days. Have you received any prior offers? Is the seller open to a 14% concession, seller financing, or rate buy-down credit?
- Can we see the unit-by-unit rent roll, current vacancy, and any below-market leases? What's the average tenancy length?
- What capital expenditures (roof, boiler, parking lot, exteriors) have been made in the last 5 years, and what's planned in the next 2?
- Why hasn't it sold? Are there any deal-killer items the seller is aware of (foundation, flood, title, zoning, code violations)?
- Is there a deadline driving the sale (1031 exchange, divorce, estate, relocation)? That informs how much negotiation room exists.
- Schools are D-rated, which usually means shorter tenancies and higher turnover. Who's the typical renter profile here, and what's been the actual vacancy rate?
- The area grade is low — what's the realistic commute time and amenity access for the typical tenant pool here? Any planned neighborhood developments (good or bad) we should know about?
- What's the average days-on-market for RENTAL listings here right now (not sales)? A rising rental-DOM trend means longer vacancies and softer asking-rent achievability than the comps imply.
- What's the recent tenant-quality profile in this submarket — average credit score on applications, eviction rate, late-payment / NSF rate, and stable-employment percentage? A property-management company in the area should have these aggregated.
- How much new apartment / multifamily construction is in the pipeline within 1–3 miles? Heavy new supply (>2% of stock underway) typically softens rents 12–24 months out; light construction supports rent growth.
Investment metrics
- 1% rule
- 0.86% ✗
- Cap rate
- 6.29%
- Cash-on-cash
- -0.01%
- DSCR
- 1.00
- GRM
- 9.6
CMA / ARV
No comps found within radius.
Projected returns pro-forma
6.88% appreciation · 3.0% rent growth · sell at horizon
- IRR
- 17.4%
- Equity multiple
- 2.22×
- Total profit
- $78,544
- Equity at exit
- $157,504
- IRR
- 16.9%
- Equity multiple
- 4.55×
- Total profit
- $228,545
- Equity at exit
- $297,499
Cash invested: $64,400 (down + closing). Projections, not guarantees.
Landlord ↔ Tenant lean methodology
- Overall (STATE)
- 87 Strongly Landlord-Friendly
- State Texas
- 87 Strongly Landlord-Friendly · R+5
- County
- — inherits STATE
- City
- — inherits STATE
ZIP-level market 76443
- Home prices YoY
- 4.4%
- Active inventory
- 26
- Price-to-rent
- 19.3×
Monthly cashflow live
- Estimated rent
- $1,988 medium interval (Pro) →
- Mortgage (P&I)
- −$1,206
- Tax from tax record
- −$269 /mo · $3,227/yr
- Insurance
- −$96
- HOA
- −$0
- Vacancy / Maint / Mgmt
- −$417
- Net cashflow
- $-0
Break-even live
2-unit breakdown (identical units grouped — click to expand)
| Units | Beds | Baths | Est. rent |
|---|---|---|---|
| 2× units | 2 | — | $1,988 |
| #1 | 2 | — | $994 |
| #2 | 2 | — | $994 |
| Total (2 units) | $1,988 | ||
UW: 25.0% down · 7.5% · 30yr · 1.5% tax · 5.0% vac · 8.0% maint · 8.0% mgmt
Financing live
Cash to close
- Down payment
- $57,500
- Closing costs
- $6,900
- Reserves months
- —
- Total cash needed
- —
Loan-product check · same deal, 3 products live
Conventional
25% down · 7.5% · 30yr
- Down + closing
- —
- Monthly P&I
- —
- Monthly cashflow
- —
- DSCR
- —
- Eligible?
- —
Personal DTI + credit; lowest rate.
DSCR
20% down · 8.5% · 30yr
- Down + closing
- —
- Monthly P&I
- —
- Monthly cashflow
- —
- DSCR
- —
- Eligible?
- —
No personal income docs; deal must DSCR.
Hard money
10% down · 12.0% · 12mo
- Down + closing
- —
- Monthly P&I
- —
- Monthly cashflow
- —
- DSCR
- —
- Eligible?
- —
Short-term bridge; refi at stabilization.
Listing history 25 events
-
2026-06-18days on market $230,000 Active 181 DOM
-
2026-06-17days on market $230,000 Active 180 DOM
-
2026-06-16days on market $230,000 Active 179 DOM
-
2026-06-15days on market $230,000 Active 178 DOM
-
2026-06-13days on market $230,000 Active 176 DOM
-
2026-06-12days on market $230,000 Active 175 DOM
-
2026-06-09days on market $230,000 Active 172 DOM
-
2026-06-08days on market $230,000 Active 171 DOM
-
2026-06-08days on market $230,000 Active 170 DOM
-
2026-06-05days on market $230,000 Active 168 DOM
-
2026-06-03days on market $230,000 Active 166 DOM
-
2026-06-02days on market $230,000 Active 165 DOM
-
2026-06-01days on market $230,000 Active 164 DOM
-
2026-05-31days on market $230,000 Active 163 DOM
-
2025-12-18$230,000 Active 1396-char remark
Show marketing remark (1396 chars)
Income-Producing Duplex Portfolio - 4 Units - Cash Flowing Located at 217 Southeast 2nd Street in Cross Plains, this well-positioned two-building, four-unit duplex complex presents a compelling opportunity for investors seeking immediate cash flow with long-term upside. The property consists of two separate duplex buildings, offering operational flexibility and reduced risk through unit diversification. All four units are currently cash flowing, making this a true turnkey investment from day one. Recent improvements include minor updates to the HVAC systems, enhancing efficiency and reliability, as well as newer appliances throughout the units—helping to reduce near-term capital expenditures and support tenant retention. The layout and configuration appeal to long-term renters, while the separate building setup provides potential advantages for future value-add strategies, individual building disposition, or refinancing options. Highlights for Investors: Two buildings - four total units - duplex configuration Currently cash flowing Updated HVAC components Newer appliances Low-maintenance asset with stabilized income Strong fit for buy-and-hold or portfolio expansion This is an excellent opportunity to acquire a stabilized multifamily asset in a solid rental market, offering both immediate income and long-term appreciation potential.
-
2022-12-15soldstatus
-
2022-12-13soldstatus Closed 435-char remark
Show marketing remark (435 chars)
Great investment opportunity in Cross Plains TX! 2 newly built duplexes. One side is 2 one bedroom units and the other side was just remodeled into a 2 bedroom plus an efficiency unit making this a great turn key cash flowing asset at almost $2500 a month fully occupied! Both buildings built on steel frames and metal roofs with sound proof wall partitions. Motivated seller! Call for details and make your offer before it's too late!
-
2022-10-24status Pending 435-char remark
Show marketing remark (435 chars)
Great investment opportunity in Cross Plains TX! 2 newly built duplexes. One side is 2 one bedroom units and the other side was just remodeled into a 2 bedroom plus an efficiency unit making this a great turn key cash flowing asset at almost $2500 a month fully occupied! Both buildings built on steel frames and metal roofs with sound proof wall partitions. Motivated seller! Call for details and make your offer before it's too late!
-
2022-10-12historical Active Option Contract 435-char remark
Show marketing remark (435 chars)
Great investment opportunity in Cross Plains TX! 2 newly built duplexes. One side is 2 one bedroom units and the other side was just remodeled into a 2 bedroom plus an efficiency unit making this a great turn key cash flowing asset at almost $2500 a month fully occupied! Both buildings built on steel frames and metal roofs with sound proof wall partitions. Motivated seller! Call for details and make your offer before it's too late!
-
2022-06-08price $179,900 435-char remark
Show marketing remark (435 chars)
Great investment opportunity in Cross Plains TX! 2 newly built duplexes. One side is 2 one bedroom units and the other side was just remodeled into a 2 bedroom plus an efficiency unit making this a great turn key cash flowing asset at almost $2500 a month fully occupied! Both buildings built on steel frames and metal roofs with sound proof wall partitions. Motivated seller! Call for details and make your offer before it's too late!
-
2021-12-17$189,900 Active 435-char remark
Show marketing remark (435 chars)
Great investment opportunity in Cross Plains TX! 2 newly built duplexes. One side is 2 one bedroom units and the other side was just remodeled into a 2 bedroom plus an efficiency unit making this a great turn key cash flowing asset at almost $2500 a month fully occupied! Both buildings built on steel frames and metal roofs with sound proof wall partitions. Motivated seller! Call for details and make your offer before it's too late!
-
2019-08-25historical
-
2019-02-25$225,000 Active
-
2018-05-31soldstatus
-
2018-05-04soldstatus
ⓘ Source: listings_history table (triggers on properties + properties_extension) + one-shot
backfill from property_details.listing_events for pre-trigger history.
Tax reassessment forecast TX · Resets to sale price
- Current annual tax
- $3,227 · $269/mo
- Projected year-2 tax
- $4,209 · $351/mo
- Expected delta
- +$982/yr (+$82/mo · 30.4%)
ⓘ Screening estimate from a state-policy table — verify with the county assessor before closing.
Climate risk First Street
- Flood 4/10 Moderate FEMA zone X · 22% chance over 30 yrs
- Wildfire 7/10 Severe
- Heat 7/10 Severe 7 d/yr ≥104°F today · 23 d/yr by 30 yrs out
- Wind 4/10 Moderate 24% chance of damaging wind over 30 yrs
- Air quality 1/10 Low 0 unhealthy d/yr today · 0 by 30 yrs out
Nearby sold comps map
Loading sold comps map…
Walkable amenities ~0.75 mi
Loading nearby amenities…
Taxation est. · year 1
- Rental income
- $23,856
- − Mortgage interest
- −$12,884
- − Property taxes
- −$3,227
- − Insurance
- −$1,150
- − Repairs & maintenance
- −$1,908
- − Management
- −$1,908
- − Depreciation
- −$6,691
- Taxable loss
- −$3,912
- Est. tax savings @ 24.0%
- +$939
- After-tax cash flow
- $935/yr
For passive investors: Depreciation is non-cash, so a rental often shows a tax loss while cash-flowing — sheltering income. Rental losses are passive: they offset passive income freely, and up to $25,000/yr can offset ordinary (W-2) income if you actively participate and your MAGI is under $100k (phasing out to $0 by $150k); unused losses carry forward. On sale, claimed depreciation is recaptured at up to 25%, and gains may owe capital-gains tax (a 1031 exchange can defer both). Figures are a year-1 estimate at your 24.0% rate — not tax advice; consult a CPA.
Schools (NCES district)
- District
- Cross Plains ISD
- NCES district ID
- 4815810
- Math proficiency
- 45% ▼ -1.00%
- Reading proficiency
- 45% ▲ 1.00%
- Median HH income
- $37,187
- Composite
- 39.64/100
- National rank
- #8046
- State rank
- #581 of 1141 in TX
Livability — Cross Plains
- Score
- 68/100
- State rank
- #486
- US rank
- #9666
Category grades
Schools grade is shown separately in the Schools card above.
Census & demographics
- Census place
- Cross Plains, TX
- Population (ZIP)
- 1,812
Population outlook (Callahan County) Hauer SSP2
- Today (2025)
- 13,664 people
- By 2030
- 13,578 · -0.6%
- By 2040
- 13,283 · -2.8%
- By 2050
- 13,008 · -4.8%
- By 2075
- 12,354 · -9.6%
- By 2100
- 11,326 · -17.1%
Race, ethnicity, and origin ACS 2023
- Neighborhood character
- Predominantly White (90%)
- Race & ethnicity
- White 90% Two or more races 7% Hispanic / Latino 5%
- Common ancestry
- Italian 27% Serbian 4% Romanian 3%
- Languages at home
- 98% English-only · Spanish 2% French/Haitian/Cajun 1%
Political lean MEDSL · Callahan
- 2024 margin
- Solid R (+77.6) · D 10.9% · R 88.5%
- 2008→2024 swing
- -15.9pp toward R · 2008: -61.7pp · 2024: -77.6pp
- All cycles
- 2024: R+77.6 2020: R+77.3 2016: R+77.2 2012: R+69.8 2008: R+61.7
Not yet ingested
- Civics
- —
Market trends
- HPI YoY
- ▲ 6.88%
- Current HPI
- 161.931
- Rent YoY
- —
- Metro
- —
- State GDP YoY
- ▲ 3.95%
- F500 in state
- 110
Industry mix (Fortune 500 HQ in TX)
| Industry | F500 HQs | Revenue |
|---|---|---|
| Energy | 16 | $1,198B |
|
||
| Technology | 5 | $198B |
|
||
| Engineering / Construction | 4 | $72B |
|
||
| Energy Services | 3 | $60B |
|
||
| Utilities | 3 | $41B |
|
||
| Healthcare | 2 | $330B |
|
||
Price history
+2.2% since first listed11 events — show timeline
- 2025-12-18 Listed $230,000 NTREIS
- 2022-12-15 Sold (Public Records) — Public Records
- 2022-12-13 Sold (MLS) — NTREIS
- 2022-10-24 Pending — NTREIS
- 2022-10-12 Contingent — NTREIS
- 2022-06-08 Price Changed $179,900 NTREIS
- 2021-12-17 Listed $189,900 NTREIS
- 2019-08-25 Listing Removed — NTREIS
- 2019-02-25 Listed $225,000 NTREIS
- 2018-05-31 Sold (Public Records) — Public Records
- 2018-05-04 Sold (Public Records) — Public Records
Property tax history
+34.7%/yrLatest (2025): $3,227 · -13.3% YoY. Source: county tax records.
Cash-flow waterfall
monthlySold comps — $/sqft
last 12 mo · ≤1 miLoading sold comps…