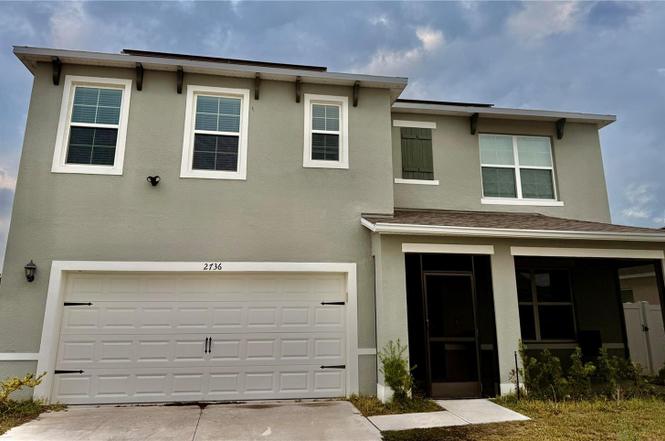
2736 Dumont Ln · Tavares, FL
Flood risk 1/10 · Minimal
- FEMA flood zone
- X (unshaded)
- Chance of flooding over 30 yrs
- 0.0%
- Est. flood insurance / yr
- $507 – $1,088
Fire risk 4/10 · Minor
- Est. fire insurance / yr
- $947 – $1,759
Heat risk 8/10 · Major
- Hot days now (above 107°F)
- 7 days/yr
- Hot days in 30 yrs
- 22 days/yr
Wind risk 9/10 · Severe
- Chance of severe wind over 30 yrs
- 99.0%
Air-quality risk 2/10 · Minimal
- Unhealthy air days now
- 1 days/yr
- Unhealthy air days in 30 yrs
- 1 days/yr
Risk factors via First Street. Map © Google.
Why this score? — see what drove the F grade
The composite is a weighted blend of 9 inputs, each scored 0–100. Each bar is that input's sub-score; the figure is the points it added to the 100-point composite (weight × sub-score).
- ARV discount +9.5/15.0
- Cash flow +7.4/30.0
- Schools +4.2/10.0
- Livability +3.8/5.0
- Rent growth +3.5/5.0
- 1% rule +2.5/10.0
- Condition / age +2.5/5.0
- DSCR +1.5/10.0
- Appreciation +0.0/10.0
$350,000
🖨 Deal sheet 📄 Offer letter ✓ Due diligence
Listing remarks
Short Sale. Welcome to 2736 Dumont Lane, located in the desirable Greenbrier community of Tavares, Florida. Built in 2022 by D. R. Horton, this spacious Hayden “H” model offers 2,601 sq ft of living space with 5 bedrooms and 3 full bathrooms. The home features an open floor plan ideal for entertaining, a well-appointed kitchen overlooking the main living area, and a first-floor bedroom with full bath, perfect for guests or multigenerational living. The remaining bedrooms, including a generous second-floor primary suite with walk-in closet, are privately situated upstairs. Flooring includes ceramic tiles and carpet, with sliding doors leading to the backyard. ALL FENCED IN B
Key facts
- Open floor plan
- First-floor bedroom
- Fenced in backyard
Tags
Property features AI
Finance
- Other: Living area approximately 2,674 (public records); Total building area approximately 3,244 (public records); Lot about 0.17 acres (0 to less than 1/4 acre); Green energy: Solar
- HOA & community: Has HOA (no association fees required); Street lights in community; Pets allowed
Exterior
- Parking: Attached garage (2 spaces)
- Utilities: Public water; Public sewer; Electricity connected; Underground utilities; Cable available; Phone available; BB/HS internet available; Fire hydrant nearby; Water connected; Sewer connected
- Home design: Single family residence; Two levels; Faces south
- Construction: Block and stucco construction; Shingle roof; Slab foundation; Built by D.R. Horton, Inc. (Hayden "H" model)
- Exterior features: Lighting; Sidewalk; Sliding doors; Pond view
Interior
- Kitchen: Dishwasher; Disposal; Microwave; Range; Range hood; Refrigerator; Exhaust fan; Electric water heater; Water softener
- Bedrooms: 5 bedrooms
- Flooring: Carpet; Ceramic tile
- Bathrooms: 3 full bathrooms
- Heating & cooling: Central heating (electric); Central air
- Interior features: Ceiling fans; Kitchen/family room combo; Living room/dining room combo; Thermostat; Walk-in closets
- Laundry & utility: Washer; Dryer; Laundry inside
Neighborhood map
What this means for you Summary
Snapshot
- This is a 5-bed/3.0-bath single-family listed at $350k.
Deal economics
- At list price, monthly cash flow is $-459 ($-6k/yr) — negative.
- To cash-flow at today's rent, offer at most $269k (23.1% below list).
- To meet the 1% rule (rent ≥ 1% of price), the offer needs to be $262k (25.2% below list).
- Recommended offer: $262k (25.2% below list) — sets the bar for 1% rule.
Location & tenants
- Location reads 76/100 on livability (#220 in FL, #3,464 nationally) — a middle-class / working-renter tenant base. Strengths: crime A+, cost of living A+, housing A+; Watch: employment D, amenities F, commute F.
- Lake (suburban): math 49% / reading 50% proficiency, ranked #37 of 73 in FL (top 51%) — families likely to look elsewhere, expect single-tenant / working-renter base with shorter leases.
- Zoned schools: Tavares Elementary School (math 49% / reading 45%, grade D-, #1,191 of 2,144 statewide, top 57%, 875 students, 61% FRL); Tavares High School (math 32% / reading 40%, grade F, #359 of 667 statewide, top 55%, 1,507 students, 45% FRL) — zoned schools at 53% FRL track the district average.
- Market conditions: Rents rising fast (+4.0%/yr); 501 active listings in the ZIP; 3 comparable units currently listed for rent nearby; rentals leasing fast (median 5d on market — plan ~1-2 weeks tenant-placement turnaround); 4,799 units permitted in Lake County in 2024 (814 in 5+ unit buildings).
- At $2,619/mo this rent would consume 50% of the median local household income ($63k/yr) (locally 586% of renters already pay >50% of income on rent) — very limited rent-growth headroom before tenants either downsize or default.
Forward outlook
- Local home prices are declining (-3.0%/yr); year-one equity from $2k of loan paydown is wiped out by about $10k of value loss. Plan a longer hold.
- Lake County population projected at +37% by 2050 — long-run rental-demand tailwind backs the buy-and-hold thesis.
Negotiation context
- It's been on market 163 days — a 12% lower offer ($308k) is reasonable based on typical stale-listing flexibility.
- 4 sale attempts since 4y ago with the ask held roughly flat each time — persistent listings suggest the price (not the market) is what's stuck; bring a comps-based counter.
Risks & watch-outs
- Climate carrying-cost: severe wind risk, 99% chance of damaging wind over 30y; extreme-heat days projected 7→22/yr by 2055 (HVAC capex compounding) — expect insurance premiums to compound above CPI over the hold.
Questions for the listing agent
- What do current leases actually rent for vs. the listed asking? Can we see a recent rent roll and the last 12 months of T-12 income?
- It's been on market 163 days. Have you received any prior offers? Is the seller open to a 25% concession, seller financing, or rate buy-down credit?
- Why hasn't it sold? Are there any deal-killer items the seller is aware of (foundation, flood, title, zoning, code violations)?
- Is there a deadline driving the sale (1031 exchange, divorce, estate, relocation)? That informs how much negotiation room exists.
- The area grade is low — what's the realistic commute time and amenity access for the typical tenant pool here? Any planned neighborhood developments (good or bad) we should know about?
- What's the average days-on-market for RENTAL listings here right now (not sales)? A rising rental-DOM trend means longer vacancies and softer asking-rent achievability than the comps imply.
- What's the recent tenant-quality profile in this submarket — average credit score on applications, eviction rate, late-payment / NSF rate, and stable-employment percentage? A property-management company in the area should have these aggregated.
- How much new for-sale + rental construction is in the pipeline within 1–3 miles? Heavy new supply typically softens prices + rents 12–24 months out; constrained supply supports both.
Investment metrics
- 1% rule
- 0.75% ✗
- Cap rate
- 4.72%
- Cash-on-cash
- -5.62%
- DSCR
- 0.75
- GRM
- 11.1
CMA / ARV
- ARV (on-the-fly)
- $366,338
- Comps found
- 2
Show comp detail 2 sales within ~0.75 mi
| Address | Dist | Beds/Ba | Sqft | Sold | Price | $/sf | Match |
|---|---|---|---|---|---|---|---|
| 2365 Martins Run | 0.42mi | 4/2.5 (-1) | 2,547 (-5%) | 9mo | $350,000 | $137 | 58 |
| 2382 Norwood Pl | 0.32mi | 4/2.5 (-1) | 2,399 (-10%) | 7mo | $329,500 | $137 | 55 |
Match score weights: distance 35% · size 25% · config 20% · recency 20%. Top-matched comps best support the ARV.
Projected returns pro-forma
-3.0% appreciation · 4.05% rent growth · sell at horizon
- IRR
- -24.6%
- Equity multiple
- 0.15×
- Total profit
- $-83,024
- Equity at exit
- $52,186
- IRR
- -17.3%
- Equity multiple
- 0.00×
- Total profit
- $-97,756
- Equity at exit
- $30,262
Cash invested: $98,000 (down + closing). Projections, not guarantees.
Landlord ↔ Tenant lean methodology
- Overall (STATE)
- 87 Strongly Landlord-Friendly
- State Florida
- 87 Strongly Landlord-Friendly · R+3
- County
- — inherits STATE
- City
- — inherits STATE
ZIP-level market 32778
- Home prices YoY
- -23.4%
- Rents YoY
- 4.0%
- Active inventory
- 501
- Price-to-rent
- 11.1×
Monthly cashflow live
- Estimated rent
- $2,619 medium interval (Pro) →
- Mortgage (P&I)
- −$1,835
- Tax from tax record
- −$547 /mo · $6,561/yr
- Insurance
- −$146
- HOA
- −$0
- Vacancy / Maint / Mgmt
- −$550
- Net cashflow
- $-459
Break-even live
UW: 25.0% down · 7.5% · 30yr · 1.5% tax · 5.0% vac · 8.0% maint · 8.0% mgmt
Financing live
Cash to close
- Down payment
- $87,500
- Closing costs
- $10,500
- Reserves months
- —
- Total cash needed
- —
Loan-product check · same deal, 3 products live
Conventional
25% down · 7.5% · 30yr
- Down + closing
- —
- Monthly P&I
- —
- Monthly cashflow
- —
- DSCR
- —
- Eligible?
- —
Personal DTI + credit; lowest rate.
DSCR
20% down · 8.5% · 30yr
- Down + closing
- —
- Monthly P&I
- —
- Monthly cashflow
- —
- DSCR
- —
- Eligible?
- —
No personal income docs; deal must DSCR.
Hard money
10% down · 12.0% · 12mo
- Down + closing
- —
- Monthly P&I
- —
- Monthly cashflow
- —
- DSCR
- —
- Eligible?
- —
Short-term bridge; refi at stabilization.
Rent comps 3 comps
| Address | Beds | Baths | Sqft | Rent | $/sqft | DOM | Units | Dist |
|---|---|---|---|---|---|---|---|---|
| 117 Juniper Way Tavares, FL | 4.0 | 3.0 | 2432 | $2,150 | $0.88 | 4d | 1 | 0.18mi |
| 4659 Treasure Cay Rd Tavares, FL | 4.0 | 2.0 | 1751 | $2,125 | $1.21 | 5d | 1 | 0.44mi |
| 2114 Rockmart Loop Tavares, FL | 5.0 | 2.5 | 2889 | $2,600 | $0.90 | 24d | 1 | 1.33mi |
Listing history 24 events
-
2026-06-18days on market $350,000 Active 163 DOM
-
2026-06-17days on market $350,000 Active 162 DOM
-
2026-06-16days on market $350,000 Active 161 DOM
-
2026-06-15days on market $350,000 Active 160 DOM
-
2026-06-13days on market $350,000 Active 158 DOM
-
2026-06-09days on market $350,000 Active 154 DOM
-
2026-06-08days on market $350,000 Active 153 DOM
-
2026-06-07days on market $350,000 Active 152 DOM
-
2026-06-04days on market $350,000 Active 149 DOM
-
2026-06-03days on market $350,000 Active 148 DOM
-
2026-06-02days on market $350,000 Active 147 DOM
-
2026-06-02days on market $350,000 Active 146 DOM
-
2026-05-31days on market $350,000 Active 145 DOM
-
2026-02-04price $350,000
-
2026-01-06$355,000 Active
-
2025-06-03historical
-
2025-05-01price $370,000
-
2025-03-14$412,000 Active
-
2025-01-13$420,000 Active
-
2023-03-31soldstatus $380,990 Closed
-
2022-12-27status Pending
-
2022-10-26price $380,990
-
2022-10-13price $385,990
-
2022-10-12$395,990 Active
ⓘ Source: listings_history table (triggers on properties + properties_extension) + one-shot
backfill from property_details.listing_events for pre-trigger history.
Tax reassessment forecast FL · Resets to sale price
- Current annual tax
- $6,561 · $547/mo
- Projected year-2 tax
- $6,561 · $547/mo
- Expected delta
- $0/yr ($0/mo · 0.0%)
ⓘ Screening estimate from a state-policy table — verify with the county assessor before closing.
Climate risk First Street
- Flood 1/10 Low FEMA zone X (unshaded) · 0% chance over 30 yrs
- Wildfire 4/10 Moderate
- Heat 8/10 Severe 7 d/yr ≥107°F today · 22 d/yr by 30 yrs out
- Wind 9/10 Extreme 99% chance of damaging wind over 30 yrs
- Air quality 2/10 Low 1 unhealthy d/yr today · 1 by 30 yrs out
Nearby sold comps map
Loading sold comps map…
Walkable amenities ~0.75 mi
Loading nearby amenities…
Taxation est. · year 1
- Rental income
- $31,433
- − Mortgage interest
- −$19,605
- − Property taxes
- −$6,561
- − Insurance
- −$1,750
- − Repairs & maintenance
- −$2,515
- − Management
- −$2,515
- − Depreciation
- −$10,182
- Taxable loss
- −$11,694
- Est. tax savings @ 24.0%
- +$2,807
- After-tax cash flow
- $-2,697/yr
For passive investors: Depreciation is non-cash, so a rental often shows a tax loss while cash-flowing — sheltering income. Rental losses are passive: they offset passive income freely, and up to $25,000/yr can offset ordinary (W-2) income if you actively participate and your MAGI is under $100k (phasing out to $0 by $150k); unused losses carry forward. On sale, claimed depreciation is recaptured at up to 25%, and gains may owe capital-gains tax (a 1031 exchange can defer both). Figures are a year-1 estimate at your 24.0% rate — not tax advice; consult a CPA.
Schools (NCES district)
- District
- Lake
- NCES district ID
- 1201050
- Math proficiency
- 49% ▼ -7.00%
- Reading proficiency
- 50% ▼ -4.00%
- Median HH income
- $46,632
- Composite
- 42.05/100
- National rank
- #3327
- State rank
- #37 of 73 in FL
Livability — Tavares
- Score
- 76/100
- State rank
- #220
- US rank
- #3464
Category grades
Schools grade is shown separately in the Schools card above.
Census & demographics
- Census place
- Tavares, FL
- County
- Lake County · 364,602 people
- City population
- 25,042
- Metro
- Orlando-Kissimmee-Sanford, FL
- Population (ZIP)
- 25,042
- Household income
- $63,472
- Rent vs Own
- Severe rent burden
- 586.0
Population outlook (Lake County) Hauer SSP2
- Today (2025)
- 386,640 people
- By 2030
- 417,107 · +7.9%
- By 2040
- 476,676 · +23.3%
- By 2050
- 531,296 · +37.4%
- By 2075
- 648,303 · +67.7%
- By 2100
- 698,530 · +80.7%
Race, ethnicity, and origin ACS 2023
- Neighborhood character
- Predominantly White (72%)
- Race & ethnicity
- White 72% Hispanic / Latino 14% Two or more races 8% Black 8% Asian 2%
- Hispanic origin (detail)
- Mexican 1% Puerto Rican 7% Cuban 2% Dominican 1%
- Common ancestry
- Romanian 4% Italian 3% Slovak 2%
- Foreign-born
- 9% · Canada, Dominican Republic, Jamaica
- Languages at home
- 85% English-only · Spanish 11% Other Indo-European 2% Other Asian/Pacific 1%
Political lean MEDSL · Lake
- 2024 margin
- Strong R (+24.7) · D 37.3% · R 62.0%
- 2008→2024 swing
- -11.2pp toward R · 2008: -13.5pp · 2024: -24.7pp
- All cycles
- 2024: R+24.7 2020: R+20.0 2016: R+23.1 2012: R+17.1 2008: R+13.5
Not yet ingested
- Civics
- —
Market trends
- HPI YoY
- ▼ -88.07%
- Current HPI
- 288.7123
- Rent YoY
- ▲ 4.05%
- Metro
- Orlando-Kissimmee-Sanford, FL
- State GDP YoY
- ▲ 3.28%
- F500 in state
- 36
Industry mix (Fortune 500 HQ in FL)
| Industry | F500 HQs | Revenue |
|---|---|---|
| Industrial Technology | 2 | $29B |
|
||
| Insurance | 2 | $17B |
|
||
| Retail | 1 | $60B |
|
||
| Technology Distribution | 1 | $58B |
|
||
| Homebuilding | 1 | $35B |
|
||
| Technology Manufacturing | 1 | $35B |
|
||
Price history
-11.6% since first listed11 events — show timeline
- 2026-02-04 Price Changed $350,000 Stellar MLS as Distributed by MLS Grid
- 2026-01-06 Listed $355,000 Stellar MLS as Distributed by MLS Grid
- 2025-06-03 Listing Removed — Stellar MLS as Distributed by MLS Grid
- 2025-05-01 Price Changed $370,000 Stellar MLS as Distributed by MLS Grid
- 2025-03-14 Listed $412,000 Stellar MLS as Distributed by MLS Grid
- 2025-01-13 Listed $420,000 Stellar MLS as Distributed by MLS Grid
- 2023-03-31 Sold (MLS) $380,990 Stellar MLS as Distributed by MLS Grid
- 2022-12-27 Pending — Stellar MLS as Distributed by MLS Grid
- 2022-10-26 Price Changed $380,990 Stellar MLS as Distributed by MLS Grid
- 2022-10-13 Price Changed $385,990 Stellar MLS as Distributed by MLS Grid
- 2022-10-12 Listed $395,990 Stellar MLS as Distributed by MLS Grid
Property tax history
+99.9%/yrLatest (2025): $6,561 · -1.0% YoY. Source: county tax records.
Cash-flow waterfall
monthlySold comps — $/sqft
last 12 mo · ≤1 miLoading sold comps…