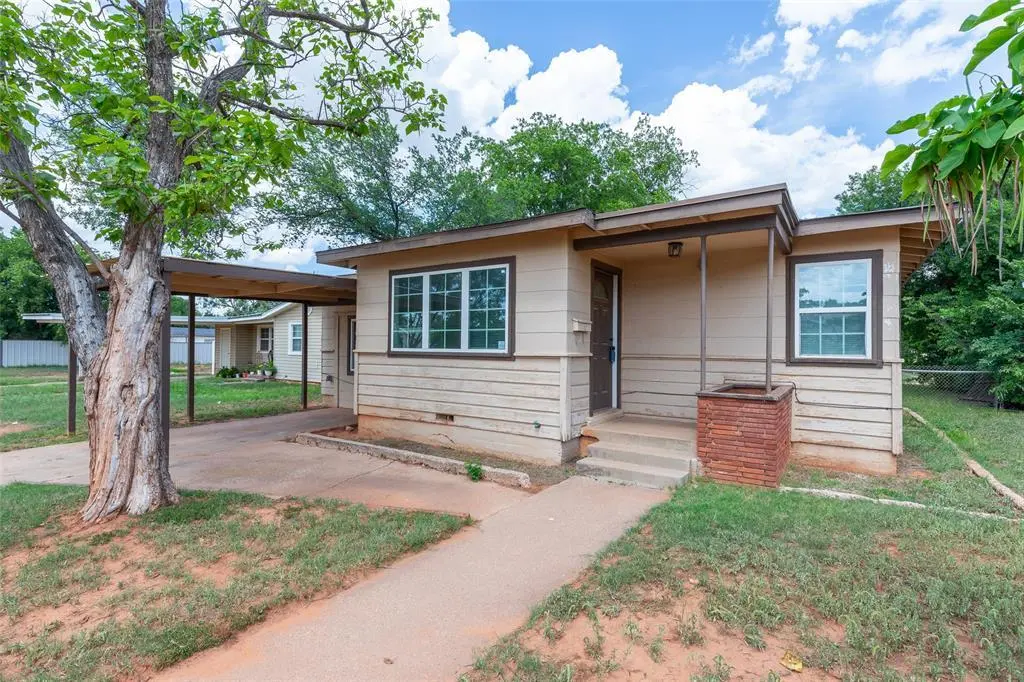
1341 Fannin St · Abilene, TX
Flood risk 1/10 · Minimal
- FEMA flood zone
- X (shaded)
- Chance of flooding over 30 yrs
- 0.0%
- Est. flood insurance / yr
- $507 – $1,088
Fire risk 3/10 · Minor
- Est. fire insurance / yr
- $1,222 – $2,270
Heat risk 7/10 · Major
- Hot days now (above 104°F)
- 7 days/yr
- Hot days in 30 yrs
- 23 days/yr
Wind risk 4/10 · Minor
- Chance of severe wind over 30 yrs
- 11.0%
Air-quality risk 1/10 · Minimal
- Unhealthy air days now
- 0 days/yr
- Unhealthy air days in 30 yrs
- 0 days/yr
Risk factors via First Street. Map © Google.
Why this score? — see what drove the B grade
The composite is a weighted blend of 9 inputs, each scored 0–100. Each bar is that input's sub-score; the figure is the points it added to the 100-point composite (weight × sub-score).
- Cash flow +30.0/30.0
- ARV discount +10.8/15.0
- DSCR +10.0/10.0
- 1% rule +9.8/10.0
- Rent growth +5.0/5.0
- Livability +3.8/5.0
- Schools +2.8/10.0
- Condition / age +2.5/5.0
- Appreciation +0.0/10.0
$143,000
🖨 Deal sheet (PDF) 📄 Offer letter ✓ Due diligence
Listing remarks
Move-in ready 3-bedroom, 1-bath home with fresh interior paint, updated flooring, and an updated bathroom featuring a new shower surround. This property offers an affordable opportunity for homeowners and investors alike. With continued growth and major development projects expanding throughout the Abilene area, including nearby AI and data infrastructure investments, demand for workforce housing remains strong. Whether you're looking to add to your rental portfolio or secure a property with long-term upside potential, this home is ready for its next owner. Sold as-is.
Key facts
- Updated flooring
- Fresh interior paint
- New shower surround
Tags
Property features AI
Finance
- Other: Lot is approximately 0.134 acres (less than 0.5 acre); Subdivision: Crescent Heights; Directions: From I-20, take the Grape Street exit and head south on Grape Street. Turn left onto N. 10th Street, then right onto Fannin Street. Property will be on the left.
- Financial info: Listing accepts Cash and Conventional financing; No second mortgage
- HOA & community: No association
Exterior
- Parking: Attached carport; 1 covered parking space; 1 carport space
- Security: No specific security features provided
- Utilities: Municipal utility district; Utilities include alley
- Home design: Single-family residence; Residential property; One story
- Construction: Built in 1952
- Exterior features: Alley access
Interior
- Kitchen: Electric range
- Bedrooms: 3 bedrooms (primary bedroom on main level)
- Flooring: No flooring details provided
- Bathrooms: 1 full bathroom
- Heating & cooling: Central heating
- Interior features: One-level layout; Two total main rooms (living and dining); Other interior features
- Laundry & utility: No specific laundry details provided
Neighborhood map
What this means for you Summary
Snapshot
- This is a 3-bed/1.0-bath single-family listed at $143k.
Deal economics
- At list price, monthly cash flow is $745 ($9k/yr) — positive.
- The deal already cash-flows at list — no discount required.
- Meets the 1% rule at list price ($2k rent vs $143k).
- Cap rate 12.5% vs local median 6.8% in Abilene — top-decile yield for the area; either an underpriced asset or a hidden risk that comps aren't pricing in. Stress-test before assuming the spread holds.
Location & tenants
- Location reads 75/100 on livability (#142 in TX, #4,037 nationally) — a middle-class / working-renter tenant base. Strengths: cost of living A+, housing A+, health & safety A+; Watch: crime D, commute F.
- Abilene ISD (urban): math 32% / reading 34% proficiency, ranked #575 of 826 in TX (top 70%) — families likely to look elsewhere, expect single-tenant / working-renter base with shorter leases.
- Zoned schools: Martinez El (math 30% / reading 23%, grade F, #2,927 of 4,322 statewide, top 68%, 412 students, 94% FRL) — zoned schools average 94% FRL vs 57% district-wide (37 pts higher); higher-poverty schools than district average — tighter screening recommended.
- Market conditions: Rents rising fast (+40.2%/yr); 87 active listings in the ZIP; 8 comparable units currently listed for rent nearby; rentals at typical pace (median 15d on market — plan ~3-4 weeks tenant-placement turnaround); 508 units permitted in Taylor County in 2024 (0 in 5+ unit buildings).
- At $2,119/mo this rent would consume 48% of the median local household income ($54k/yr) (locally 662% of renters already pay >50% of income on rent) — very limited rent-growth headroom before tenants either downsize or default.
Forward outlook
- Local home prices are declining (-3.0%/yr); year-one equity from $989 of loan paydown is wiped out by about $4k of value loss. Plan a longer hold.
- Taylor County population projected at +16% by 2050 — long-run rental-demand tailwind backs the buy-and-hold thesis.
- At projected returns (-3.0% appreciation + 8.0% rent growth), your $40k cash investment doubles in ~5 years — after that, you're playing with house money.
Negotiation context
- Only 12 days on market — expect competitive offers; lowballing is unlikely to land.
Risks & watch-outs
- Watch-outs: built in 1952 — expect roof / HVAC / electrical / plumbing capex.
- Climate carrying-cost: extreme-heat days projected 7→23/yr by 2055 (HVAC capex compounding) — expect insurance premiums to compound above CPI over the hold.
Questions for the listing agent
- Built in 1952 — when were the roof, HVAC, electrical panel, plumbing, and water heater last replaced?
- Is there a deadline driving the sale (1031 exchange, divorce, estate, relocation)? That informs how much negotiation room exists.
- Schools are D-rated, which usually means shorter tenancies and higher turnover. Who's the typical renter profile here, and what's been the actual vacancy rate?
- Crime grade is D in this area — have there been break-ins, vandalism, or insurance claims at this property in the last 3 years? What carrier currently insures it and at what premium?
- What's the average days-on-market for RENTAL listings here right now (not sales)? A rising rental-DOM trend means longer vacancies and softer asking-rent achievability than the comps imply.
- What's the recent tenant-quality profile in this submarket — average credit score on applications, eviction rate, late-payment / NSF rate, and stable-employment percentage? A property-management company in the area should have these aggregated.
- How much new for-sale + rental construction is in the pipeline within 1–3 miles? Heavy new supply typically softens prices + rents 12–24 months out; constrained supply supports both.
Investment metrics
- 1% rule
- 1.48% ✓
- Cap rate
- 12.54%
- Cash-on-cash
- 22.32%
- DSCR
- 1.99
- GRM
- 5.6
CMA / ARV
- ARV (on-the-fly)
- $154,290
- Comps found
- 12
Show comp detail 12 sales within ~0.75 mi
| Address | Dist | Beds/Ba | Sqft | Sold | Price | $/sf | Match |
|---|---|---|---|---|---|---|---|
| 1700 Westview Dr | 0.43mi | 3/1.0 | 1,116 (+0%) | 0mo | $189,900 | $170 | 79 |
| 849 Green St | 0.42mi | 3/1.0 | 1,134 (+2%) | 1mo | $99,999 | $88 | 76 |
| 941 Westmoreland St | 0.38mi | 3/2.0 | 1,080 (-3%) | 1mo | $129,900 | $120 | 73 |
| 1757 Briarwood St | 0.41mi | 3/1.0 | 1,184 (+7%) | 1mo | $70,000 | $59 | 69 |
| 1733 N Mockingbird Ln | 0.34mi | 3/2.0 | 1,006 (-9%) | 1mo | $181,500 | $180 | 64 |
| 1350 Lillius St | 0.55mi | 2/1.0 (-1) | 1,076 (-3%) | 1mo | $150,000 | $139 | 63 |
| 1950 Fannin St | 0.45mi | 2/1.0 (-1) | 1,048 (-6%) | 2mo | $157,500 | $150 | 63 |
| 1461 Glenhaven Dr | 0.40mi | 3/1.5 | 1,210 (+9%) | 2mo | $129,900 | $107 | 63 |
| 1725 Graham St | 0.61mi | 3/1.0 | 1,050 (-5%) | 1mo | $169,900 | $162 | 62 |
| 872 Forrest Ave | 0.48mi | 2/1.0 (-1) | 1,032 (-7%) | 2mo | $130,000 | $126 | 59 |
| 1448 Glenhaven Dr | 0.42mi | 3/1.5 | 1,272 (+15%) | 1mo | $199,900 | $157 | 54 |
| 617 Briarwood St | 0.67mi | 3/1.5 | 1,246 (+12%) | 0mo | $170,000 | $136 | 46 |
Match score weights: distance 35% · size 25% · config 20% · recency 20%. Top-matched comps best support the ARV.
Projected returns pro-forma
-3.0% appreciation · 8.0% rent growth · sell at horizon
- IRR
- 20.5%
- Equity multiple
- 1.89×
- Total profit
- $35,452
- Equity at exit
- $21,322
- IRR
- 31.8%
- Equity multiple
- 4.57×
- Total profit
- $142,886
- Equity at exit
- $12,364
Cash invested: $40,040 (down + closing). Projections, not guarantees.
Landlord ↔ Tenant lean methodology
- Overall (STATE)
- 87 Strongly Landlord-Friendly
- State Texas
- 87 Strongly Landlord-Friendly · R+5
- County
- — inherits STATE
- City
- — inherits STATE
ZIP-level market 79603
- Home prices YoY
- -32.5%
- Rents YoY
- 40.2%
- Active inventory
- 87
- Price-to-rent
- 5.6×
Monthly cashflow live
- Estimated rent
- $2,119 high interval (Pro) →
- Mortgage (P&I)
- −$750
- Tax from tax record
- −$119 /mo · $1,433/yr
- Insurance
- −$60
- HOA
- −$0
- Vacancy / Maint / Mgmt
- −$445
- Net cashflow
- $745
Break-even live
Sensitivity live
| Price | -10% $826 | -5% $785 | +0% $745 | +5% $704 | +10% $664 |
|---|---|---|---|---|---|
| Rent | -10% $577 | -5% $661 | +0% $745 | +5% $828 | +10% $912 |
| Rate | -1.0pp $817 | -0.5pp $781 | base $745 | +0.5pp $708 | +1.0pp $670 |
UW: 25.0% down · 7.5% · 30yr · 1.5% tax · 5.0% vac · 8.0% maint · 8.0% mgmt
Financing live
Cash to close
- Down payment
- $35,750
- Closing costs
- $4,290
- Reserves months
- —
- Total cash needed
- —
Loan-product check · same deal, 3 products live
Conventional
25% down · 7.5% · 30yr
- Down + closing
- —
- Monthly P&I
- —
- Monthly cashflow
- —
- DSCR
- —
- Eligible?
- —
Personal DTI + credit; lowest rate.
DSCR
20% down · 8.5% · 30yr
- Down + closing
- —
- Monthly P&I
- —
- Monthly cashflow
- —
- DSCR
- —
- Eligible?
- —
No personal income docs; deal must DSCR.
Hard money
10% down · 12.0% · 12mo
- Down + closing
- —
- Monthly P&I
- —
- Monthly cashflow
- —
- DSCR
- —
- Eligible?
- —
Short-term bridge; refi at stabilization.
Rent comps 8 comps
| Address | Beds | Baths | Sqft | Rent | $/sqft | DOM | Units | Dist |
|---|---|---|---|---|---|---|---|---|
| 1481 Burger St Abilene, TX | 3.0 | 2.0 | 1330 | $2,400 | $1.80 | 22d | 1 | 0.17mi |
| 1685 N Willis St Abilene, TX | 3.0 | 2.0 | 1349 | $1,800 | $1.33 | 22d | 1 | 0.51mi |
| 3296 Sandefer St Abilene, TX | 4.0 | 1.0 | 1360 | $1,950 | $1.43 | 15d | 1 | 0.78mi |
| 1638 Merchant St Abilene, TX | 3.0 | 2.0 | 1328 | $2,895 | $2.18 | 15d | 1 | 0.89mi |
| 2410 N Willis St Abilene, TX | 2.0 | 1.0 | 864 | $1,200 | $1.39 | 45d | 1 | 1.04mi |
| 2498 Yorktown Dr Abilene, TX | 3.0 | 1.5 | 1104 | $1,795 | $1.63 | 15d | 1 | 1.16mi |
| 234 Clyde St Abilene, TX | 3.0 | 1.0 | 998 | $1,995 | $2.00 | 15d | 1 | 1.23mi |
| 2850 S 5th St Abilene, TX | 4.0 | 2.0 | 1175 | $1,995 | $1.70 | 15d | 1 | 1.32mi |
Listing history 10 events
-
2026-06-15status $143,000 Pending 12 DOM
-
2026-06-15pricedays on market $143,000 Active Option Contract 12 DOM
-
2026-06-14days on market $130,000 Active Option Contract 10 DOM
-
2026-06-13days on market $130,000 Active Option Contract 9 DOM
-
2026-06-10days on market $130,000 Active Option Contract 7 DOM
-
2026-06-09days on market $130,000 Active Option Contract 6 DOM
-
2026-06-08days on market $130,000 Active Option Contract 5 DOM
-
2026-06-07statusdays on market $130,000 Active Option Contract 4 DOM
-
2026-06-03remarks 575-char remark
-
2026-06-03$130,000 Active 1 DOM
ⓘ Source: listings_history table (triggers on properties + properties_extension) + one-shot
backfill from property_details.listing_events for pre-trigger history.
Tax reassessment forecast TX · Resets to sale price
- Current annual tax
- $1,433 · $119/mo
- Projected year-2 tax
- $2,617 · $218/mo
- Expected delta
- +$1,184/yr (+$99/mo · 82.6%)
ⓘ Screening estimate from a state-policy table — verify with the county assessor before closing.
Climate risk First Street
- Flood 1/10 Low FEMA zone X (shaded) · 0% chance over 30 yrs
- Wildfire 3/10 Moderate
- Heat 7/10 Severe 7 d/yr ≥104°F today · 23 d/yr by 30 yrs out
- Wind 4/10 Moderate 11% chance of damaging wind over 30 yrs
- Air quality 1/10 Low 0 unhealthy d/yr today · 0 by 30 yrs out
Nearby sold comps map
Loading sold comps map…
Walkable amenities ~0.75 mi
Loading nearby amenities…
Taxation est. · year 1
- Rental income
- $25,422
- − Mortgage interest
- −$8,010
- − Property taxes
- −$1,433
- − Insurance
- −$715
- − Repairs & maintenance
- −$2,034
- − Management
- −$2,034
- − Depreciation
- −$4,160
- Taxable income
- $7,037
- Est. tax owed @ 24.0%
- −$1,689
- After-tax cash flow
- $7,248/yr
For passive investors: Depreciation is non-cash, so a rental often shows a tax loss while cash-flowing — sheltering income. Rental losses are passive: they offset passive income freely, and up to $25,000/yr can offset ordinary (W-2) income if you actively participate and your MAGI is under $100k (phasing out to $0 by $150k); unused losses carry forward. On sale, claimed depreciation is recaptured at up to 25%, and gains may owe capital-gains tax (a 1031 exchange can defer both). Figures are a year-1 estimate at your 24.0% rate — not tax advice; consult a CPA.
Schools (NCES district)
- District
- Abilene ISD
- NCES district ID
- 4807440
- Math proficiency
- 32% ▼ -11.00%
- Reading proficiency
- 34% ▼ -5.00%
- Median HH income
- $39,782
- Composite
- 27.71/100
- National rank
- #6909
- State rank
- #575 of 826 in TX
Livability — Abilene
- Score
- 75/100
- State rank
- #142
- US rank
- #4037
Category grades
Schools grade is shown separately in the Schools card above.
Census & demographics
- Census place
- Abilene, TX
- County
- Taylor County · 136,672 people
- City population
- 136,672
- Metro
- Abilene, TX
- Population (ZIP)
- 23,548
- Household income
- $53,513
- Rent vs Own
- Severe rent burden
- 662.0
Population outlook (Taylor County) Hauer SSP2
- Today (2025)
- 145,270 people
- By 2030
- 150,050 · +3.3%
- By 2040
- 159,417 · +9.7%
- By 2050
- 168,883 · +16.3%
- By 2075
- 194,436 · +33.8%
- By 2100
- 203,163 · +39.9%
Race, ethnicity, and origin ACS 2023
- Neighborhood character
- Diverse neighborhood (Simpson 0.60)
- Race & ethnicity
- Hispanic / Latino 48% White 40% Two or more races 24% Black 8%
- Hispanic origin (detail)
- Mexican 44%
- Common ancestry
- Italian 2% Slovak 2% Portuguese 1%
- Foreign-born
- 9% · Canada
- Languages at home
- 73% English-only · Spanish 25%
Political lean MEDSL · Taylor
- 2024 margin
- Solid R (+49.8) · D 24.6% · R 74.4% · Other 1.0%
- 2008→2024 swing
- -4.2pp toward R · 2008: -45.6pp · 2024: -49.8pp
- All cycles
- 2024: R+49.8 2020: R+45.3 2016: R+51.1 2012: R+53.6 2008: R+45.6
Not yet ingested
- Civics
- —
Market trends
- HPI YoY
- ▼ -88.84%
- Current HPI
- 184.8875
- Rent YoY
- ▲ 40.19%
- Metro
- Abilene, TX
- State GDP YoY
- ▲ 3.95%
- F500 in state
- 110
Industry mix (Fortune 500 HQ in TX)
| Industry | F500 HQs | Revenue |
|---|---|---|
| Energy | 16 | $1,198B |
|
||
| Technology | 5 | $198B |
|
||
| Engineering / Construction | 4 | $72B |
|
||
| Energy Services | 3 | $60B |
|
||
| Utilities | 3 | $41B |
|
||
| Healthcare | 2 | $330B |
|
||
Price history
1 event — show timeline
- 2026-06-03 Listed $130,000 NTREIS
Property tax history
+7.2%/yrLatest (2025): $1,433 · +7.4% YoY. Source: county tax records.
Cash-flow waterfall
monthlySold comps — $/sqft
last 12 mo · ≤1 miLoading sold comps…