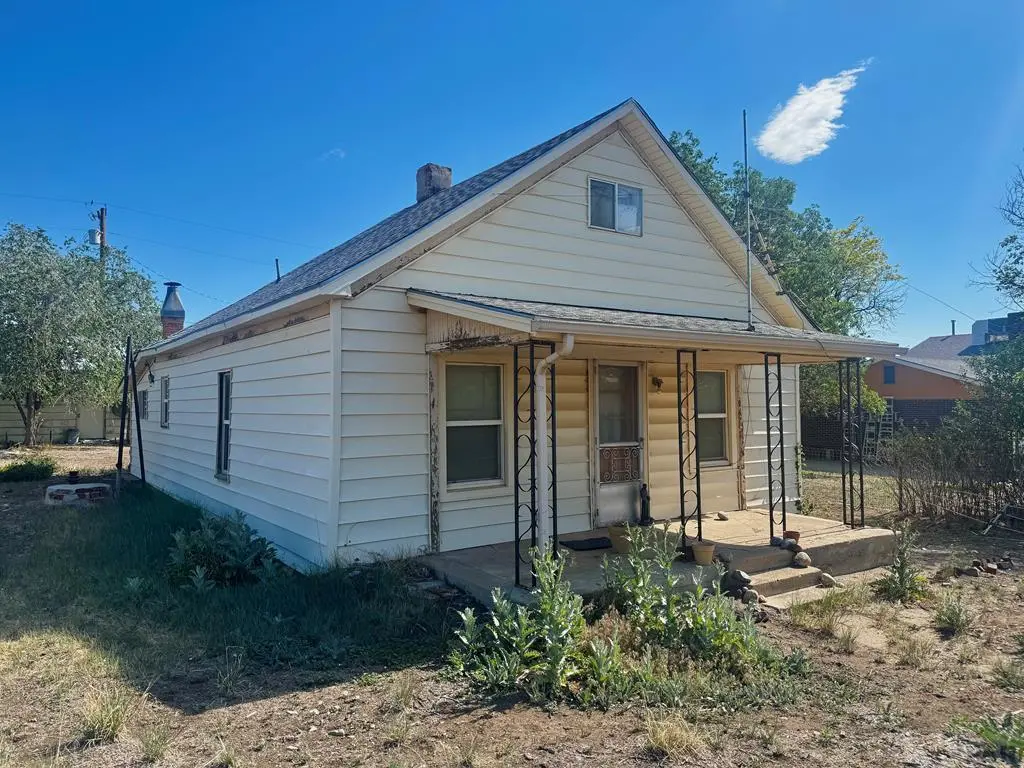
419 Maple St · Aguilar, CO
Flood risk No data
- FEMA flood zone
- —
- Chance of flooding over 30 yrs
- %
- Est. flood insurance / yr
- —
Fire risk No data
- Est. fire insurance / yr
- —
Heat risk No data
- Hot days now (above °F)
- days/yr
- Hot days in 30 yrs
- days/yr
Wind risk No data
- Chance of severe wind over 30 yrs
- %
Air-quality risk No data
- Unhealthy air days now
- days/yr
- Unhealthy air days in 30 yrs
- days/yr
Risk factors via First Street. Map © Google.
Why this score? — see what drove the B+ grade
The composite is a weighted blend of 9 inputs, each scored 0–100. Each bar is that input's sub-score; the figure is the points it added to the 100-point composite (weight × sub-score).
- Cash flow +29.0/30.0
- ARV discount +15.0/15.0
- DSCR +10.0/10.0
- 1% rule +8.1/10.0
- Appreciation +5.0/10.0
- Rent growth +2.5/5.0
- Livability +2.5/5.0
- Condition / age +2.5/5.0
- Schools +1.3/10.0
$65,000
🖨 Deal sheet 📄 Offer letter ✓ Due diligence
Listing remarks
AS IS FIXER in Aguilar on a fenced in Lot
Key facts
- 9,017 sq ft lot
- Built 1914
Neighborhood map
What this means for you Summary
Snapshot
- This is a 2-bed/1.0-bath single-family listed at $65k.
Deal economics
- At list price, monthly cash flow is $222 ($3k/yr) — positive.
- The deal already cash-flows at list — no discount required.
- Meets the 1% rule at list price ($850 rent vs $65k).
Location & tenants
- Location reads 50/100 on livability (#405 in CO) — a working-class tenant base; expect higher turnover. Strengths: cost of living A+, health & safety A+; Watch: schools F, crime F, amenities F.
- Aguilar Reorganized School District No. 6 (rural): math 0% / reading 20% proficiency, ranked #170 of 176 in CO (top 97%) — low school quality limits family demand, transient renter base, plan for 1-2y turnover.
- Market conditions: 44 active listings in the ZIP; 43 units permitted in Las Animas County in 2024 (0 in 5+ unit buildings).
Forward outlook
- In year one you build about $2k of equity ($449 loan paydown + $2k appreciation (3.0% local appreciation)).
- Las Animas County population projected at -40% by 2050 — secular population decline; favor cash flow + early exit over multi-decade hold.
- At projected returns (3.0% appreciation + 3.0% rent growth), your $18k cash investment doubles in ~4 years — after that, you're playing with house money.
Negotiation context
- Only 0 days on market — expect competitive offers; lowballing is unlikely to land.
Risks & watch-outs
- Watch-outs: built in 1914 — expect roof / HVAC / electrical / plumbing capex.
Questions for the listing agent
- Built in 1914 — when were the roof, HVAC, electrical panel, plumbing, and water heater last replaced?
- Is there a deadline driving the sale (1031 exchange, divorce, estate, relocation)? That informs how much negotiation room exists.
- Schools are F-rated, which usually means shorter tenancies and higher turnover. Who's the typical renter profile here, and what's been the actual vacancy rate?
- Crime grade is F in this area — have there been break-ins, vandalism, or insurance claims at this property in the last 3 years? What carrier currently insures it and at what premium?
- What's the average days-on-market for RENTAL listings here right now (not sales)? A rising rental-DOM trend means longer vacancies and softer asking-rent achievability than the comps imply.
- What's the recent tenant-quality profile in this submarket — average credit score on applications, eviction rate, late-payment / NSF rate, and stable-employment percentage? A property-management company in the area should have these aggregated.
- How much new for-sale + rental construction is in the pipeline within 1–3 miles? Heavy new supply typically softens prices + rents 12–24 months out; constrained supply supports both.
Investment metrics
- 1% rule
- 1.31% ✓
- Cap rate
- 10.39%
- Cash-on-cash
- 14.64%
- DSCR
- 1.65
- GRM
- 6.4
CMA / ARV
- ARV (on-the-fly)
- $86,400
- Comps found
- 8
Show comp detail 8 sales within ~0.75 mi
| Address | Dist | Beds/Ba | Sqft | Sold | Price | $/sf | Match |
|---|---|---|---|---|---|---|---|
| 308 1/2 Spencer Ave | 0.40mi | 2/1.0 | 900 (0%) | 7mo | $175,000 | $194 | 75 |
| 305 N Romero St | 0.43mi | 1/1.0 (-1) | 892 (-1%) | 4mo | $25,000 | $28 | 70 |
| 215 Pinon St | 0.18mi | 2/1.0 | 780 (-13%) | 9mo | $125,000 | $160 | 62 |
| 505 South Ave | 0.57mi | 2/1.0 | 950 (+6%) | 12mo | $180,000 | $189 | 54 |
| 202 San Antonio | 0.47mi | 2/1.0 | 816 (-9%) | 21mo | $62,000 | $76 | 46 |
| 321 West St | 0.47mi | 1/— (-1) | 960 (+7%) | 22mo | $92,000 | $96 | 44 |
| 321 West | 0.47mi | 1/1.0 (-1) | 960 (+7%) | 22mo | $92,000 | $96 | 44 |
| 202 San Antonio | 0.63mi | 2/1.0 | 816 (-9%) | 20mo | $62,000 | $76 | 38 |
Match score weights: distance 35% · size 25% · config 20% · recency 20%. Top-matched comps best support the ARV.
Projected returns pro-forma
3.0% appreciation · 3.0% rent growth · sell at horizon
- IRR
- 21.2%
- Equity multiple
- 2.21×
- Total profit
- $21,988
- Equity at exit
- $29,227
- IRR
- 22.3%
- Equity multiple
- 4.21×
- Total profit
- $58,479
- Equity at exit
- $45,042
Cash invested: $18,200 (down + closing). Projections, not guarantees.
Landlord ↔ Tenant lean methodology
- Overall (STATE)
- 38 Tenant-Leaning
- State Colorado
- 38 Tenant-Leaning · D+4
- County
- — inherits STATE
- City
- — inherits STATE
ZIP-level market 81020
- Active inventory
- 44
- Price-to-rent
- 6.4×
Monthly cashflow live
- Estimated rent
- $850 medium interval (Pro) →
- Mortgage (P&I)
- −$341
- Tax est. 1.5%
- −$81 /mo · $975/yr
- Insurance
- −$27
- HOA
- −$0
- Vacancy / Maint / Mgmt
- −$178
- Net cashflow
- $222
Break-even live
UW: 25.0% down · 7.5% · 30yr · 1.5% tax · 5.0% vac · 8.0% maint · 8.0% mgmt
Financing live
Cash to close
- Down payment
- $16,250
- Closing costs
- $1,950
- Reserves months
- —
- Total cash needed
- —
Loan-product check · same deal, 3 products live
Conventional
25% down · 7.5% · 30yr
- Down + closing
- —
- Monthly P&I
- —
- Monthly cashflow
- —
- DSCR
- —
- Eligible?
- —
Personal DTI + credit; lowest rate.
DSCR
20% down · 8.5% · 30yr
- Down + closing
- —
- Monthly P&I
- —
- Monthly cashflow
- —
- DSCR
- —
- Eligible?
- —
No personal income docs; deal must DSCR.
Hard money
10% down · 12.0% · 12mo
- Down + closing
- —
- Monthly P&I
- —
- Monthly cashflow
- —
- DSCR
- —
- Eligible?
- —
Short-term bridge; refi at stabilization.
Listing history 2 events
-
2026-06-19remarks 41-char remark
-
2026-06-19$65,000 Pending
ⓘ Source: listings_history table (triggers on properties + properties_extension) + one-shot
backfill from property_details.listing_events for pre-trigger history.
Nearby sold comps map
Loading sold comps map…
Walkable amenities ~0.75 mi
Loading nearby amenities…
Taxation est. · year 1
- Rental income
- $10,197
- − Mortgage interest
- −$3,641
- − Property taxes
- −$975
- − Insurance
- −$325
- − Repairs & maintenance
- −$816
- − Management
- −$816
- − Depreciation
- −$1,891
- Taxable income
- $1,733
- Est. tax owed @ 24.0%
- −$416
- After-tax cash flow
- $2,249/yr
For passive investors: Depreciation is non-cash, so a rental often shows a tax loss while cash-flowing — sheltering income. Rental losses are passive: they offset passive income freely, and up to $25,000/yr can offset ordinary (W-2) income if you actively participate and your MAGI is under $100k (phasing out to $0 by $150k); unused losses carry forward. On sale, claimed depreciation is recaptured at up to 25%, and gains may owe capital-gains tax (a 1031 exchange can defer both). Figures are a year-1 estimate at your 24.0% rate — not tax advice; consult a CPA.
Schools (NCES district)
- District
- Aguilar Reorganized School District No. 6
- NCES district ID
- 0802010
- Math proficiency
- 0% ▬ 0.00%
- Reading proficiency
- 20% ▲ 9.00%
- Median HH income
- $43,179
- Composite
- 12.59/100
- National rank
- #14557
- State rank
- #170 of 176 in CO
Livability — Aguilar
- Score
- 50/100
- State rank
- #405
- US rank
- #25647
Category grades
Schools grade is shown separately in the Schools card above.
Census & demographics
- Census place
- Aguilar, CO
- Population (ZIP)
- 807
Population outlook (Las Animas County) Hauer SSP2
- Today (2025)
- 12,072 people
- By 2030
- 10,972 · -9.1%
- By 2040
- 8,825 · -26.9%
- By 2050
- 7,245 · -40.0%
- By 2075
- 5,139 · -57.4%
- By 2100
- 3,922 · -67.5%
Race, ethnicity, and origin ACS 2023
- Neighborhood character
- Majority White (57%)
- Race & ethnicity
- White 57% Hispanic / Latino 38% Two or more races 23% Native American 3%
- Hispanic origin (detail)
- Mexican 18% Puerto Rican 1%
- Common ancestry
- Romanian 9% Slovak 4% Portuguese 3%
- Foreign-born
- 1% · Canada
- Languages at home
- 90% English-only · Spanish 9% Russian/Polish/Slavic 1%
Political lean MEDSL · Las Animas
- 2024 margin
- R (+13.5) · D 42.0% · R 55.5% · Other 2.4%
- 2008→2024 swing
- -20.5pp toward R · 2008: 7.0pp · 2024: -13.5pp
- All cycles
- 2024: R+13.5 2020: R+9.9 2016: R+15.6 2012: D+2.7 2008: D+7.0
Not yet ingested
- Civics
- —
Market trends
- HPI YoY
- —
- Current HPI
- —
- Rent YoY
- —
- Metro
- —
- State GDP YoY
- ▲ 1.95%
- F500 in state
- 14
Industry mix (Fortune 500 HQ in CO)
| Industry | F500 HQs | Revenue |
|---|---|---|
| Technology Distribution | 1 | $31B |
|
||
| Food / Agriculture | 1 | $18B |
|
||
| Packaging | 1 | $14B |
|
||
| Healthcare | 1 | $13B |
|
||
| Energy | 1 | $10B |
|
||
| Technology | 1 | $4B |
|
||
Cash-flow waterfall
monthlySold comps — $/sqft
last 12 mo · ≤1 miLoading sold comps…