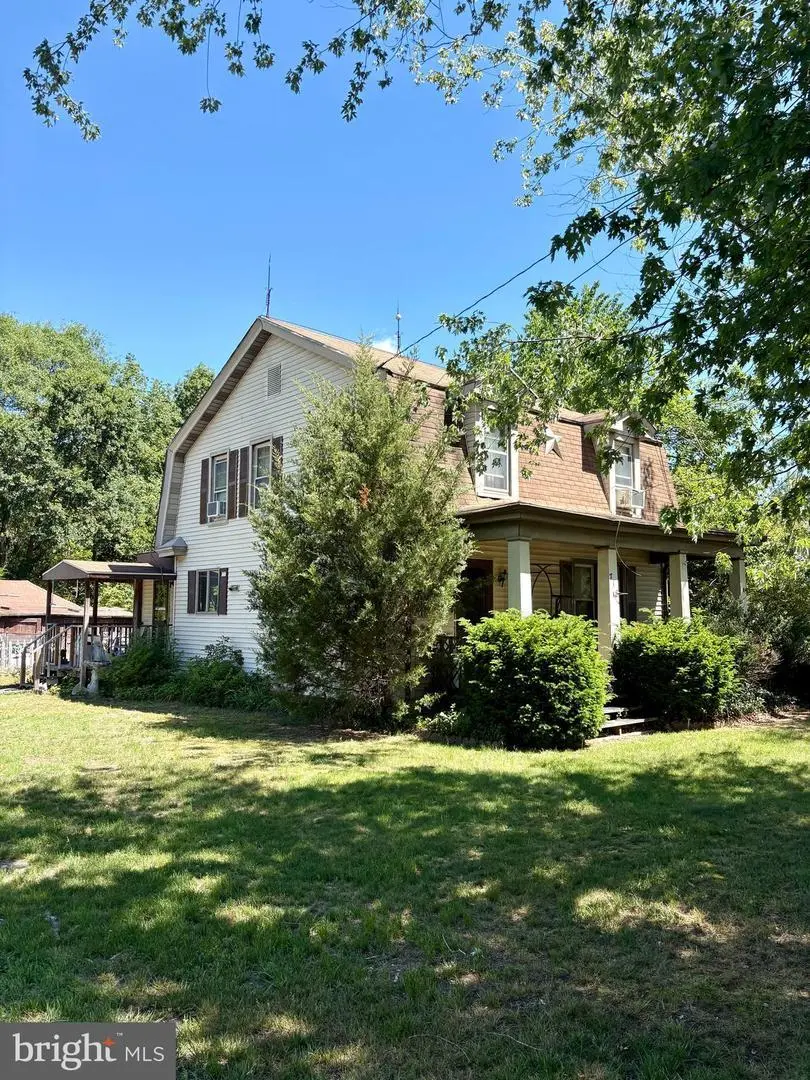
718 State St · Sharptown, MD
Flood risk 3/10 · Minor
- FEMA flood zone
- X (unshaded)
- Chance of flooding over 30 yrs
- 0.2%
- Est. flood insurance / yr
- $507 – $1,088
Fire risk 3/10 · Minor
- Est. fire insurance / yr
- $755 – $1,403
Heat risk 8/10 · Major
- Hot days now (above 105°F)
- 7 days/yr
- Hot days in 30 yrs
- 16 days/yr
Wind risk 6/10 · Moderate
- Chance of severe wind over 30 yrs
- 75.0%
Air-quality risk 2/10 · Minimal
- Unhealthy air days now
- 2 days/yr
- Unhealthy air days in 30 yrs
- 2 days/yr
Risk factors via First Street. Map © Google.
Why this score? — see what drove the B grade
The composite is a weighted blend of 9 inputs, each scored 0–100. Each bar is that input's sub-score; the figure is the points it added to the 100-point composite (weight × sub-score).
- Cash flow +29.8/30.0
- DSCR +10.0/10.0
- Appreciation +9.2/10.0
- 1% rule +7.6/10.0
- ARV discount +7.5/15.0
- Livability +3.1/5.0
- Rent growth +2.5/5.0
- Condition / age +2.5/5.0
- Schools +1.9/10.0
$110,000
🖨 Deal sheet 📄 Offer letter ✓ Due diligence
Listing remarks
Investor Special! This 3-bedroom, 1.5-bath home presents a fantastic opportunity for investors, flippers, or buyers looking to add their own personal touch. Offering a functional layout and plenty of potential to customize your vision. Whether you're looking for your next investment project, a rental property, or a home to restore and make your own, this property offers endless possibilities. Conveniently located just 5 minutes from the Delaware state line and approximately 25 minutes from Salisbury, this home provides easy access to shopping, dining, and everyday conveniences while still enjoying the charm of small-town living. Whether you're looking for your next investment property, rent
Key facts
- 0.32 acre lot
- Built 1920
- Listed 5 days
Property features AI
Exterior
- Parking: Driveway
- Utilities: Public water; Public sewer; Electric service for cooling and hot water
- Home design: Detached property; Fee simple ownership
- Construction: Vinyl siding exterior; Crawl space foundation; Assessor-listed year built
- Exterior features: Not in a federal flood zone; No basement (no below-grade living area reported); Other structures listed above grade and below grade
Interior
- Bedrooms: Three bedrooms on the first upper level
- Bathrooms: One full bathroom on the main level; One half bathroom (total)
- Heating & cooling: Window air conditioning units (electric)
- Interior features: Assessor-listed living area
- Laundry & utility: Laundry on the main floor; Electric hot water
Neighborhood map
What this means for you Summary
Snapshot
- This is a 3-bed/1.0-bath single-family listed at $110k.
Deal economics
- At list price, monthly cash flow is $405 ($5k/yr) — positive.
- The deal already cash-flows at list — no discount required.
- Meets the 1% rule at list price ($1k rent vs $110k).
Location & tenants
- Location reads 61/100 on livability (#336 in MD) — a middle-class / working-renter tenant base. Strengths: cost of living A+, housing A+; Watch: crime F, amenities F, commute F.
- Wicomico County Public Schools (urban): math 16% / reading 26% proficiency, ranked #19 of 24 in MD (top 79%) — low school quality limits family demand, transient renter base, plan for 1-2y turnover.
- Zoned schools: Northwestern Elementary (math 17% / reading 27%, grade F, #297 of 860 statewide, top 38%, 341 students, 54% FRL) — zoned schools at 54% FRL track the district average.
- Market conditions: 9 active listings in the ZIP; 278 units permitted in Wicomico County in 2024 (44 in 5+ unit buildings).
Forward outlook
- In year one you build about $10k of equity ($761 loan paydown + $9k appreciation (8.4% local appreciation)).
- Wicomico County population projected at +14% by 2050 — modest demand growth; plan on rents tracking national, not racing it.
- At projected returns (8.4% appreciation + 3.0% rent growth), your $31k cash investment doubles in ~2 years — after that, you're playing with house money.
- By year 4, paydown + projected appreciation supports a ~$35k cash-out refi (75% LTV) — recoverable capital for the next deal without selling this one.
Negotiation context
- Only 5 days on market — expect competitive offers; lowballing is unlikely to land.
- Current owner paid $60k; list at $110k implies a 84% gain — meaningful room to come down on a strong offer.
Risks & watch-outs
- Watch-outs: built in 1920 — expect roof / HVAC / electrical / plumbing capex.
- Climate carrying-cost: major wind risk, 75% chance of damaging wind over 30y; extreme-heat days projected 7→16/yr by 2055 (HVAC capex compounding) — expect insurance premiums to compound above CPI over the hold.
Questions for the listing agent
- Built in 1920 — when were the roof, HVAC, electrical panel, plumbing, and water heater last replaced?
- Is there a deadline driving the sale (1031 exchange, divorce, estate, relocation)? That informs how much negotiation room exists.
- Schools are F-rated, which usually means shorter tenancies and higher turnover. Who's the typical renter profile here, and what's been the actual vacancy rate?
- Crime grade is F in this area — have there been break-ins, vandalism, or insurance claims at this property in the last 3 years? What carrier currently insures it and at what premium?
- What's the average days-on-market for RENTAL listings here right now (not sales)? A rising rental-DOM trend means longer vacancies and softer asking-rent achievability than the comps imply.
- What's the recent tenant-quality profile in this submarket — average credit score on applications, eviction rate, late-payment / NSF rate, and stable-employment percentage? A property-management company in the area should have these aggregated.
- How much new for-sale + rental construction is in the pipeline within 1–3 miles? Heavy new supply typically softens prices + rents 12–24 months out; constrained supply supports both.
Investment metrics
- 1% rule
- 1.26% ✓
- Cap rate
- 10.72%
- Cash-on-cash
- 15.80%
- DSCR
- 1.70
- GRM
- 6.6
CMA / ARV
- ARV (on-the-fly)
- $237,674
- Comps found
- 8
Show comp detail 8 sales within ~0.75 mi
| Address | Dist | Beds/Ba | Sqft | Sold | Price | $/sf | Match |
|---|---|---|---|---|---|---|---|
| 404 Nanticoke St | 0.22mi | 3/1.0 | 1,470 (-7%) | 2mo | $222,000 | $151 | 77 |
| 507 Main St | 0.35mi | 4/2.0 (+1) | 1,544 (-2%) | 0mo | $190,000 | $123 | 71 |
| 704 4th St | 0.20mi | 3/1.5 | 1,740 (+10%) | 2mo | $195,000 | $112 | 70 |
| 611 Main St | 0.33mi | 3/3.0 | 1,668 (+6%) | 3mo | $315,000 | $189 | 64 |
| 605 State St | 0.17mi | 3/2.0 | 1,773 (+13%) | 6mo | $180,000 | $102 | 62 |
| 604 State St | 0.19mi | 3/1.0 | 1,456 (-8%) | 22mo | $117,000 | $80 | 60 |
| 506 State St | 0.25mi | 4/2.5 (+1) | 1,451 (-8%) | 19mo | $400,000 | $276 | 48 |
| 601 Taylor St | 0.55mi | 3/2.0 | 1,456 (-8%) | 17mo | $268,000 | $184 | 44 |
Match score weights: distance 35% · size 25% · config 20% · recency 20%. Top-matched comps best support the ARV.
Projected returns pro-forma
8.39% appreciation · 3.0% rent growth · sell at horizon
- IRR
- 33.0%
- Equity multiple
- 3.40×
- Total profit
- $73,844
- Equity at exit
- $86,471
- IRR
- 29.2%
- Equity multiple
- 7.34×
- Total profit
- $195,194
- Equity at exit
- $174,488
Cash invested: $30,800 (down + closing). Projections, not guarantees.
Landlord ↔ Tenant lean methodology
- Overall (STATE)
- 27 Tenant-Leaning
- State Maryland
- 27 Tenant-Leaning · D+14
- County
- — inherits STATE
- City
- — inherits STATE
ZIP-level market 21861
- Home prices YoY
- 2.9%
- Active inventory
- 9
- Price-to-rent
- 6.6×
Monthly cashflow live
- Estimated rent
- $1,389 medium interval (Pro) →
- Mortgage (P&I)
- −$577
- Tax from tax record
- −$69 /mo · $832/yr
- Insurance
- −$46
- HOA
- −$0
- Vacancy / Maint / Mgmt
- −$292
- Net cashflow
- $405
Break-even live
UW: 25.0% down · 7.5% · 30yr · 1.5% tax · 5.0% vac · 8.0% maint · 8.0% mgmt
Financing live
Cash to close
- Down payment
- $27,500
- Closing costs
- $3,300
- Reserves months
- —
- Total cash needed
- —
Loan-product check · same deal, 3 products live
Conventional
25% down · 7.5% · 30yr
- Down + closing
- —
- Monthly P&I
- —
- Monthly cashflow
- —
- DSCR
- —
- Eligible?
- —
Personal DTI + credit; lowest rate.
DSCR
20% down · 8.5% · 30yr
- Down + closing
- —
- Monthly P&I
- —
- Monthly cashflow
- —
- DSCR
- —
- Eligible?
- —
No personal income docs; deal must DSCR.
Hard money
10% down · 12.0% · 12mo
- Down + closing
- —
- Monthly P&I
- —
- Monthly cashflow
- —
- DSCR
- —
- Eligible?
- —
Short-term bridge; refi at stabilization.
Listing history 4 events
-
2026-06-09status $110,000 Pending 5 DOM
-
2026-06-08days on market $110,000 Active 5 DOM
-
2026-06-07remarks 699-char remark
-
2026-06-07$110,000 Active 4 DOM
ⓘ Source: listings_history table (triggers on properties + properties_extension) + one-shot
backfill from property_details.listing_events for pre-trigger history.
Tax reassessment forecast MD · Partial reset (capped growth)
- Current annual tax
- $832 · $69/mo
- Projected year-2 tax
- $1,015 · $85/mo
- Expected delta
- +$184/yr (+$15/mo · 22.1%)
ⓘ Screening estimate from a state-policy table — verify with the county assessor before closing.
Climate risk First Street
- Flood 3/10 Moderate FEMA zone X (unshaded) · 20% chance over 30 yrs
- Wildfire 3/10 Moderate
- Heat 8/10 Severe 7 d/yr ≥105°F today · 16 d/yr by 30 yrs out
- Wind 6/10 Major 75% chance of damaging wind over 30 yrs
- Air quality 2/10 Low 2 unhealthy d/yr today · 2 by 30 yrs out
Nearby sold comps map
Loading sold comps map…
Walkable amenities ~0.75 mi
Loading nearby amenities…
Taxation est. · year 1
- Rental income
- $16,670
- − Mortgage interest
- −$6,162
- − Property taxes
- −$832
- − Insurance
- −$550
- − Repairs & maintenance
- −$1,334
- − Management
- −$1,334
- − Depreciation
- −$3,200
- Taxable income
- $3,260
- Est. tax owed @ 24.0%
- −$782
- After-tax cash flow
- $4,083/yr
For passive investors: Depreciation is non-cash, so a rental often shows a tax loss while cash-flowing — sheltering income. Rental losses are passive: they offset passive income freely, and up to $25,000/yr can offset ordinary (W-2) income if you actively participate and your MAGI is under $100k (phasing out to $0 by $150k); unused losses carry forward. On sale, claimed depreciation is recaptured at up to 25%, and gains may owe capital-gains tax (a 1031 exchange can defer both). Figures are a year-1 estimate at your 24.0% rate — not tax advice; consult a CPA.
Schools (NCES district)
- District
- Wicomico County Public Schools
- NCES district ID
- 2400690
- Math proficiency
- 16% ▼ -18.00%
- Reading proficiency
- 26% ▼ -13.00%
- Median HH income
- $51,745
- Composite
- 18.87/100
- National rank
- #8860
- State rank
- #19 of 24 in MD
Livability — Sharptown
- Score
- 61/100
- State rank
- #336
- US rank
- #17897
Category grades
Schools grade is shown separately in the Schools card above.
Census & demographics
- Census place
- Sharptown, MD
- Population (ZIP)
- 806
Population outlook (Wicomico County) Hauer SSP2
- Today (2025)
- 108,548 people
- By 2030
- 111,783 · +3.0%
- By 2040
- 118,139 · +8.8%
- By 2050
- 123,641 · +13.9%
- By 2075
- 139,784 · +28.8%
- By 2100
- 145,334 · +33.9%
Race, ethnicity, and origin ACS 2023
- Neighborhood character
- Predominantly White (89%)
- Race & ethnicity
- White 89% Black 6% Two or more races 3% Hispanic / Latino 1% Asian 1%
- Common ancestry
- Romanian 4% Italian 1% Slovak 1%
- Foreign-born
- 2% · China, Canada
- Languages at home
- 97% English-only · French/Haitian/Cajun 2% Chinese 1% Spanish 1%
Political lean MEDSL · Wicomico
- 2024 margin
- Lean R (+5.5) · D 46.1% · R 51.5% · Other 2.4%
- 2008→2024 swing
- +0.3pp no change · 2008: -5.8pp · 2024: -5.5pp
- All cycles
- 2024: R+5.5 2020: R+1.9 2016: R+11.6 2012: R+6.9 2008: R+5.8
Not yet ingested
- Civics
- —
Market trends
- HPI YoY
- ▲ 8.39%
- Current HPI
- 297.9002
- Rent YoY
- —
- Metro
- —
- State GDP YoY
- ▲ 2.97%
- F500 in state
- 12
Industry mix (Fortune 500 HQ in MD)
| Industry | F500 HQs | Revenue |
|---|---|---|
| Aerospace / Defense | 1 | $71B |
|
||
| Utilities | 1 | $25B |
|
||
| Hotels | 1 | $24B |
|
||
| Consumer Goods | 1 | $7B |
|
||
| Real Estate | 1 | $6B |
|
||
| Chemicals | 1 | $2B |
|
||
Price history
+547.1% since first listed3 events — show timeline
- 2026-06-03 Listed $110,000 BRIGHT MLS
- 1994-08-02 Sold (Public Records) $59,900 Public Records
- 1987-06-03 Sold (Public Records) $17,000 Public Records
Property tax history
-1.5%/yrLatest (2025): $832 · +5.1% YoY. Source: county tax records.
Cash-flow waterfall
monthlySold comps — $/sqft
last 12 mo · ≤1 miLoading sold comps…