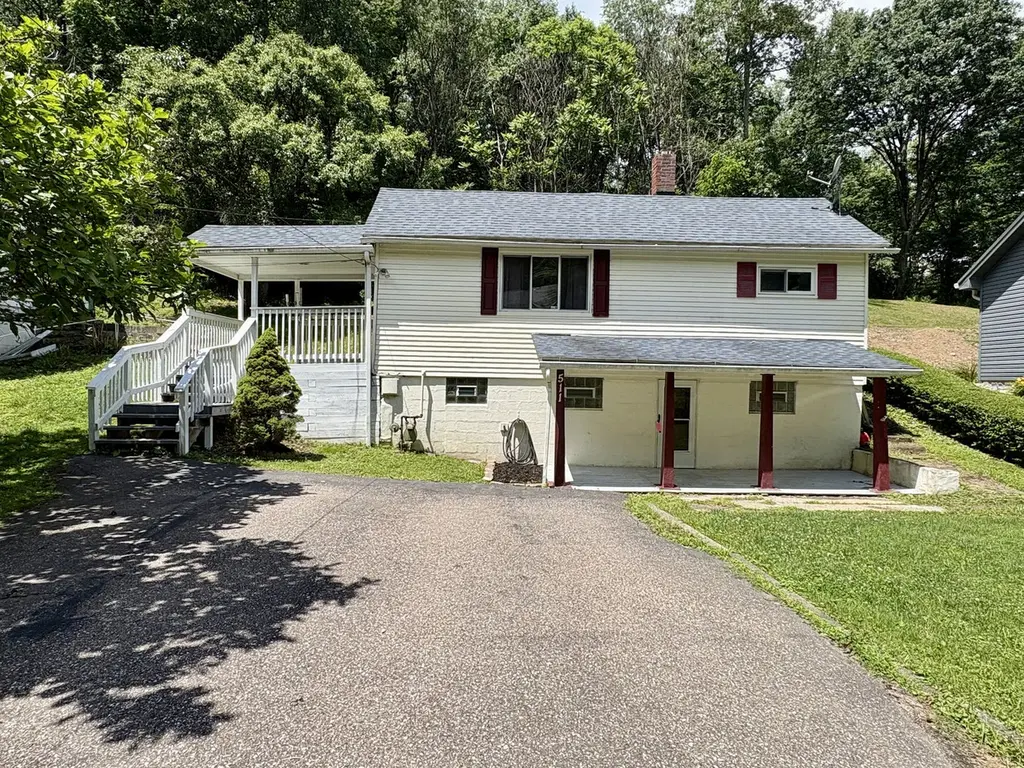
511 California Hollow Rd · North Fayette, PA
Flood risk 9/10 · Severe
- FEMA flood zone
- X (unshaded)
- Chance of flooding over 30 yrs
- 0.99%
- Est. flood insurance / yr
- $507 – $1,088
Fire risk 1/10 · Minimal
- Est. fire insurance / yr
- $511 – $949
Heat risk 3/10 · Minor
- Hot days now (above 96°F)
- 7 days/yr
- Hot days in 30 yrs
- 17 days/yr
Wind risk 2/10 · Minimal
- Chance of severe wind over 30 yrs
- —
Air-quality risk 3/10 · Minor
- Unhealthy air days now
- 2 days/yr
- Unhealthy air days in 30 yrs
- 3 days/yr
Risk factors via First Street. Map © Google.
Why this score? — see what drove the B- grade
The composite is a weighted blend of 9 inputs, each scored 0–100. Each bar is that input's sub-score; the figure is the points it added to the 100-point composite (weight × sub-score).
- Cash flow +28.3/30.0
- DSCR +10.0/10.0
- 1% rule +7.8/10.0
- ARV discount +7.5/15.0
- Schools +6.1/10.0
- Rent growth +2.5/5.0
- Livability +2.5/5.0
- Condition / age +2.5/5.0
- Appreciation +0.0/10.0
$119,000
🖨 Deal sheet (PDF) 📄 Offer letter ✓ Due diligence
Listing remarks MLS
2 Covered Porches to relax and unwind throughout the Summer months! Wooded Views with lush greenery all around! Ceiling Fan and Built-Ins in the familyroom! Cozy Eat-in-Kitchen with ceiling fan, Appliances, double stainless steel sink and lots of cabinetry! Two Bedrooms or make one a home office with loads of closet space! Full Bath with Tub/Shower combo with sprayer and additional cabinetry for storage! Fully equipped Laundry with double laundry tubs! Glass Block windows to let the light in but keep the privacy and security! Circuit Breakers! Newer Roof! Large area for off street parking for additional guests! Convenient access to 22, the new 576 Toll Road and the Airport! Minutes to all the shopping and restaurants and the walking/biking trails! Welcome Home!
Key facts
- Quiet street
- Covered porches
- Large parking area
Tags
Property features AI
Finance
- HOA & community: Public transportation nearby
Exterior
- Parking: Off-street parking for 2 vehicles
- Utilities: Public water; Public sewer
- Home design: Resale property
- Construction: Aluminum siding; Composition roof
- Exterior features: Walk-out full basement
Interior
- Kitchen: Includes refrigerator, stove, and microwave; Some gas appliances
- Bedrooms: Two main-level bedrooms (11x9 and 13x11)
- Flooring: Laminate; Vinyl; Carpet
- Bathrooms: One full bathroom
- Heating & cooling: Forced air gas heating; Central air conditioning
- Interior features: Window treatments
- Laundry & utility: Washer and dryer
Neighborhood map
What this means for you Summary
Snapshot
- This is a 2-bed/1.0-bath single-family listed at $119k.
Deal economics
- At list price, monthly cash flow is $313 ($4k/yr) — positive.
- The deal already cash-flows at list — no discount required.
- Meets the 1% rule at list price ($2k rent vs $119k).
Location & tenants
- Location reads: area grade B — affects rentability + tenant quality, not the cash-flow math above.
- West Allegheny SD (suburban): math 64% / reading 77% proficiency, ranked #22 of 539 in PA (top 4%) — strong family-tenant draw, lease renewals of 3-5y typical; only 18% free/reduced lunch — higher-income household profile.
- Market conditions: 57 active listings in the ZIP; 3 comparable units currently listed for rent nearby; rentals leasing fast (median 8d on market — plan ~1-2 weeks tenant-placement turnaround); 2,996 units permitted in Allegheny County in 2024 (1,588 in 5+ unit buildings).
Forward outlook
- Local home prices are declining (-3.0%/yr); year-one equity from $823 of loan paydown is wiped out by about $4k of value loss. Plan a longer hold.
- At projected returns (-3.0% appreciation + 3.0% rent growth), your $33k cash investment doubles in ~10 years — after that, you're playing with house money.
Negotiation context
- Only 1 days on market — expect competitive offers; lowballing is unlikely to land.
- 3 sale attempts since 13y ago with the ask held roughly flat each time — persistent listings suggest the price (not the market) is what's stuck; bring a comps-based counter.
- Current owner paid $73k; list at $119k implies a 63% gain — meaningful room to come down on a strong offer.
Risks & watch-outs
- Watch-outs: flood insurance adds $66/mo; built in 1912 — expect roof / HVAC / electrical / plumbing capex.
- Climate carrying-cost: severe flood risk — expect insurance premiums to compound above CPI over the hold.
Questions for the listing agent
- Built in 1912 — when were the roof, HVAC, electrical panel, plumbing, and water heater last replaced?
- What's the actual annual flood-insurance premium (NFIP or private), and is the property in a SFHA with mandatory coverage?
- Is there a deadline driving the sale (1031 exchange, divorce, estate, relocation)? That informs how much negotiation room exists.
- What's the average days-on-market for RENTAL listings here right now (not sales)? A rising rental-DOM trend means longer vacancies and softer asking-rent achievability than the comps imply.
- What's the recent tenant-quality profile in this submarket — average credit score on applications, eviction rate, late-payment / NSF rate, and stable-employment percentage? A property-management company in the area should have these aggregated.
- How much new for-sale + rental construction is in the pipeline within 1–3 miles? Heavy new supply typically softens prices + rents 12–24 months out; constrained supply supports both.
Investment metrics
- 1% rule
- 1.28% ✓
- Cap rate
- 10.12%
- Cash-on-cash
- 13.68%
- DSCR
- 1.61
- GRM
- 6.5
CMA / ARV
- ARV (on-the-fly)
- $306,176
- Comps found
- 9
Show comp detail 9 sales within ~0.75 mi
| Address | Dist | Beds/Ba | Sqft | Sold | Price | $/sf | Match |
|---|---|---|---|---|---|---|---|
| 515 California Hollow Rd | 0.06mi | 3/2.0 (+1) | 1,344 (-9%) | 14mo | $335,000 | $249 | 62 |
| 236 Stark Ave | 0.29mi | 3/1.0 (+1) | 1,336 (-9%) | 18mo | $135,000 | $101 | 51 |
| 10 Grace St | 0.23mi | 3/1.0 (+1) | 1,626 (+10%) | 21mo | $175,000 | $108 | 49 |
| 100 Craig St | 0.55mi | 3/2.0 (+1) | 1,363 (-7%) | 6mo | $215,000 | $158 | 48 |
| 135 High St | 0.66mi | 3/1.5 (+1) | 1,454 (-1%) | 19mo | $218,000 | $150 | 44 |
| 102 Oakwood Ln | 0.41mi | 3/3.5 (+1) | 1,380 (-6%) | 14mo | $387,496 | $281 | 44 |
| 224 Briar Path | 0.71mi | 3/2.5 (+1) | 1,532 (+4%) | 12mo | $355,000 | $232 | 39 |
| 61 Forest Glen Dr | 0.63mi | 3/2.0 (+1) | 1,296 (-12%) | 6mo | $269,500 | $208 | 36 |
| 121 Kearns St | 0.72mi | 3/2.0 (+1) | 1,296 (-12%) | 19mo | $310,000 | $239 | 22 |
Match score weights: distance 35% · size 25% · config 20% · recency 20%. Top-matched comps best support the ARV.
Projected returns pro-forma
-3.0% appreciation · 3.0% rent growth · sell at horizon
- IRR
- 0.6%
- Equity multiple
- 1.02×
- Total profit
- $733
- Equity at exit
- $17,743
- IRR
- 10.3%
- Equity multiple
- 1.80×
- Total profit
- $26,590
- Equity at exit
- $10,289
Cash invested: $33,320 (down + closing). Projections, not guarantees.
Landlord ↔ Tenant lean methodology
- Overall (STATE)
- 62 Landlord-Friendly
- State Pennsylvania
- 62 Landlord-Friendly · EVEN
- County
- — inherits STATE
- City
- — inherits STATE
ZIP-level market 15126
- Home prices YoY
- -14.6%
- Active inventory
- 57
- Price-to-rent
- 6.5×
Monthly cashflow live
- Estimated rent
- $1,522 medium interval (Pro) →
- Mortgage (P&I)
- −$624
- Tax from tax record
- −$149 /mo · $1,787/yr
- Insurance
- −$50
- Flood insurance flood zone
- −$66 /mo · $798/yr
- HOA
- −$0
- Vacancy / Maint / Mgmt
- −$320
- Net cashflow
- $313
Break-even live
Sensitivity live
| Price | -10% $381 | -5% $347 | +0% $313 | +5% $280 | +10% $246 |
|---|---|---|---|---|---|
| Rent | -10% $193 | -5% $253 | +0% $313 | +5% $373 | +10% $434 |
| Rate | -1.0pp $373 | -0.5pp $344 | base $313 | +0.5pp $282 | +1.0pp $251 |
UW: 25.0% down · 7.5% · 30yr · 1.5% tax · 5.0% vac · 8.0% maint · 8.0% mgmt
Financing live
Cash to close
- Down payment
- $29,750
- Closing costs
- $3,570
- Reserves months
- —
- Total cash needed
- —
Loan-product check · same deal, 3 products live
Conventional
25% down · 7.5% · 30yr
- Down + closing
- —
- Monthly P&I
- —
- Monthly cashflow
- —
- DSCR
- —
- Eligible?
- —
Personal DTI + credit; lowest rate.
DSCR
20% down · 8.5% · 30yr
- Down + closing
- —
- Monthly P&I
- —
- Monthly cashflow
- —
- DSCR
- —
- Eligible?
- —
No personal income docs; deal must DSCR.
Hard money
10% down · 12.0% · 12mo
- Down + closing
- —
- Monthly P&I
- —
- Monthly cashflow
- —
- DSCR
- —
- Eligible?
- —
Short-term bridge; refi at stabilization.
Rent comps 3 comps
| Address | Beds | Baths | Sqft | Rent | $/sqft | DOM | Units | Dist |
|---|---|---|---|---|---|---|---|---|
| 27412 Evergreen Run Unit 27412 Imperial, PA | 2.0 | 1.0 | 1000 | $1,150 | $1.15 | 24d | 1 | 0.99mi |
| 1101 Timberglen Dr Imperial, PA | 3.0 | 2.0 | 1310 | $1,800 | $1.37 | 8d | 1 | 1.19mi |
| 1600 Settlers Dr Oakdale, PA | 1.0–2.0 | 1.0 | 769 | $1,645 | $2.14 | 2d | 23 | 1.37mi |
Listing history 2 events
-
2026-06-18remarks 699-char remark
-
2026-06-18$119,000 Active 1 DOM
ⓘ Source: listings_history table (triggers on properties + properties_extension) + one-shot
backfill from property_details.listing_events for pre-trigger history.
Tax reassessment forecast PA · Partial reset (capped growth)
- Current annual tax
- $1,787 · $149/mo
- Projected year-2 tax
- $1,834 · $153/mo
- Expected delta
- +$47/yr (+$4/mo · 2.6%)
ⓘ Screening estimate from a state-policy table — verify with the county assessor before closing.
Climate risk First Street
- Flood 9/10 Extreme FEMA zone X (unshaded) · 99% chance over 30 yrs
- Wildfire 1/10 Low
- Heat 3/10 Moderate 7 d/yr ≥96°F today · 17 d/yr by 30 yrs out
- Wind 2/10 Low
- Air quality 3/10 Moderate 2 unhealthy d/yr today · 3 by 30 yrs out
Nearby sold comps map
Loading sold comps map…
Walkable amenities ~0.75 mi
Loading nearby amenities…
Taxation est. · year 1
- Rental income
- $18,262
- − Mortgage interest
- −$6,666
- − Property taxes
- −$1,787
- − Insurance
- −$1,392
- − Repairs & maintenance
- −$1,461
- − Management
- −$1,461
- − Depreciation
- −$3,462
- Taxable income
- $2,033
- Est. tax owed @ 24.0%
- −$488
- After-tax cash flow
- $3,271/yr
For passive investors: Depreciation is non-cash, so a rental often shows a tax loss while cash-flowing — sheltering income. Rental losses are passive: they offset passive income freely, and up to $25,000/yr can offset ordinary (W-2) income if you actively participate and your MAGI is under $100k (phasing out to $0 by $150k); unused losses carry forward. On sale, claimed depreciation is recaptured at up to 25%, and gains may owe capital-gains tax (a 1031 exchange can defer both). Figures are a year-1 estimate at your 24.0% rate — not tax advice; consult a CPA.
Schools (NCES district)
- District
- West Allegheny SD
- NCES district ID
- 4225200
- Math proficiency
- 64% ▼ -5.00%
- Reading proficiency
- 77% ▼ -3.00%
- Median HH income
- $67,549
- Composite
- 61.41/100
- National rank
- #763
- State rank
- #22 of 539 in PA
Livability — North Fayette
No livability data for this city. (Only ~50 U.S. cities are tracked.)
Census & demographics
- Census place
- Imperial, PA
- Population (ZIP)
- 6,776
Population outlook (Allegheny County) Hauer SSP2
- Today (2025)
- 1,250,282 people
- By 2030
- 1,256,482 · +0.5%
- By 2040
- 1,256,318 · +0.5%
- By 2050
- 1,244,169 · -0.5%
- By 2075
- 1,197,693 · -4.2%
- By 2100
- 1,093,187 · -12.6%
Race, ethnicity, and origin ACS 2023
- Neighborhood character
- Predominantly White (78%)
- Race & ethnicity
- White 78% Asian 12% Two or more races 7% Hispanic / Latino 2% Black 1%
- Common ancestry
- Romanian 10% Slovak 6% Subsaharan African 2%
- Foreign-born
- 12% · Canada
- Languages at home
- 87% English-only · Other Indo-European 11% Spanish 2% Russian/Polish/Slavic 0%
Political lean MEDSL · Allegheny
- 2024 margin
- Strong D (+20.3) · D 59.7% · R 39.4%
- 2008→2024 swing
- +4.8pp toward D · 2008: 15.5pp · 2024: 20.3pp
- All cycles
- 2024: D+20.3 2020: D+20.4 2016: D+16.4 2012: D+14.4 2008: D+15.5
Not yet ingested
- Civics
- —
Market trends
- HPI YoY
- ▼ -45.07%
- Current HPI
- 263.0635
- Rent YoY
- —
- Metro
- —
- State GDP YoY
- ▲ 1.68%
- F500 in state
- 34
Industry mix (Fortune 500 HQ in PA)
| Industry | F500 HQs | Revenue |
|---|---|---|
| Healthcare | 2 | $309B |
|
||
| Insurance | 2 | $27B |
|
||
| Telecommunications / Media | 1 | $124B |
|
||
| Industrial Distribution | 1 | $22B |
|
||
| Financial Services | 1 | $20B |
|
||
| Chemicals / Materials | 1 | $18B |
|
||
Price history
+147.9% since first listed10 events — show timeline
- 2026-06-16 Listed $119,000 West Penn MLS
- 2022-10-18 Pending — West Penn MLS
- 2022-10-14 Sold (Public Records) $73,000 Public Records
- 2022-10-13 Sold (MLS) $73,000 West Penn MLS
- 2022-08-25 Contingent — West Penn MLS
- 2022-08-04 Listed $79,900 West Penn MLS
- 2013-03-19 Sold (Public Records) $69,900 Public Records
- 2013-03-15 Sold (MLS) $69,900 West Penn MLS
- 2013-01-06 Listed $69,900 West Penn MLS
- 2008-08-01 Sold (Public Records) $48,000 Public Records
Property tax history
+0.6%/yrLatest (2026): $1,787 · +0.0% YoY. Source: county tax records.
Cash-flow waterfall
monthlySold comps — $/sqft
last 12 mo · ≤1 miLoading sold comps…