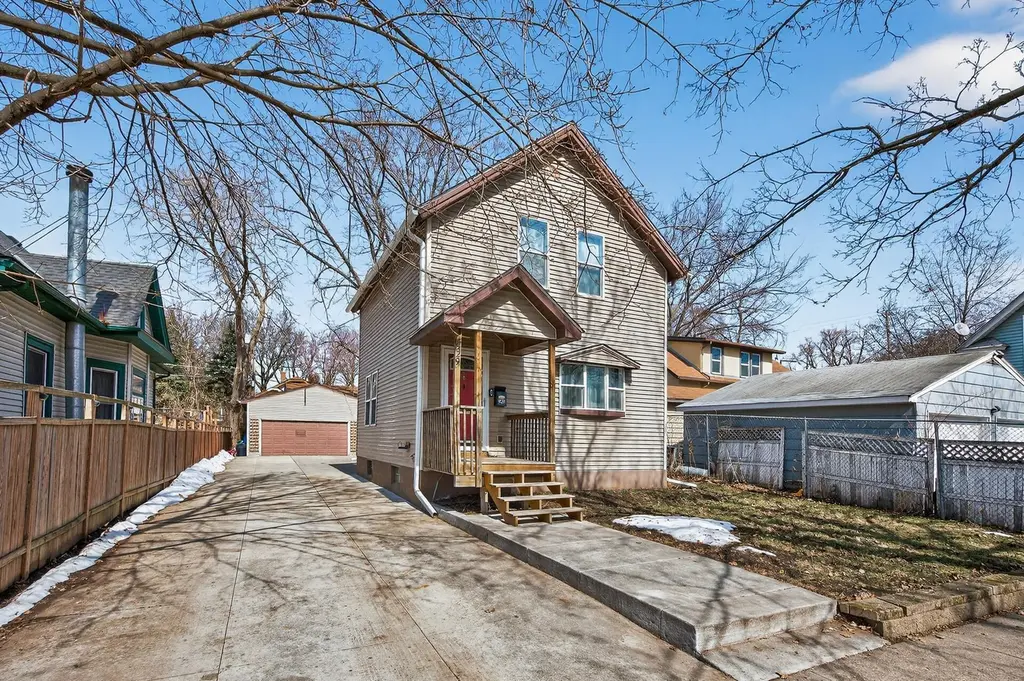
929 Euclid St · St. Paul, MN
Flood risk 4/10 · Minor
- FEMA flood zone
- X (unshaded)
- Chance of flooding over 30 yrs
- 0.22%
- Est. flood insurance / yr
- $507 – $1,088
Fire risk 1/10 · Minimal
- Est. fire insurance / yr
- $888 – $1,650
Heat risk 2/10 · Minimal
- Hot days now (above 99°F)
- 7 days/yr
- Hot days in 30 yrs
- 13 days/yr
Wind risk 2/10 · Minimal
- Chance of severe wind over 30 yrs
- —
Air-quality risk 2/10 · Minimal
- Unhealthy air days now
- 1 days/yr
- Unhealthy air days in 30 yrs
- 1 days/yr
Risk factors via First Street. Map © Google.
Why this score? — see what drove the D grade
The composite is a weighted blend of 9 inputs, each scored 0–100. Each bar is that input's sub-score; the figure is the points it added to the 100-point composite (weight × sub-score).
- Cash flow +14.4/30.0
- ARV discount +7.5/15.0
- DSCR +4.4/10.0
- 1% rule +4.2/10.0
- Rent growth +4.1/5.0
- Livability +2.5/5.0
- Condition / age +2.5/5.0
- Schools +2.4/10.0
- Appreciation +0.0/10.0
$292,000
🖨 Deal sheet 📄 Offer letter ✓ Due diligence
Listing remarks MLS
Move in. Not a SS/foreclosure. Updated windows, marble counter tops, ceramic tiles, wood kitchen cabinets, landscape work, 2 car garages & long driveway to fit plenty more. In a welcoming neighborhood by many conveniences. 24/hour notice 9-7:30PM.
Key facts
- 5,357 sq ft lot
- 2 garage spots
- Built 1885
Neighborhood map
What this means for you Summary
Snapshot
- This is a 3-bed/1.5-bath single-family listed at $292k.
Deal economics
- At list price, monthly cash flow is $57 ($684/yr) — positive.
- The deal already cash-flows at list — no discount required.
- To meet the 1% rule (rent ≥ 1% of price), the offer needs to be $268k (8.1% below list).
- Recommended offer: $268k (8.1% below list) — sets the bar for 1% rule.
Location & tenants
- Location reads: area grade D — affects rentability + tenant quality, not the cash-flow math above.
- St. Paul Public School District (urban): math 21% / reading 33% proficiency, ranked #270 of 301 in MN (top 90%) — low school quality limits family demand, transient renter base, plan for 1-2y turnover; 64% free/reduced lunch — lower-income household profile, screen leases tightly.
- Market conditions: Rents rising fast (+6.3%/yr); 255 active listings in the ZIP; 6 comparable units currently listed for rent nearby; rentals leasing fast (median 3d on market — plan ~1-2 weeks tenant-placement turnaround); 1,202 units permitted in Ramsey County in 2024 (880 in 5+ unit buildings).
- At $2,684/mo this rent would consume 46% of the median local household income ($70k/yr) (locally 2046% of renters already pay >50% of income on rent) — very limited rent-growth headroom before tenants either downsize or default.
Forward outlook
- Local home prices are declining (-3.0%/yr); year-one equity from $2k of loan paydown is wiped out by about $9k of value loss. Plan a longer hold.
- Ramsey County population projected at +27% by 2050 — long-run rental-demand tailwind backs the buy-and-hold thesis.
Negotiation context
- It's been on market 27 days — a 2% lower offer ($288k) is reasonable based on typical stale-listing flexibility.
- 9 sale attempts since 32y ago with the ask held roughly flat each time — persistent listings suggest the price (not the market) is what's stuck; bring a comps-based counter.
- Current owner paid $92k; list at $292k implies a 217% gain — meaningful room to come down on a strong offer.
Risks & watch-outs
- Watch-outs: built in 1885 — expect roof / HVAC / electrical / plumbing capex.
Questions for the listing agent
- Built in 1885 — when were the roof, HVAC, electrical panel, plumbing, and water heater last replaced?
- Is there a deadline driving the sale (1031 exchange, divorce, estate, relocation)? That informs how much negotiation room exists.
- The area grade is low — what's the realistic commute time and amenity access for the typical tenant pool here? Any planned neighborhood developments (good or bad) we should know about?
- What's the average days-on-market for RENTAL listings here right now (not sales)? A rising rental-DOM trend means longer vacancies and softer asking-rent achievability than the comps imply.
- What's the recent tenant-quality profile in this submarket — average credit score on applications, eviction rate, late-payment / NSF rate, and stable-employment percentage? A property-management company in the area should have these aggregated.
- How much new for-sale + rental construction is in the pipeline within 1–3 miles? Heavy new supply typically softens prices + rents 12–24 months out; constrained supply supports both.
Investment metrics
- 1% rule
- 0.92% ✗
- Cap rate
- 6.53%
- Cash-on-cash
- 0.84%
- DSCR
- 1.04
- GRM
- 9.1
CMA / ARV
No comps found within radius.
Projected returns pro-forma
-3.0% appreciation · 6.26% rent growth · sell at horizon
- IRR
- -11.3%
- Equity multiple
- 0.58×
- Total profit
- $-34,527
- Equity at exit
- $43,538
- IRR
- 2.2%
- Equity multiple
- 1.18×
- Total profit
- $14,783
- Equity at exit
- $25,247
Cash invested: $81,760 (down + closing). Projections, not guarantees.
Landlord ↔ Tenant lean methodology
- Overall (STATE)
- 46 Balanced
- State Minnesota
- 46 Balanced · D+2
- County
- — inherits STATE
- City
- — inherits STATE
ZIP-level market 55106
- Rents YoY
- 6.3%
- Active inventory
- 255
- Price-to-rent
- 9.1×
Monthly cashflow live
- Estimated rent
- $2,684 high interval (Pro) →
- Mortgage (P&I)
- −$1,531
- Tax from tax record
- −$411 /mo · $4,928/yr
- Insurance
- −$122
- HOA
- −$0
- Vacancy / Maint / Mgmt
- −$564
- Net cashflow
- $57
Break-even live
UW: 25.0% down · 7.5% · 30yr · 1.5% tax · 5.0% vac · 8.0% maint · 8.0% mgmt
Financing live
Cash to close
- Down payment
- $73,000
- Closing costs
- $8,760
- Reserves months
- —
- Total cash needed
- —
Loan-product check · same deal, 3 products live
Conventional
25% down · 7.5% · 30yr
- Down + closing
- —
- Monthly P&I
- —
- Monthly cashflow
- —
- DSCR
- —
- Eligible?
- —
Personal DTI + credit; lowest rate.
DSCR
20% down · 8.5% · 30yr
- Down + closing
- —
- Monthly P&I
- —
- Monthly cashflow
- —
- DSCR
- —
- Eligible?
- —
No personal income docs; deal must DSCR.
Hard money
10% down · 12.0% · 12mo
- Down + closing
- —
- Monthly P&I
- —
- Monthly cashflow
- —
- DSCR
- —
- Eligible?
- —
Short-term bridge; refi at stabilization.
Rent comps 6 comps
| Address | Beds | Baths | Sqft | Rent | $/sqft | DOM | Units | Dist |
|---|---|---|---|---|---|---|---|---|
| 330 9th St E St Paul, MN | 1.0–2.0 | 1.0 | 978 | $2,495 | $2.55 | 3d | 3 | 1.30mi |
| 250 6th St E St Paul, MN | 2.0 | 1.0–2.0 | 980 | $2,868 | $2.93 | 2d | 16 | 1.33mi |
| 240 5th St E St Paul, MN | 2.0 | 1.0–2.0 | 949 | $2,770 | $2.92 | 2d | 10 | 1.35mi |
| 180 E Kellogg Blvd St Paul, MN | 3.0 | 1.0–2.5 | 1436 | $4,595 | $3.20 | 2d | 22 | 1.40mi |
| 333 Sibley St Saint Paul, MN | 3.0 | 1.0–2.0 | 1358 | $3,269 | $2.41 | 10d | 10 | 1.41mi |
| 141 4th St E Saint Paul, MN | 2.0 | 1.0–2.0 | 811 | $2,420 | $2.98 | 20d | 20 | 1.50mi |
Listing history 29 events
-
2026-04-23status Pending
-
2026-03-26$292,000 Active
-
2012-07-13soldstatus $92,000
-
2012-07-13soldstatus $100,000
-
2012-05-18soldstatus $100,000 251-char remark
Show marketing remark (251 chars)
Move in. Not a SS/foreclosure. Updated windows, marble counter tops, ceramic tiles, wood kitchen cabinets, landscape work, 2 car garages & long driveway to fit plenty more. In a welcoming neighborhood by many conveniences. 24/hour notice 9-7:30PM.
-
2012-02-17historical 251-char remark
Show marketing remark (251 chars)
Move in. Not a SS/foreclosure. Updated windows, marble counter tops, ceramic tiles, wood kitchen cabinets, landscape work, 2 car garages & long driveway to fit plenty more. In a welcoming neighborhood by many conveniences. 24/hour notice 9-7:30PM.
-
2011-09-27$109,900 251-char remark
Show marketing remark (251 chars)
Move in. Not a SS/foreclosure. Updated windows, marble counter tops, ceramic tiles, wood kitchen cabinets, landscape work, 2 car garages & long driveway to fit plenty more. In a welcoming neighborhood by many conveniences. 24/hour notice 9-7:30PM.
-
2010-07-23historical
-
2010-07-13$112,900
-
2010-07-12historical
-
2010-06-23soldstatus $92,000
-
2010-05-09$112,900
-
2008-07-23soldstatus $60,000
-
2008-06-13historical
-
2008-06-05$39,900
-
1999-11-24soldstatus $60,000
-
1999-11-24soldstatus $65,000
-
1998-05-27soldstatus $64,900
-
1998-03-23historical
-
1998-02-16$64,900
-
1997-11-30historical
-
1996-12-24soldstatus $59,900
-
1996-11-20$64,900
-
1996-08-01soldstatus $59,900
-
1996-07-17historical
-
1995-12-20$59,900
-
1994-06-17soldstatus $59,900
-
1994-06-16historical
-
1994-04-11$59,900
ⓘ Source: listings_history table (triggers on properties + properties_extension) + one-shot
backfill from property_details.listing_events for pre-trigger history.
Tax reassessment forecast MN · Partial reset (capped growth)
- Current annual tax
- $4,928 · $411/mo
- Projected year-2 tax
- $4,928 · $411/mo
- Expected delta
- $0/yr ($0/mo · 0.0%)
ⓘ Screening estimate from a state-policy table — verify with the county assessor before closing.
Climate risk First Street
- Flood 4/10 Moderate FEMA zone X (unshaded) · 22% chance over 30 yrs
- Wildfire 1/10 Low
- Heat 2/10 Low 7 d/yr ≥99°F today · 13 d/yr by 30 yrs out
- Wind 2/10 Low
- Air quality 2/10 Low 1 unhealthy d/yr today · 1 by 30 yrs out
Nearby sold comps map
Loading sold comps map…
Walkable amenities ~0.75 mi
Loading nearby amenities…
Taxation est. · year 1
- Rental income
- $32,211
- − Mortgage interest
- −$16,357
- − Property taxes
- −$4,928
- − Insurance
- −$1,460
- − Repairs & maintenance
- −$2,577
- − Management
- −$2,577
- − Depreciation
- −$8,495
- Taxable loss
- −$4,181
- Est. tax savings @ 24.0%
- +$1,004
- After-tax cash flow
- $1,687/yr
For passive investors: Depreciation is non-cash, so a rental often shows a tax loss while cash-flowing — sheltering income. Rental losses are passive: they offset passive income freely, and up to $25,000/yr can offset ordinary (W-2) income if you actively participate and your MAGI is under $100k (phasing out to $0 by $150k); unused losses carry forward. On sale, claimed depreciation is recaptured at up to 25%, and gains may owe capital-gains tax (a 1031 exchange can defer both). Figures are a year-1 estimate at your 24.0% rate — not tax advice; consult a CPA.
Schools (NCES district)
- District
- St. Paul Public School District
- NCES district ID
- 2733840
- Math proficiency
- 21% ▼ -11.00%
- Reading proficiency
- 33% ▼ -7.00%
- Median HH income
- $48,316
- Composite
- 23.51/100
- National rank
- #7868
- State rank
- #270 of 301 in MN
Livability — St. Paul
No livability data for this city. (Only ~50 U.S. cities are tracked.)
Census & demographics
- Census place
- St. Paul, MN
- County
- Ramsey County · 542,837 people
- City population
- 280,599
- Metro
- Minneapolis-St. Paul-Bloomington, MN-WI
- Population (ZIP)
- 56,708
- Household income
- $70,187
- Rent vs Own
- Severe rent burden
- 2046.0
Population outlook (Ramsey County) Hauer SSP2
- Today (2025)
- 603,431 people
- By 2030
- 636,459 · +5.5%
- By 2040
- 700,596 · +16.1%
- By 2050
- 765,819 · +26.9%
- By 2075
- 929,297 · +54.0%
- By 2100
- 1,053,924 · +74.7%
Race, ethnicity, and origin ACS 2023
- Neighborhood character
- Highly diverse neighborhood (Simpson 0.75)
- Race & ethnicity
- Asian 34% White 32% Black 15% Hispanic / Latino 11% Two or more races 10%
- Hispanic origin (detail)
- Mexican 8%
- Common ancestry
- Portuguese 4% Lithuanian 2% Romanian 2%
- Foreign-born
- 25% · Canada, Philippines, Vietnam
- Languages at home
- 59% English-only · Other Asian/Pacific 27% Spanish 9% French/Haitian/Cajun 1%
Political lean MEDSL · Ramsey
- 2024 margin
- Solid D (+43.3) · D 70.5% · R 27.2% · Other 2.3%
- 2008→2024 swing
- +9.4pp toward D · 2008: 33.9pp · 2024: 43.3pp
- All cycles
- 2024: D+43.3 2020: D+45.4 2016: D+39.4 2012: D+35.3 2008: D+33.9
Not yet ingested
- Civics
- —
Market trends
- HPI YoY
- ▼ -239.48%
- Current HPI
- 288.7205
- Rent YoY
- ▲ 6.26%
- Metro
- Minneapolis-St. Paul-Bloomington, MN-WI
- State GDP YoY
- ▲ 2.41%
- F500 in state
- 34
Industry mix (Fortune 500 HQ in MN)
| Industry | F500 HQs | Revenue |
|---|---|---|
| Healthcare | 2 | $407B |
|
||
| Retail | 2 | $150B |
|
||
| Consumer Goods | 2 | $32B |
|
||
| Industrial Machinery | 2 | $6B |
|
||
| Agriculture | 1 | $40B |
|
||
| Healthcare / Medical Devices | 1 | $32B |
|
||
Price history
+387.5% since first listed29 events — show timeline
- 2026-04-23 Pending — NORTHSTARMLS as Distributed by MLS Grid
- 2026-03-26 Listed $292,000 NORTHSTARMLS as Distributed by MLS Grid
- 2012-07-13 Sold (Public Records) $100,000 Public Records
- 2012-07-13 Sold (Public Records) $92,000 Public Records
- 2012-05-18 Sold (MLS) $100,000 NORTHSTARMLS as Distributed by MLS Grid
- 2012-02-17 Listing Removed — NORTHSTARMLS as Distributed by MLS Grid
- 2011-09-27 Listed $109,900 NORTHSTARMLS as Distributed by MLS Grid
- 2010-07-23 Listing Removed — NORTHSTARMLS as Distributed by MLS Grid
- 2010-07-13 Listed $112,900 NORTHSTARMLS as Distributed by MLS Grid
- 2010-07-12 Listing Removed — NORTHSTARMLS as Distributed by MLS Grid
- 2010-06-23 Sold (Public Records) $92,000 Public Records
- 2010-05-09 Listed $112,900 NORTHSTARMLS as Distributed by MLS Grid
- 2008-07-23 Sold (MLS) $60,000 NORTHSTARMLS as Distributed by MLS Grid
- 2008-06-13 Listing Removed — NORTHSTARMLS as Distributed by MLS Grid
- 2008-06-05 Listed $39,900 NORTHSTARMLS as Distributed by MLS Grid
- 1999-11-24 Sold (Public Records) $65,000 Public Records
- 1999-11-24 Sold (Public Records) $60,000 Public Records
- 1998-05-27 Sold (MLS) $64,900 NORTHSTARMLS as Distributed by MLS Grid
- 1998-03-23 Listing Removed — NORTHSTARMLS as Distributed by MLS Grid
- 1998-02-16 Listed $64,900 NORTHSTARMLS as Distributed by MLS Grid
- 1997-11-30 Listing Removed — NORTHSTARMLS as Distributed by MLS Grid
- 1996-12-24 Sold (Public Records) $59,900 Public Records
- 1996-11-20 Listed $64,900 NORTHSTARMLS as Distributed by MLS Grid
- 1996-08-01 Sold (MLS) $59,900 NORTHSTARMLS as Distributed by MLS Grid
- 1996-07-17 Listing Removed — NORTHSTARMLS as Distributed by MLS Grid
- 1995-12-20 Listed $59,900 NORTHSTARMLS as Distributed by MLS Grid
- 1994-06-17 Sold (MLS) $59,900 NORTHSTARMLS as Distributed by MLS Grid
- 1994-06-16 Listing Removed — NORTHSTARMLS as Distributed by MLS Grid
- 1994-04-11 Listed $59,900 NORTHSTARMLS as Distributed by MLS Grid
Property tax history
+6.8%/yrLatest (2025): $4,928 · +1.4% YoY. Source: county tax records.
Cash-flow waterfall
monthlySold comps — $/sqft
last 12 mo · ≤1 miLoading sold comps…