2420 Arezzo St · Taylor Mill, KY
Flood risk 1/10 · Minimal
- FEMA flood zone
- X (unshaded)
- Chance of flooding over 30 yrs
- 0.0%
- Est. flood insurance / yr
- $507 – $1,088
Fire risk 2/10 · Minimal
- Est. fire insurance / yr
- $839 – $1,559
Heat risk 4/10 · Minor
- Hot days now (above 102°F)
- 7 days/yr
- Hot days in 30 yrs
- 18 days/yr
Wind risk 2/10 · Minimal
- Chance of severe wind over 30 yrs
- 1.0%
Air-quality risk 3/10 · Minor
- Unhealthy air days now
- 2 days/yr
- Unhealthy air days in 30 yrs
- 3 days/yr
Risk factors via First Street. Map © Google.
Why this score? — see what drove the D- grade
The composite is a weighted blend of 9 inputs, each scored 0–100. Each bar is that input's sub-score; the figure is the points it added to the 100-point composite (weight × sub-score).
- ARV discount +12.8/15.0
- Cash flow +7.7/30.0
- Livability +4.1/5.0
- Schools +4.0/10.0
- 1% rule +2.8/10.0
- Rent growth +2.5/5.0
- Condition / age +2.5/5.0
- DSCR +1.8/10.0
- Appreciation +0.0/10.0
$255,000
🖨 Deal sheet 📄 Offer letter ✓ Due diligence
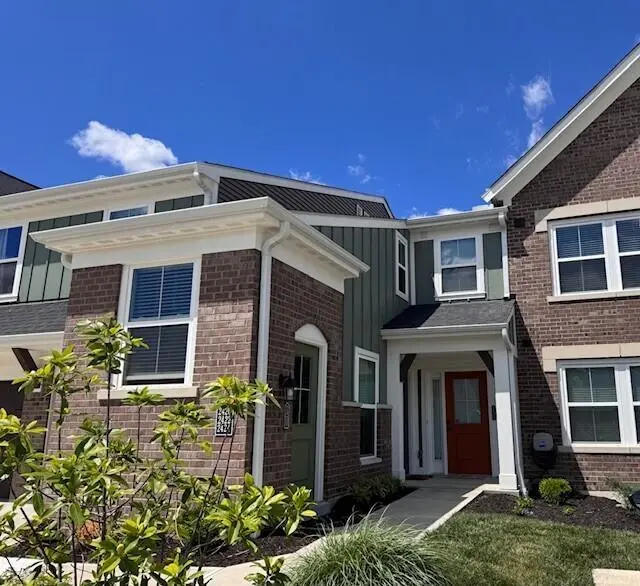
Listing remarks
Don't miss your opportunity to tour this nearly new, beautifully maintained ''Wexner plan'' condo in the sought-after Tuscany Community (Siena East). Filled with natural light, this home features an inviting open floor plan with soaring volume ceilings and a versatile formal dining area that can easily serve as a home office. Enjoy a warm, modern color palette accented by a distinctive decorative wall in the entry, along with a stylish kitchen complete with granite countertops, tiled backsplash, and newer LG stainless steel appliances (microwave by GE). Owner's suite offers a generous walk-in closet, attached bath with a walk-in shower. Step out onto the covered deck, where roll-down blinds
Key facts
- Open floor plan
- Tiled backsplash
- Walk-in closet
Tags
Property features AI
Finance
- Other: Pets allowed — check association rules
- HOA & community: Community pool; Clubhouse; Fitness center; Monthly association fee of $195.12 (includes association fees, grounds maintenance, sewer, trash, water); Semi-annual association fee of $135
Exterior
- Parking: Off-street parking
- Security: Smoke detector(s)
- Utilities: Public water; Public sewer; No natural gas available
- Home design: Condominium; Two levels; Entry level on level 1; Built in 2023
- Construction: Brick and vinyl siding exterior; Shingle roof; Poured concrete foundation
- Exterior features: Covered patio/porch; Deck; Wooded setting; Has a view; Vinyl window frames; Smoke detector(s)
Interior
- Kitchen: Stainless steel appliances; Electric range; Dishwasher; Microwave; Refrigerator
- Bedrooms: Primary bedroom (15 x 12); Bedroom 2 (12 x 10)
- Bathrooms: 2 full bathrooms
- Heating & cooling: Heat pump heating; Electric heating; Central air conditioning
- Interior features: Open floorplan; Kitchen island; Walk-in closet(s); Pantry; Granite counters; Entrance foyer; Chandelier; Multi-panel doors; Recessed lighting; Vaulted ceilings
- Laundry & utility: Main-level laundry room
Neighborhood map
What this means for you Summary
Snapshot
- This is a 2-bed/2.0-bath condo listed at $255k.
Deal economics
- At list price, monthly cash flow is $-292 ($-3k/yr) — negative.
- To cash-flow at today's rent, offer at most $203k (20.2% below list).
- To meet the 1% rule (rent ≥ 1% of price), the offer needs to be $199k (21.8% below list).
- Recommended offer: $199k (21.8% below list) — sets the bar for 1% rule.
Location & tenants
- Location reads 82/100 on livability (#63 in KY, #1,246 nationally) — a professional / high-income tenant draw. Strengths: crime A+, commute A+, employment A+; Watch: amenities F.
- Kenton County (suburban): math 42% / reading 48% proficiency, ranked #14 of 165 in KY (top 8%) — families likely to look elsewhere, expect single-tenant / working-renter base with shorter leases.
- Zoned schools: Woodland Middle School (math 38% / reading 50%, grade D, #40 of 217 statewide, top 19%, 616 students, 48% FRL); Scott High School (math 33% / reading 33%, grade F, #94 of 254 statewide, top 37%, 1,071 students, 42% FRL).
- Market conditions: 319 active listings in the ZIP; 6 comparable units currently listed for rent nearby; rentals at typical pace (median 24d on market — plan ~3-4 weeks tenant-placement turnaround); solid renter incomes; 699 units permitted in Kenton County in 2024 (287 in 5+ unit buildings).
Forward outlook
- Local home prices are declining (-3.0%/yr); year-one equity from $2k of loan paydown is wiped out by about $8k of value loss. Plan a longer hold.
- Kenton County population projected at +5% by 2050 — modest demand growth; plan on rents tracking national, not racing it.
Negotiation context
- It's been on market 16 days — a 2% lower offer ($251k) is reasonable based on typical stale-listing flexibility.
Questions for the listing agent
- What do current leases actually rent for vs. the listed asking? Can we see a recent rent roll and the last 12 months of T-12 income?
- What does the HOA fee cover, when was the last increase, and are there any pending special assessments or reserve-fund shortfalls?
- Any open or pending special assessments — roof, HVAC, plumbing, elevator, façade? What's the per-unit balance and payoff schedule, and is the seller paying it off at close or rolling it to the buyer?
- Is there a deadline driving the sale (1031 exchange, divorce, estate, relocation)? That informs how much negotiation room exists.
- The area grade is low — what's the realistic commute time and amenity access for the typical tenant pool here? Any planned neighborhood developments (good or bad) we should know about?
- What's the average days-on-market for RENTAL listings here right now (not sales)? A rising rental-DOM trend means longer vacancies and softer asking-rent achievability than the comps imply.
- What's the recent tenant-quality profile in this submarket — average credit score on applications, eviction rate, late-payment / NSF rate, and stable-employment percentage? A property-management company in the area should have these aggregated.
- How much new apartment / multifamily construction is in the pipeline within 1–3 miles? Heavy new supply (>2% of stock underway) typically softens rents 12–24 months out; light construction supports rent growth.
Investment metrics
- 1% rule
- 0.78% ✗
- Cap rate
- 4.92%
- Cash-on-cash
- -4.90%
- DSCR
- 0.78
- GRM
- 10.7
CMA / ARV
- ARV (median comp)
- $288,998
- List price
- $255,000
- Delta
- -11.76%
- Verdict
- UNDERPRICED
- Comps
- 20 within 1.0 mi
Projected returns pro-forma
-3.0% appreciation · 3.0% rent growth · sell at horizon
- IRR
- -24.6%
- Equity multiple
- 0.16×
- Total profit
- $-59,798
- Equity at exit
- $38,021
- IRR
- -20.0%
- Equity multiple
- -0.06×
- Total profit
- $-75,601
- Equity at exit
- $22,048
Cash invested: $71,400 (down + closing). Projections, not guarantees.
Landlord ↔ Tenant lean methodology
- Overall (STATE)
- 83 Strongly Landlord-Friendly
- State Kentucky
- 83 Strongly Landlord-Friendly · R+16
- County
- — inherits STATE
- City
- — inherits STATE
ZIP-level market 41017
- Active inventory
- 319
- Price-to-rent
- 10.7×
Monthly cashflow live
- Estimated rent
- $1,994 high interval (Pro) →
- Mortgage (P&I)
- −$1,337
- Tax from tax record
- −$206 /mo · $2,474/yr
- Insurance
- −$106
- HOA
- −$217
- Vacancy / Maint / Mgmt
- −$419
- Net cashflow
- $-292
Break-even live
UW: 25.0% down · 7.5% · 30yr · 1.5% tax · 5.0% vac · 8.0% maint · 8.0% mgmt
Financing live
Cash to close
- Down payment
- $63,750
- Closing costs
- $7,650
- Reserves months
- —
- Total cash needed
- —
Loan-product check · same deal, 3 products live
Conventional
25% down · 7.5% · 30yr
- Down + closing
- —
- Monthly P&I
- —
- Monthly cashflow
- —
- DSCR
- —
- Eligible?
- —
Personal DTI + credit; lowest rate.
DSCR
20% down · 8.5% · 30yr
- Down + closing
- —
- Monthly P&I
- —
- Monthly cashflow
- —
- DSCR
- —
- Eligible?
- —
No personal income docs; deal must DSCR.
Hard money
10% down · 12.0% · 12mo
- Down + closing
- —
- Monthly P&I
- —
- Monthly cashflow
- —
- DSCR
- —
- Eligible?
- —
Short-term bridge; refi at stabilization.
Rent comps 6 comps
| Address | Beds | Baths | Sqft | Rent | $/sqft | DOM | Units | Dist |
|---|---|---|---|---|---|---|---|---|
| 3885 Volterra Ln Ft Mitchell, KY | 3.0 | 2.5 | 1250 | $2,495 | $2.00 | 44d | 1 | 0.12mi |
| 5061 Old Taylor Mill Rd Unit TMA-013 Taylor Mill, KY | 2.0 | 2.0 | 1112 | $1,400 | $1.26 | 20d | 1 | 1.40mi |
| 5061 Old Taylor Mill Rd Unit TMA-193 Taylor Mill, KY | 2.0 | 2.0 | 1112 | $1,555 | $1.40 | 23d | 1 | 1.40mi |
| 5061 Old Taylor Mill Rd Unit TMA-235 Taylor Mill, KY | 2.0 | 2.0 | 1112 | $1,500 | $1.35 | 23d | 1 | 1.40mi |
| 5061 Old Taylor Mill Rd Unit TMA-064 Taylor Mill, KY | 2.0 | 2.0 | 1112 | $1,625 | $1.46 | 21d | 1 | 1.40mi |
| 5061 Sandman Dr Unit TMA-107 Taylor Mill, KY | 2.0 | 2.0 | 1112 | $1,610 | $1.45 | 44d | 1 | 1.41mi |
HOA detail condo
- Monthly dues
- $217 · $2,604/yr
- Assessments
- None detected in remarks — confirm with the listing agent.
Listing history 1 events
-
2026-05-12$255,000 Active 1076-char remark
ⓘ Source: listings_history table (triggers on properties + properties_extension) + one-shot
backfill from property_details.listing_events for pre-trigger history.
Tax reassessment forecast KY · Resets to sale price
- Current annual tax
- $2,474 · $206/mo
- Projected year-2 tax
- $2,474 · $206/mo
- Expected delta
- $0/yr ($0/mo · 0.0%)
ⓘ Screening estimate from a state-policy table — verify with the county assessor before closing.
Climate risk First Street
- Flood 1/10 Low FEMA zone X (unshaded) · 0% chance over 30 yrs
- Wildfire 2/10 Low
- Heat 4/10 Moderate 7 d/yr ≥102°F today · 18 d/yr by 30 yrs out
- Wind 2/10 Low 100% chance of damaging wind over 30 yrs
- Air quality 3/10 Moderate 2 unhealthy d/yr today · 3 by 30 yrs out
Nearby sold comps map
Loading sold comps map…
Walkable amenities ~0.75 mi
Loading nearby amenities…
Taxation est. · year 1
- Rental income
- $23,925
- − Mortgage interest
- −$14,284
- − Property taxes
- −$2,474
- − Insurance
- −$1,275
- − Repairs & maintenance
- −$1,914
- − Management
- −$1,914
- − HOA
- −$2,604
- − Depreciation
- −$7,418
- Taxable loss
- −$7,958
- Est. tax savings @ 24.0%
- +$1,910
- After-tax cash flow
- $-1,589/yr
For passive investors: Depreciation is non-cash, so a rental often shows a tax loss while cash-flowing — sheltering income. Rental losses are passive: they offset passive income freely, and up to $25,000/yr can offset ordinary (W-2) income if you actively participate and your MAGI is under $100k (phasing out to $0 by $150k); unused losses carry forward. On sale, claimed depreciation is recaptured at up to 25%, and gains may owe capital-gains tax (a 1031 exchange can defer both). Figures are a year-1 estimate at your 24.0% rate — not tax advice; consult a CPA.
Schools (NCES district)
- District
- Kenton County
- NCES district ID
- 2103090
- Math proficiency
- 42% ▼ -13.00%
- Reading proficiency
- 48% ▼ -14.00%
- Median HH income
- $66,183
- Composite
- 40.17/100
- National rank
- #3789
- State rank
- #14 of 165 in KY
Livability — Taylor Mill
- Score
- 82/100
- State rank
- #63
- US rank
- #1246
Category grades
Schools grade is shown separately in the Schools card above.
Census & demographics
- Census place
- Taylor Mill, KY
- County
- Kenton County · 142,881 people
- Metro
- Cincinnati, OH-KY-IN
- Population (ZIP)
- 40,719
- Household income
- $97,274
- Rent vs Own
- Severe rent burden
- 486.0
Population outlook (Kenton County) Hauer SSP2
- Today (2025)
- 174,205 people
- By 2030
- 177,897 · +2.1%
- By 2040
- 182,671 · +4.9%
- By 2050
- 183,543 · +5.4%
- By 2075
- 178,977 · +2.7%
- By 2100
- 159,920 · -8.2%
Race, ethnicity, and origin ACS 2023
- Neighborhood character
- Predominantly White (91%)
- Race & ethnicity
- White 91% Two or more races 3% Black 3% Hispanic / Latino 2% Asian 2%
- Common ancestry
- Italian 4% Lithuanian 3% Slovak 2%
- Foreign-born
- 5% · Canada, Philippines
- Languages at home
- 95% English-only · Spanish 1% Arabic 1% French/Haitian/Cajun 1%
Political lean MEDSL · Kenton
- 2024 margin
- Strong R (+21.7) · D 38.2% · R 59.9% · Other 1.9%
- 2008→2024 swing
- -0.9pp no change · 2008: -20.9pp · 2024: -21.7pp
- All cycles
- 2024: R+21.7 2020: R+19.3 2016: R+26.1 2012: R+24.3 2008: R+20.9
Not yet ingested
- Civics
- —
Market trends
- HPI YoY
- ▼ -233.73%
- Current HPI
- 211.571
- Rent YoY
- —
- Metro
- Cincinnati, OH-KY-IN
- State GDP YoY
- ▲ 1.81%
- F500 in state
- 4
Industry mix (Fortune 500 HQ in KY)
| Industry | F500 HQs | Revenue |
|---|---|---|
| Healthcare | 1 | $118B |
|
||
| Food / Beverage | 1 | $7B |
|
||
Price history
2 events — show timeline
- 2026-05-29 Pending — NKMLS
- 2026-05-12 Listed $255,000 NKMLS
Property tax history
-3.2%/yrLatest (2025): $2,474 · -3.2% YoY. Source: county tax records.
Cash-flow waterfall
monthlySold comps — $/sqft
last 12 mo · ≤1 miLoading sold comps…