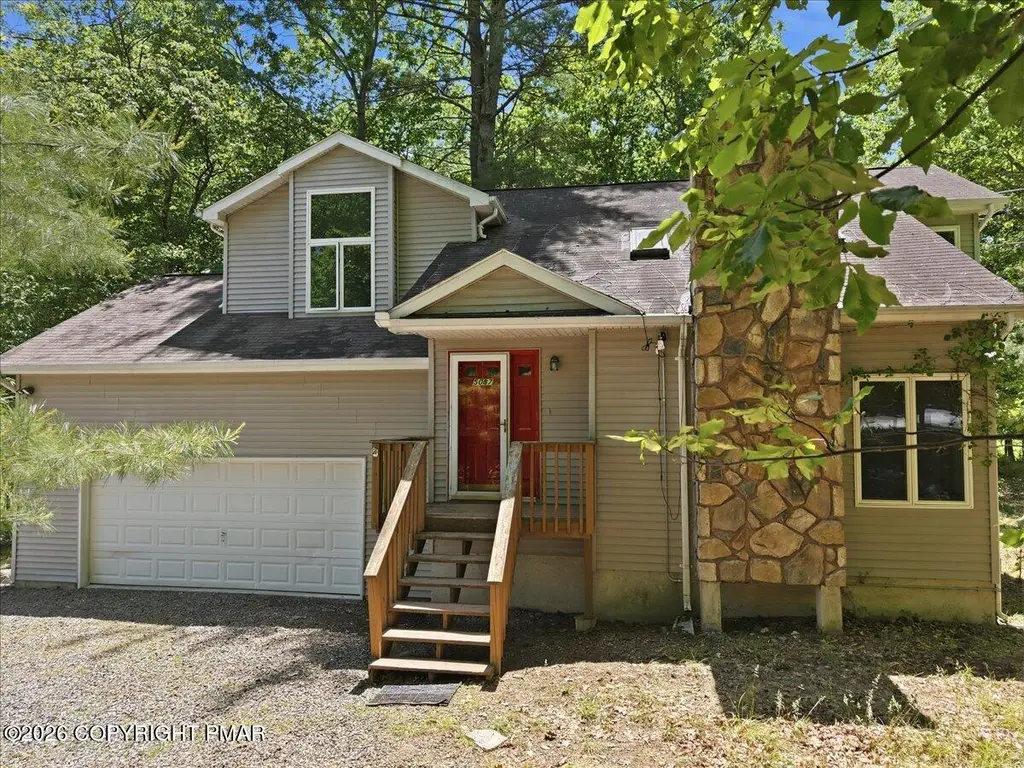
5087 Yukon Dr · Saw Creek, PA
Flood risk 1/10 · Minimal
- FEMA flood zone
- X (unshaded)
- Chance of flooding over 30 yrs
- 0.0%
- Est. flood insurance / yr
- $473 – $860
Fire risk 4/10 · Minor
- Est. fire insurance / yr
- $511 – $949
Heat risk 3/10 · Minor
- Hot days now (above 96°F)
- 7 days/yr
- Hot days in 30 yrs
- 15 days/yr
Wind risk 4/10 · Minor
- Chance of severe wind over 30 yrs
- 9.0%
Air-quality risk 2/10 · Minimal
- Unhealthy air days now
- 1 days/yr
- Unhealthy air days in 30 yrs
- 2 days/yr
Risk factors via First Street. Map © Google.
Why this score? — see what drove the D- grade
The composite is a weighted blend of 9 inputs, each scored 0–100. Each bar is that input's sub-score; the figure is the points it added to the 100-point composite (weight × sub-score).
- Cash flow +14.3/30.0
- 1% rule +4.8/10.0
- DSCR +4.4/10.0
- Schools +3.0/10.0
- Livability +3.0/5.0
- ARV discount +2.7/15.0
- Rent growth +2.5/5.0
- Condition / age +2.5/5.0
- Appreciation +0.0/10.0
$275,000
🖨 Deal sheet (PDF) 📄 Offer letter ✓ Due diligence
Key facts
- Screened in porch
- Full basement
- Private wooded lot
Tags
Property features AI
Finance
- HOA & community: Homeowners association with annual fee (approximately $1,074.60 per year; about $89.55/month); Community amenities include security, clubhouse, playground, recreation facilities, tennis courts, and pool
Exterior
- Parking: Attached garage with 2 covered spaces (side-by-side, garage faces front)
- Utilities: Well water; Mound septic
- Home design: Single family house; Residential property; Residential zoning
- Construction: Stone and vinyl siding exterior; Block foundation; Built as a house
- Exterior features: Front porch; Asphalt roof
Interior
- Kitchen: Electric cooktop; Portable dishwasher
- Flooring: Hardwood floors
- Bathrooms: Two full bathrooms; One half bathroom
- Heating & cooling: Heat pump heating; Heat pump cooling
- Interior features: Eat-in kitchen; Cathedral ceilings; Open floorplan; Unfurnished; Fireplace (1)
Neighborhood map
What this means for you Summary
Snapshot
- This is a 3-bed/2.5-bath single-family listed at $275k.
Deal economics
- At list price, monthly cash flow is $51 ($610/yr) — positive.
- The deal already cash-flows at list — no discount required.
- To meet the 1% rule (rent ≥ 1% of price), the offer needs to be $270k (1.8% below list).
- Recommended offer: $270k (1.8% below list) — sets the bar for 1% rule.
- Cap rate 6.5% vs local median 4.5% in Saw Creek — top-decile yield for the area; either an underpriced asset or a hidden risk that comps aren't pricing in. Stress-test before assuming the spread holds.
Location & tenants
- Location reads 59/100 on livability (#1,538 in PA) — a working-class tenant base; expect higher turnover. Strengths: crime A+, cost of living A+, housing A+; Watch: employment C-, health & safety D, amenities F.
- East Stroudsburg Area SD (rural): math 25% / reading 43% proficiency, ranked #413 of 539 in PA (top 77%) — families likely to look elsewhere, expect single-tenant / working-renter base with shorter leases.
- Zoned schools: Resica El Sch (math 27% / reading 47%, grade F, #1,004 of 1,518 statewide, top 68%, 416 students, 62% FRL); Lehman Intermediate Sch (math 11% / reading 44%, grade F, #399 of 512 statewide, top 79%, 603 students, 59% FRL); East Stroudsburg Shs North (math 29% / reading 24%, grade F, #371 of 437 statewide, top 85%, 940 students, 54% FRL) — zoned schools average 59% FRL vs 42% district-wide (17 pts higher); higher-poverty schools than district average — tighter screening recommended.
- Market conditions: 272 active listings in the ZIP; 1 comparable units currently listed for rent nearby; 278 units permitted in Monroe County in 2024 (52 in 5+ unit buildings).
Forward outlook
- Local home prices are declining (-3.0%/yr); year-one equity from $2k of loan paydown is wiped out by about $8k of value loss. Plan a longer hold.
- Monroe County population projected at -11% by 2050 — secular population decline; favor cash flow + early exit over multi-decade hold.
Negotiation context
- Only 8 days on market — expect competitive offers; lowballing is unlikely to land.
- Current owner paid $15k; list at $275k implies a 1733% gain — meaningful room to come down on a strong offer.
Questions for the listing agent
- What does the HOA fee cover, when was the last increase, and are there any pending special assessments or reserve-fund shortfalls?
- Is there a deadline driving the sale (1031 exchange, divorce, estate, relocation)? That informs how much negotiation room exists.
- Schools are F-rated, which usually means shorter tenancies and higher turnover. Who's the typical renter profile here, and what's been the actual vacancy rate?
- The area grade is low — what's the realistic commute time and amenity access for the typical tenant pool here? Any planned neighborhood developments (good or bad) we should know about?
- What's the average days-on-market for RENTAL listings here right now (not sales)? A rising rental-DOM trend means longer vacancies and softer asking-rent achievability than the comps imply.
- What's the recent tenant-quality profile in this submarket — average credit score on applications, eviction rate, late-payment / NSF rate, and stable-employment percentage? A property-management company in the area should have these aggregated.
- How much new for-sale + rental construction is in the pipeline within 1–3 miles? Heavy new supply typically softens prices + rents 12–24 months out; constrained supply supports both.
Investment metrics
- 1% rule
- 0.98% ✗
- Cap rate
- 6.51%
- Cash-on-cash
- 0.79%
- DSCR
- 1.04
- GRM
- 8.5
CMA / ARV
- ARV (on-the-fly)
- $248,455
- Comps found
- 8
Show comp detail 8 sales within ~0.75 mi
| Address | Dist | Beds/Ba | Sqft | Sold | Price | $/sf | Match |
|---|---|---|---|---|---|---|---|
| 301 Sellersville Dr Dr | 0.09mi | 2/1.5 (-1) | 1,200 (-11%) | 6mo | $195,000 | $163 | 64 |
| 1528 Sugar Maple Ln | 0.41mi | 3/2.5 | 1,335 (-1%) | 20mo | $215,000 | $161 | 64 |
| 1274 Park Dr | 0.35mi | 3/2.0 | 1,282 (-4%) | 14mo | $205,000 | $160 | 63 |
| 303 Sellersville Dr | 0.11mi | 3/1.5 | 1,176 (-12%) | 14mo | $239,900 | $204 | 59 |
| 210 Clubhouse Dr | 0.68mi | 3/2.0 | 1,332 (-1%) | 8mo | $205,000 | $154 | 58 |
| 2508 Kline Ct | 0.49mi | 3/2.0 | 1,400 (+4%) | 13mo | $290,000 | $207 | 58 |
| 223 Clubhouse Dr | 0.67mi | 4/2.0 (+1) | 1,326 (-1%) | 7mo | $245,000 | $185 | 54 |
| 170 Clubhouse Dr | 0.59mi | 3/2.0 | 1,344 (+0%) | 22mo | $277,700 | $207 | 52 |
Match score weights: distance 35% · size 25% · config 20% · recency 20%. Top-matched comps best support the ARV.
Projected returns pro-forma
-3.0% appreciation · 3.0% rent growth · sell at horizon
- IRR
- -15.0%
- Equity multiple
- 0.47×
- Total profit
- $-41,174
- Equity at exit
- $41,003
- IRR
- -6.3%
- Equity multiple
- 0.60×
- Total profit
- $-31,068
- Equity at exit
- $23,777
Cash invested: $77,000 (down + closing). Projections, not guarantees.
Landlord ↔ Tenant lean methodology
- Overall (STATE)
- 62 Landlord-Friendly
- State Pennsylvania
- 62 Landlord-Friendly · EVEN
- County
- — inherits STATE
- City
- — inherits STATE
ZIP-level market 18302
- Home prices YoY
- -20.6%
- Active inventory
- 272
- Price-to-rent
- 8.5×
Monthly cashflow live
- Estimated rent
- $2,700 medium interval (Pro) →
- Mortgage (P&I)
- −$1,442
- Tax from tax record
- −$435 /mo · $5,226/yr
- Insurance
- −$115
- HOA
- −$90
- Vacancy / Maint / Mgmt
- −$567
- Net cashflow
- $51
Break-even live
Sensitivity live
| Price | -10% $206 | -5% $129 | +0% $51 | +5% $-27 | +10% $-105 |
|---|---|---|---|---|---|
| Rent | -10% $-162 | -5% $-56 | +0% $51 | +5% $157 | +10% $264 |
| Rate | -1.0pp $189 | -0.5pp $121 | base $51 | +0.5pp $-20 | +1.0pp $-93 |
UW: 25.0% down · 7.5% · 30yr · 1.5% tax · 5.0% vac · 8.0% maint · 8.0% mgmt
Financing live
Cash to close
- Down payment
- $68,750
- Closing costs
- $8,250
- Reserves months
- —
- Total cash needed
- —
Loan-product check · same deal, 3 products live
Conventional
25% down · 7.5% · 30yr
- Down + closing
- —
- Monthly P&I
- —
- Monthly cashflow
- —
- DSCR
- —
- Eligible?
- —
Personal DTI + credit; lowest rate.
DSCR
20% down · 8.5% · 30yr
- Down + closing
- —
- Monthly P&I
- —
- Monthly cashflow
- —
- DSCR
- —
- Eligible?
- —
No personal income docs; deal must DSCR.
Hard money
10% down · 12.0% · 12mo
- Down + closing
- —
- Monthly P&I
- —
- Monthly cashflow
- —
- DSCR
- —
- Eligible?
- —
Short-term bridge; refi at stabilization.
Rent comps 1 comps
| Address | Beds | Baths | Sqft | Rent | $/sqft | DOM | Units | Dist |
|---|---|---|---|---|---|---|---|---|
| 1273 Chateau Dr East Stroudsburg, PA | 3.0 | 1.0 | 1073 | $2,700 | $2.52 | 45d | 1 | 1.19mi |
HOA detail
- Monthly dues
- $90 · $1,080/yr
Listing history 5 events
-
2026-06-09statusdays on market $275,000 Pending 8 DOM
-
2026-06-08days on market $275,000 Active 7 DOM
-
2026-06-07days on market $275,000 Active 6 DOM
-
2026-06-05days on market $275,000 Active 3 DOM
-
2026-06-02$275,000 Active 1 DOM
ⓘ Source: listings_history table (triggers on properties + properties_extension) + one-shot
backfill from property_details.listing_events for pre-trigger history.
Tax reassessment forecast PA · Partial reset (capped growth)
- Current annual tax
- $5,226 · $435/mo
- Projected year-2 tax
- $5,226 · $435/mo
- Expected delta
- $0/yr ($0/mo · 0.0%)
ⓘ Screening estimate from a state-policy table — verify with the county assessor before closing.
Climate risk First Street
- Flood 1/10 Low FEMA zone X (unshaded) · 0% chance over 30 yrs
- Wildfire 4/10 Moderate
- Heat 3/10 Moderate 7 d/yr ≥96°F today · 15 d/yr by 30 yrs out
- Wind 4/10 Moderate 9% chance of damaging wind over 30 yrs
- Air quality 2/10 Low 1 unhealthy d/yr today · 2 by 30 yrs out
Nearby sold comps map
Loading sold comps map…
Walkable amenities ~0.75 mi
Loading nearby amenities…
Taxation est. · year 1
- Rental income
- $32,400
- − Mortgage interest
- −$15,404
- − Property taxes
- −$5,226
- − Insurance
- −$1,375
- − Repairs & maintenance
- −$2,592
- − Management
- −$2,592
- − HOA
- −$1,080
- − Depreciation
- −$8,000
- Taxable loss
- −$3,869
- Est. tax savings @ 24.0%
- +$929
- After-tax cash flow
- $1,538/yr
For passive investors: Depreciation is non-cash, so a rental often shows a tax loss while cash-flowing — sheltering income. Rental losses are passive: they offset passive income freely, and up to $25,000/yr can offset ordinary (W-2) income if you actively participate and your MAGI is under $100k (phasing out to $0 by $150k); unused losses carry forward. On sale, claimed depreciation is recaptured at up to 25%, and gains may owe capital-gains tax (a 1031 exchange can defer both). Figures are a year-1 estimate at your 24.0% rate — not tax advice; consult a CPA.
Schools (NCES district)
- District
- East Stroudsburg Area SD
- NCES district ID
- 4208670
- Math proficiency
- 25% ▼ -11.00%
- Reading proficiency
- 43% ▼ -18.00%
- Median HH income
- $57,142
- Composite
- 30.13/100
- National rank
- #6332
- State rank
- #413 of 539 in PA
Livability — Saw Creek
- Score
- 59/100
- State rank
- #1538
- US rank
- #20241
Category grades
Schools grade is shown separately in the Schools card above.
Census & demographics
- Population (ZIP)
- 17,593
Population outlook (Monroe County) Hauer SSP2
- Today (2025)
- 164,099 people
- By 2030
- 161,412 · -1.6%
- By 2040
- 154,616 · -5.8%
- By 2050
- 146,710 · -10.6%
- By 2075
- 140,830 · -14.2%
- By 2100
- 138,472 · -15.6%
Race, ethnicity, and origin ACS 2023
- Neighborhood character
- Diverse neighborhood (Simpson 0.63)
- Race & ethnicity
- White 53% Hispanic / Latino 24% Black 17% Two or more races 12% Asian 2%
- Hispanic origin (detail)
- Puerto Rican 8% Dominican 2%
- Common ancestry
- Romanian 4% Lithuanian 2% Slovak 2%
- Foreign-born
- 13% · Canada, Jamaica
- Languages at home
- 79% English-only · Spanish 13% Other Indo-European 2% French/Haitian/Cajun 2%
Political lean MEDSL · Monroe
- 2024 margin
- Toss-up / Even · D 49.1% · R 49.9%
- 2008→2024 swing
- -17.1pp toward R · 2008: 16.3pp · 2024: -0.8pp
- All cycles
- 2024: R+0.8 2020: D+6.4 2016: D+0.3 2012: D+14.0 2008: D+16.3
Not yet ingested
- Civics
- —
Market trends
- HPI YoY
- ▼ -41.00%
- Current HPI
- 157.9833
- Rent YoY
- —
- Metro
- —
- State GDP YoY
- ▲ 1.68%
- F500 in state
- 34
Industry mix (Fortune 500 HQ in PA)
| Industry | F500 HQs | Revenue |
|---|---|---|
| Healthcare | 2 | $309B |
|
||
| Insurance | 2 | $27B |
|
||
| Telecommunications / Media | 1 | $124B |
|
||
| Industrial Distribution | 1 | $22B |
|
||
| Financial Services | 1 | $20B |
|
||
| Chemicals / Materials | 1 | $18B |
|
||
Price history
+1733.3% since first listed2 events — show timeline
- 2026-06-01 Listed $275,000 PMAR
- 1994-11-28 Sold (Public Records) $15,000 Public Records
Property tax history
-1.4%/yrLatest (2026): $5,226 · +1.6% YoY. Source: county tax records.
Cash-flow waterfall
monthlySold comps — $/sqft
last 12 mo · ≤1 miLoading sold comps…