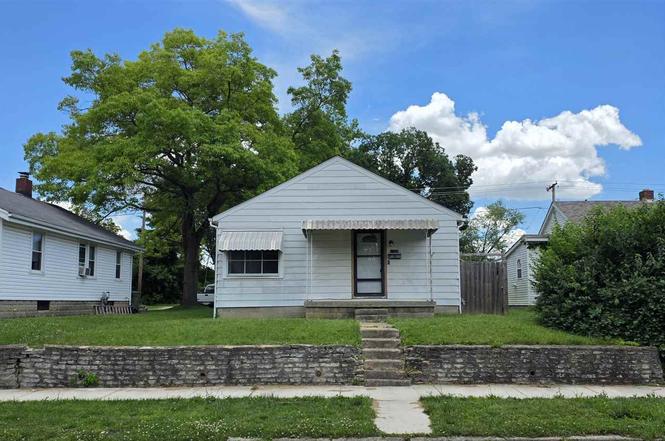
1329 S 5th St · Richmond, IN
Flood risk 1/10 · Minimal
- FEMA flood zone
- X (unshaded)
- Chance of flooding over 30 yrs
- 0.0%
- Est. flood insurance / yr
- $507 – $1,088
Fire risk 1/10 · Minimal
- Est. fire insurance / yr
- $717 – $1,331
Heat risk 3/10 · Minor
- Hot days now (above 100°F)
- 7 days/yr
- Hot days in 30 yrs
- 18 days/yr
Wind risk 2/10 · Minimal
- Chance of severe wind over 30 yrs
- 1.0%
Air-quality risk 3/10 · Minor
- Unhealthy air days now
- 2 days/yr
- Unhealthy air days in 30 yrs
- 3 days/yr
Risk factors via First Street. Map © Google.
Why this score? — see what drove the B grade
The composite is a weighted blend of 9 inputs, each scored 0–100. Each bar is that input's sub-score; the figure is the points it added to the 100-point composite (weight × sub-score).
- Cash flow +30.0/30.0
- ARV discount +15.0/15.0
- DSCR +10.0/10.0
- 1% rule +7.8/10.0
- Livability +4.2/5.0
- Rent growth +2.5/5.0
- Condition / age +2.5/5.0
- Schools +1.9/10.0
- Appreciation +0.0/10.0
$79,000
🖨 Deal sheet (PDF) 📄 Offer letter ✓ Due diligence
Listing remarks MLS
Welcome to 1329 S 5th Street! This affordable 3-bedroom, 1-bath home offers a fantastic opportunity for homeowners and investors alike. Featuring a spacious living room with hardwood floors, central heating and air conditioning, and a functional layout, this home is move-in ready while still offering plenty of room to add your own updates and personal touches. The kitchen includes appliances that will remain with the property, and the home also features an electric water heater, a gas range, and a privacy-fenced backyard. Outside, you'll find a detached 2-car garage with electricity already in place, providing excellent storage, workshop space, or parking. Whether you're looking for an affordable place to call home, your next rental property, or a value-add investment, it's hard to beat the price and potential this property offers. Conveniently located near schools, shopping, and local amenities, this is an opportunity you won't want to miss.
Key facts
- Excellent storage
- Hardwood floors
- Gas range
Tags
Property features AI
Exterior
- Parking: Detached 2-car garage
- Utilities: Public water; Public sewer; Cable available
- Home design: Single-family residence; One-story
- Construction: Metal siding; Shingle roof
- Exterior features: Wood fencing; Lot approximately 41 x 130
Interior
- Bedrooms: Total of 5 rooms (includes living spaces and bedrooms)
- Bathrooms: 1 full bathroom
- Heating & cooling: Forced air heating (natural gas); Central air conditioning
- Interior features: Electric water heater; Crawl space basement
Neighborhood map
What this means for you Summary
Snapshot
- This is a 3-bed/1.0-bath single-family listed at $79k.
Deal economics
- At list price, monthly cash flow is $312 ($4k/yr) — positive.
- The deal already cash-flows at list — no discount required.
- Meets the 1% rule at list price ($1k rent vs $79k).
- Cap rate 11.0% vs local median 5.2% in Richmond — top-decile yield for the area; either an underpriced asset or a hidden risk that comps aren't pricing in. Stress-test before assuming the spread holds.
Location & tenants
- Location reads 83/100 on livability (#10 in IN, #869 nationally) — a professional / high-income tenant draw. Strengths: commute A+, cost of living A+, housing A+; Watch: crime D+, employment D-.
- Richmond Community Schools (town): math 18% / reading 27% proficiency, ranked #270 of 301 in IN (top 90%) — low school quality limits family demand, transient renter base, plan for 1-2y turnover; 65% free/reduced lunch — lower-income household profile, screen leases tightly.
- Zoned schools: Vaile Elementary School (math 17% / reading 22%, grade F, #814 of 994 statewide, top 83%, 304 students, 92% FRL); Test Intermediate School (math 13% / reading 24%, grade F, #276 of 330 statewide, top 84%, 762 students, 75% FRL); Richmond High School (math 21% / reading 48%, grade F, #270 of 369 statewide, top 77%, 1,332 students, 66% FRL).
- Market conditions: 277 active listings in the ZIP; 2 comparable units currently listed for rent nearby; 38 units permitted in Wayne County in 2024 (0 in 5+ unit buildings).
Forward outlook
- Local home prices are declining (-3.0%/yr); year-one equity from $546 of loan paydown is wiped out by about $2k of value loss. Plan a longer hold.
- Wayne County population projected at -21% by 2050 — secular population decline; favor cash flow + early exit over multi-decade hold.
- At projected returns (-3.0% appreciation + 3.0% rent growth), your $22k cash investment doubles in ~8 years — after that, you're playing with house money.
Negotiation context
- Only 4 days on market — expect competitive offers; lowballing is unlikely to land.
- 3 sale attempts since 12y ago with the ask held roughly flat each time — persistent listings suggest the price (not the market) is what's stuck; bring a comps-based counter.
- Current owner paid $28k; list at $79k implies a 182% gain — meaningful room to come down on a strong offer.
Risks & watch-outs
- Watch-outs: built in 1949 — expect roof / HVAC / electrical / plumbing capex.
Questions for the listing agent
- Built in 1949 — when were the roof, HVAC, electrical panel, plumbing, and water heater last replaced?
- Is there a deadline driving the sale (1031 exchange, divorce, estate, relocation)? That informs how much negotiation room exists.
- Schools are D-rated, which usually means shorter tenancies and higher turnover. Who's the typical renter profile here, and what's been the actual vacancy rate?
- Crime grade is D in this area — have there been break-ins, vandalism, or insurance claims at this property in the last 3 years? What carrier currently insures it and at what premium?
- What's the average days-on-market for RENTAL listings here right now (not sales)? A rising rental-DOM trend means longer vacancies and softer asking-rent achievability than the comps imply.
- What's the recent tenant-quality profile in this submarket — average credit score on applications, eviction rate, late-payment / NSF rate, and stable-employment percentage? A property-management company in the area should have these aggregated.
- How much new for-sale + rental construction is in the pipeline within 1–3 miles? Heavy new supply typically softens prices + rents 12–24 months out; constrained supply supports both.
Investment metrics
- 1% rule
- 1.28% ✓
- Cap rate
- 11.02%
- Cash-on-cash
- 16.90%
- DSCR
- 1.75
- GRM
- 6.5
CMA / ARV
- ARV (on-the-fly)
- $149,040
- Comps found
- 12
Show comp detail 12 sales within ~0.75 mi
| Address | Dist | Beds/Ba | Sqft | Sold | Price | $/sf | Match |
|---|---|---|---|---|---|---|---|
| 1229 S 4th St | 0.12mi | 2/1.0 (-1) | 1,056 (-4%) | 6mo | $95,000 | $90 | 77 |
| 634 S Q St | 0.38mi | 2/— (-1) | 1,051 (-5%) | 3mo | $93,500 | $89 | 67 |
| 717 S 7th St | 0.50mi | 2/1.0 (-1) | 1,126 (+2%) | 2mo | $89,900 | $80 | 66 |
| 1019 Parry St | 0.46mi | 3/1.0 | 1,036 (-6%) | 3mo | $72,000 | $69 | 66 |
| 1061 SW 5th St | 0.67mi | 3/1.0 | 1,112 (+1%) | 5mo | $156,900 | $141 | 63 |
| 1201 Parry St | 0.56mi | 3/1.0 | 1,008 (-9%) | 1mo | $142,000 | $141 | 59 |
| 113 SW I St | 0.52mi | 3/2.0 | 1,080 (-2%) | 12mo | $169,900 | $157 | 58 |
| 905 SW 1st St | 0.47mi | 2/1.0 (-1) | 986 (-11%) | 2mo | $90,000 | $91 | 54 |
| 100 SW H St | 0.61mi | 3/1.0 | 1,216 (+10%) | 10mo | $164,000 | $135 | 46 |
| 106 SW G St | 0.64mi | 3/1.0 | 1,260 (+14%) | 9mo | $177,000 | $140 | 39 |
| 1601 S P St | 0.74mi | 2/1.0 (-1) | 1,200 (+9%) | 11mo | $59,900 | $50 | 37 |
| 121 SW I St | 0.55mi | 2/2.0 (-1) | 962 (-13%) | 9mo | $134,900 | $140 | 37 |
Match score weights: distance 35% · size 25% · config 20% · recency 20%. Top-matched comps best support the ARV.
Projected returns pro-forma
-3.0% appreciation · 3.0% rent growth · sell at horizon
- IRR
- 8.1%
- Equity multiple
- 1.32×
- Total profit
- $7,017
- Equity at exit
- $11,779
- IRR
- 17.3%
- Equity multiple
- 2.43×
- Total profit
- $31,570
- Equity at exit
- $6,830
Cash invested: $22,120 (down + closing). Projections, not guarantees.
Landlord ↔ Tenant lean methodology
- Overall (STATE)
- 90 Strongly Landlord-Friendly
- State Indiana
- 90 Strongly Landlord-Friendly · R+11
- County
- — inherits STATE
- City
- — inherits STATE
ZIP-level market 47374
- Active inventory
- 277
- Price-to-rent
- 6.5×
Monthly cashflow live
- Estimated rent
- $1,010 medium interval (Pro) →
- Mortgage (P&I)
- −$414
- Tax from tax record
- −$39 /mo · $468/yr
- Insurance
- −$33
- HOA
- −$0
- Vacancy / Maint / Mgmt
- −$212
- Net cashflow
- $312
Break-even live
Sensitivity live
| Price | -10% $356 | -5% $334 | +0% $312 | +5% $289 | +10% $267 |
|---|---|---|---|---|---|
| Rent | -10% $232 | -5% $272 | +0% $312 | +5% $351 | +10% $391 |
| Rate | -1.0pp $351 | -0.5pp $332 | base $312 | +0.5pp $291 | +1.0pp $270 |
UW: 25.0% down · 7.5% · 30yr · 1.5% tax · 5.0% vac · 8.0% maint · 8.0% mgmt
Financing live
Cash to close
- Down payment
- $19,750
- Closing costs
- $2,370
- Reserves months
- —
- Total cash needed
- —
Loan-product check · same deal, 3 products live
Conventional
25% down · 7.5% · 30yr
- Down + closing
- —
- Monthly P&I
- —
- Monthly cashflow
- —
- DSCR
- —
- Eligible?
- —
Personal DTI + credit; lowest rate.
DSCR
20% down · 8.5% · 30yr
- Down + closing
- —
- Monthly P&I
- —
- Monthly cashflow
- —
- DSCR
- —
- Eligible?
- —
No personal income docs; deal must DSCR.
Hard money
10% down · 12.0% · 12mo
- Down + closing
- —
- Monthly P&I
- —
- Monthly cashflow
- —
- DSCR
- —
- Eligible?
- —
Short-term bridge; refi at stabilization.
Rent comps 2 comps
| Address | Beds | Baths | Sqft | Rent | $/sqft | DOM | Units | Dist |
|---|---|---|---|---|---|---|---|---|
| 1300 S 18th St Richmond, IN | 3.0 | 2.0 | 847 | $1,040 | $1.23 | 45d | 7 | 0.95mi |
| 1032 S 23rd St Richmond, IN | 1.0–2.0 | 1.0 | 937 | $790 | $0.84 | 45d | 4 | 1.27mi |
Listing history 5 events
-
2026-06-21days on market $79,000 Active 4 DOM
-
2026-06-19days on market $79,000 Active 2 DOM
-
2026-06-17$79,000 Active 1 DOM
-
2026-06-17remarks 699-char remark
-
2026-06-17$79,000 Active 1 DOM
ⓘ Source: listings_history table (triggers on properties + properties_extension) + one-shot
backfill from property_details.listing_events for pre-trigger history.
Tax reassessment forecast IN · Partial reset (capped growth)
- Current annual tax
- $468 · $39/mo
- Projected year-2 tax
- $570 · $47/mo
- Expected delta
- +$102/yr (+$8/mo · 21.7%)
ⓘ Screening estimate from a state-policy table — verify with the county assessor before closing.
Climate risk First Street
- Flood 1/10 Low FEMA zone X (unshaded) · 0% chance over 30 yrs
- Wildfire 1/10 Low
- Heat 3/10 Moderate 7 d/yr ≥100°F today · 18 d/yr by 30 yrs out
- Wind 2/10 Low 100% chance of damaging wind over 30 yrs
- Air quality 3/10 Moderate 2 unhealthy d/yr today · 3 by 30 yrs out
Nearby sold comps map
Loading sold comps map…
Walkable amenities ~0.75 mi
Loading nearby amenities…
Taxation est. · year 1
- Rental income
- $12,117
- − Mortgage interest
- −$4,425
- − Property taxes
- −$468
- − Insurance
- −$395
- − Repairs & maintenance
- −$969
- − Management
- −$969
- − Depreciation
- −$2,298
- Taxable income
- $2,592
- Est. tax owed @ 24.0%
- −$622
- After-tax cash flow
- $3,116/yr
For passive investors: Depreciation is non-cash, so a rental often shows a tax loss while cash-flowing — sheltering income. Rental losses are passive: they offset passive income freely, and up to $25,000/yr can offset ordinary (W-2) income if you actively participate and your MAGI is under $100k (phasing out to $0 by $150k); unused losses carry forward. On sale, claimed depreciation is recaptured at up to 25%, and gains may owe capital-gains tax (a 1031 exchange can defer both). Figures are a year-1 estimate at your 24.0% rate — not tax advice; consult a CPA.
Schools (NCES district)
- District
- Richmond Community Schools
- NCES district ID
- 1809510
- Math proficiency
- 18% ▼ -7.00%
- Reading proficiency
- 27% ▼ -2.00%
- Median HH income
- $35,288
- Composite
- 18.55/100
- National rank
- #8913
- State rank
- #270 of 301 in IN
Livability — Richmond
- Score
- 83/100
- State rank
- #10
- US rank
- #869
Category grades
Schools grade is shown separately in the Schools card above.
Census & demographics
- Census place
- Richmond, IN
- County
- Wayne County · 44,615 people
- City population
- 44,615
- Metro
- Richmond, IN
- Population (ZIP)
- 44,615
- Household income
- $50,766
- Rent vs Own
- Severe rent burden
- 1600.0
Population outlook (Wayne County) Hauer SSP2
- Today (2025)
- 63,316 people
- By 2030
- 60,893 · -3.8%
- By 2040
- 55,386 · -12.5%
- By 2050
- 49,946 · -21.1%
- By 2075
- 37,900 · -40.1%
- By 2100
- 26,562 · -58.0%
Race, ethnicity, and origin ACS 2023
- Neighborhood character
- Predominantly White (82%)
- Race & ethnicity
- White 82% Two or more races 7% Black 6% Hispanic / Latino 4% Asian 1%
- Common ancestry
- Slovak 2% Italian 1% Lithuanian 1%
- Foreign-born
- 4% · Canada, China
- Languages at home
- 95% English-only · Spanish 3%
Political lean MEDSL · Wayne
- 2024 margin
- Solid R (+32.5) · D 32.9% · R 65.4% · Other 1.6%
- 2008→2024 swing
- -28.6pp toward R · 2008: -3.9pp · 2024: -32.5pp
- All cycles
- 2024: R+32.5 2020: R+29.1 2016: R+30.1 2012: R+14.7 2008: R+3.9
Not yet ingested
- Civics
- —
Market trends
- HPI YoY
- ▼ -118.64%
- Current HPI
- 182.5038
- Rent YoY
- —
- Metro
- Richmond, IN
- State GDP YoY
- ▲ 2.90%
- F500 in state
- 18
Industry mix (Fortune 500 HQ in IN)
| Industry | F500 HQs | Revenue |
|---|---|---|
| Industrial Machinery | 2 | $37B |
|
||
| Healthcare | 1 | $177B |
|
||
| Pharmaceuticals | 1 | $45B |
|
||
| Metals / Steel | 1 | $18B |
|
||
| Agriculture | 1 | $17B |
|
||
| Packaging | 1 | $12B |
|
||
Price history
+163.3% since first listed4 events — show timeline
- 2026-06-17 Listed $79,000 RRELMS
- 2026-06-16 Listed $79,000 MIBOR as Distributed by MLS Grid
- 2014-12-10 Sold (MLS) $28,000 RRELMS
- 2014-04-28 Listed $30,000 RRELMS
Property tax history
-5.0%/yrLatest (2024): $468 · +47.6% YoY. Source: county tax records.
Cash-flow waterfall
monthlySold comps — $/sqft
last 12 mo · ≤1 miLoading sold comps…