 Duplex
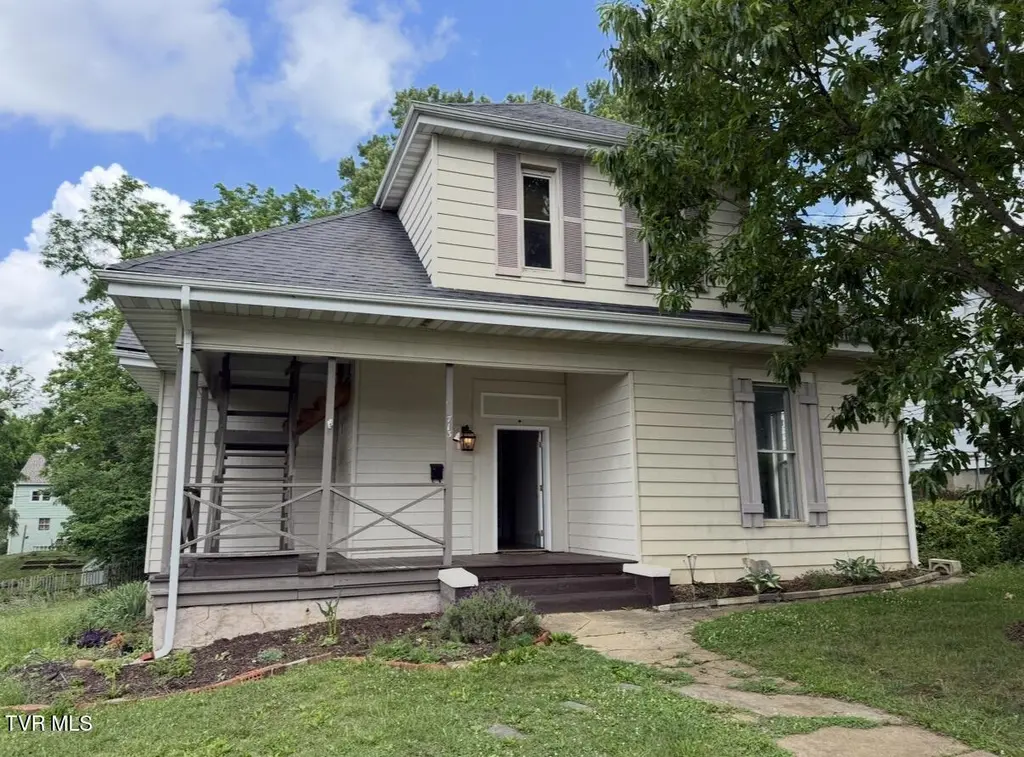
713 Ash St · Bristol, TN
Flood risk 1/10 · Minimal
- FEMA flood zone
- X (unshaded)
- Chance of flooding over 30 yrs
- 0.0%
- Est. flood insurance / yr
- $507 – $1,088
Fire risk 4/10 · Minor
- Est. fire insurance / yr
- $949 – $1,763
Heat risk 4/10 · Minor
- Hot days now (above 98°F)
- 7 days/yr
- Hot days in 30 yrs
- 21 days/yr
Wind risk 2/10 · Minimal
- Chance of severe wind over 30 yrs
- —
Air-quality risk 2/10 · Minimal
- Unhealthy air days now
- 1 days/yr
- Unhealthy air days in 30 yrs
- 2 days/yr
Risk factors via First Street. Map © Google.
Why this score? — see what drove the B+ grade
The composite is a weighted blend of 9 inputs, each scored 0–100. Each bar is that input's sub-score; the figure is the points it added to the 100-point composite (weight × sub-score).
- Cash flow +30.0/30.0
- ARV discount +15.0/15.0
- DSCR +10.0/10.0
- 1% rule +9.4/10.0
- Livability +3.7/5.0
- Schools +3.0/10.0
- Rent growth +2.5/5.0
- Condition / age +2.5/5.0
- Appreciation +0.0/10.0
$215,000
🖨 Deal sheet 📄 Offer letter ✓ Due diligence
Multi-family units
County records classify this as Multi-Family (2-4 Unit). Listing-text estimate: 2 units. confirmed
Listing remarks
ATTENTION INVESTORS: Turnkey, cash-flowing duplex at 713 Ash St, Bristol, TN offering immediate high-yield revenue! Over 3,100 total sq ft of massive investment and equity potential. Outstanding location--only blocks away from the YMCA, walkable to vibrant downtown Bristol for city activities and nightlife, and just a few blocks to Fairmont Elementary. Cleaned, updated, neutralized, and ready for an investor to maximize on day one. Unit 1 (Main Level): 2,100 sq ft configuration featuring 3 bedrooms, 2 full bathrooms, central air/heat, original hardwood floors, historic architectural grit, and a spacious covered front porch leading into a large entry foyer. The kitchen is loaded with high-
Key facts
- Outstanding location
- High-end appliances
- Turnkey duplex
Tags
Property features AI
Exterior
- Parking: Driveway
- Utilities: Public water; Public sewer
- Home design: Duplex / multi-family residential income property
- Construction: Aluminum siding; Shingle roof
- Exterior features: Deck; Level lot; Lot approximately 0.26 acres (78 x 145)
Interior
- Kitchen: Cooktop; Dishwasher; Double oven
- Flooring: Carpet; Hardwood
- Heating & cooling: Heat pump; Baseboard heating; Has cooling; Has heating
- Interior features: Cooktop, Dishwasher, Double Oven; Interior-entry basement
Neighborhood map
What this means for you Summary
Snapshot
- This is a 1×3bd/2ba + 1×?bd/?ba units multifamily listed at $215k.
Deal economics
- At list price, monthly cash flow is $1k ($13k/yr) — positive. Per door: $535/mo.
- The deal already cash-flows at list — no discount required.
- Meets the 1% rule at list price ($3k rent vs $215k).
- Recommended offer: $212k (1.5% below list) — sets the bar for market timing.
- Cap rate 12.3% vs local median 3.8% in Bristol — top-decile yield for the area; either an underpriced asset or a hidden risk that comps aren't pricing in. Stress-test before assuming the spread holds.
Location & tenants
- Location reads 73/100 on livability (#24 in TN) — a middle-class / working-renter tenant base. Strengths: cost of living A+, housing A+, health & safety A+; Watch: crime D+, commute F, employment F.
- Bristol (urban): math 37% / reading 35% proficiency, ranked #29 of 139 in TN (top 21%) — families likely to look elsewhere, expect single-tenant / working-renter base with shorter leases.
- Zoned schools: Tennessee High School (math 20% / reading 41%, grade F, #75 of 332 statewide, top 24%, 1,154 students, 0% FRL) — zoned schools average 0% FRL vs 46% district-wide (46 pts lower); this property's tenant base skews higher-income than the district average.
- Market conditions: 253 active listings in the ZIP; 1 comparable units currently listed for rent nearby; 453 units permitted in Sullivan County in 2024 (6 in 5+ unit buildings).
- At $3,092/mo this rent would consume 66% of the median local household income ($56k/yr) (locally 724% of renters already pay >50% of income on rent) — very limited rent-growth headroom before tenants either downsize or default.
Forward outlook
- Local home prices are declining (-3.0%/yr); year-one equity from $1k of loan paydown is wiped out by about $6k of value loss. Plan a longer hold.
- Sullivan County population projected to shrink 5% by 2050 — rents likely to lag national; underwrite the cash flow, not the appreciation.
- At projected returns (-3.0% appreciation + 3.0% rent growth), your $60k cash investment doubles in ~6 years — after that, you're playing with house money.
Negotiation context
- It's been on market 22 days — a 2% lower offer ($212k) is reasonable based on typical stale-listing flexibility.
Risks & watch-outs
- Watch-outs: built in 1910 — expect roof / HVAC / electrical / plumbing capex.
Questions for the listing agent
- Can we see the unit-by-unit rent roll, current vacancy, and any below-market leases? What's the average tenancy length?
- What capital expenditures (roof, boiler, parking lot, exteriors) have been made in the last 5 years, and what's planned in the next 2?
- Built in 1910 — when were the roof, HVAC, electrical panel, plumbing, and water heater last replaced?
- Is there a deadline driving the sale (1031 exchange, divorce, estate, relocation)? That informs how much negotiation room exists.
- Schools are D-rated, which usually means shorter tenancies and higher turnover. Who's the typical renter profile here, and what's been the actual vacancy rate?
- Crime grade is D in this area — have there been break-ins, vandalism, or insurance claims at this property in the last 3 years? What carrier currently insures it and at what premium?
- What's the average days-on-market for RENTAL listings here right now (not sales)? A rising rental-DOM trend means longer vacancies and softer asking-rent achievability than the comps imply.
- What's the recent tenant-quality profile in this submarket — average credit score on applications, eviction rate, late-payment / NSF rate, and stable-employment percentage? A property-management company in the area should have these aggregated.
- How much new apartment / multifamily construction is in the pipeline within 1–3 miles? Heavy new supply (>2% of stock underway) typically softens rents 12–24 months out; light construction supports rent growth.
Investment metrics
- 1% rule
- 1.44% ✓
- Cap rate
- 12.27%
- Cash-on-cash
- 21.33%
- DSCR
- 1.95
- GRM
- 5.8
CMA / ARV
- ARV (on-the-fly)
- $395,136
- Comps found
- 1
Show comp detail 1 sale within ~0.75 mi
| Address | Dist | Beds/Ba | Sqft | Sold | Price | $/sf | Match |
|---|---|---|---|---|---|---|---|
| 1241 Virginia Ave | 0.69mi | —/— | 2,778 (-11%) | 4mo | $349,900 | $126 | 46 |
Match score weights: distance 35% · size 25% · config 20% · recency 20%. Top-matched comps best support the ARV.
Projected returns pro-forma
-3.0% appreciation · 3.0% rent growth · sell at horizon
- IRR
- 13.8%
- Equity multiple
- 1.55×
- Total profit
- $33,294
- Equity at exit
- $32,057
- IRR
- 22.6%
- Equity multiple
- 2.94×
- Total profit
- $116,660
- Equity at exit
- $18,589
Cash invested: $60,200 (down + closing). Projections, not guarantees.
Landlord ↔ Tenant lean methodology
- Overall (STATE)
- 87 Strongly Landlord-Friendly
- State Tennessee
- 87 Strongly Landlord-Friendly · R+13
- County
- — inherits STATE
- City
- — inherits STATE
ZIP-level market 37620
- Active inventory
- 253
- Price-to-rent
- 9.3×
Monthly cashflow live
- Estimated rent
- $3,092 high interval (Pro) →
- Mortgage (P&I)
- −$1,127
- Tax from tax record
- −$156 /mo · $1,866/yr
- Insurance
- −$90
- HOA
- −$0
- Vacancy / Maint / Mgmt
- −$649
- Net cashflow
- $1,070
Break-even live
2-unit breakdown (identical units grouped — click to expand)
| Units | Beds | Baths | Est. rent |
|---|---|---|---|
| 1× unit | 3 | 2 | $1,919 |
| 1× unit | 0 | 0 | $1,173 |
| Total (2 units) | $3,092 | ||
UW: 25.0% down · 7.5% · 30yr · 1.5% tax · 5.0% vac · 8.0% maint · 8.0% mgmt
Financing live
Cash to close
- Down payment
- $53,750
- Closing costs
- $6,450
- Reserves months
- —
- Total cash needed
- —
Loan-product check · same deal, 3 products live
Conventional
25% down · 7.5% · 30yr
- Down + closing
- —
- Monthly P&I
- —
- Monthly cashflow
- —
- DSCR
- —
- Eligible?
- —
Personal DTI + credit; lowest rate.
DSCR
20% down · 8.5% · 30yr
- Down + closing
- —
- Monthly P&I
- —
- Monthly cashflow
- —
- DSCR
- —
- Eligible?
- —
No personal income docs; deal must DSCR.
Hard money
10% down · 12.0% · 12mo
- Down + closing
- —
- Monthly P&I
- —
- Monthly cashflow
- —
- DSCR
- —
- Eligible?
- —
Short-term bridge; refi at stabilization.
Rent comps 1 comps
| Address | Beds | Baths | Sqft | Rent | $/sqft | DOM | Units | Dist |
|---|---|---|---|---|---|---|---|---|
| 712 Haynes St Bristol, TN | 3.0 | 2.0 | 2228 | $2,100 | $0.94 | 13d | 1 | 0.81mi |
Listing history 21 events
-
2026-06-19days on market $215,000 Active 22 DOM
-
2026-06-18days on market $215,000 Active 21 DOM
-
2026-06-17days on market $215,000 Active 20 DOM
-
2026-06-17price $215,000 Active 19 DOM
-
2026-06-16days on market $225,000 Active 19 DOM
-
2026-06-15days on market $225,000 Active 18 DOM
-
2026-06-14days on market $225,000 Active 16 DOM
-
2026-06-13days on market $225,000 Active 15 DOM
-
2026-06-10days on market $225,000 Active 13 DOM
-
2026-06-09days on market $225,000 Active 12 DOM
-
2026-06-08days on market $225,000 Active 11 DOM
-
2026-06-07days on market $225,000 Active 10 DOM
-
2026-06-03days on market $225,000 Active 6 DOM
-
2026-06-02days on market $225,000 Active 5 DOM
-
2026-06-01days on market $225,000 Active 4 DOM
-
2026-05-31days on market $225,000 Active 3 DOM
-
2026-05-30days on market $225,000 Active 2 DOM
-
2026-05-28$225,000 Active
-
2023-05-31soldstatus $187,000
-
1995-10-12soldstatus $27,600
-
1993-11-01soldstatus $39,000
ⓘ Source: listings_history table (triggers on properties + properties_extension) + one-shot
backfill from property_details.listing_events for pre-trigger history.
Tax reassessment forecast TN · Resets to sale price
- Current annual tax
- $1,866 · $156/mo
- Projected year-2 tax
- $1,866 · $156/mo
- Expected delta
- $0/yr ($0/mo · 0.0%)
ⓘ Screening estimate from a state-policy table — verify with the county assessor before closing.
Climate risk First Street
- Flood 1/10 Low FEMA zone X (unshaded) · 0% chance over 30 yrs
- Wildfire 4/10 Moderate
- Heat 4/10 Moderate 7 d/yr ≥98°F today · 21 d/yr by 30 yrs out
- Wind 2/10 Low
- Air quality 2/10 Low 1 unhealthy d/yr today · 2 by 30 yrs out
Nearby sold comps map
Loading sold comps map…
Walkable amenities ~0.75 mi
Loading nearby amenities…
Taxation est. · year 1
- Rental income
- $37,104
- − Mortgage interest
- −$12,043
- − Property taxes
- −$1,866
- − Insurance
- −$1,075
- − Repairs & maintenance
- −$2,968
- − Management
- −$2,968
- − Depreciation
- −$6,255
- Taxable income
- $9,928
- Est. tax owed @ 24.0%
- −$2,383
- After-tax cash flow
- $10,459/yr
For passive investors: Depreciation is non-cash, so a rental often shows a tax loss while cash-flowing — sheltering income. Rental losses are passive: they offset passive income freely, and up to $25,000/yr can offset ordinary (W-2) income if you actively participate and your MAGI is under $100k (phasing out to $0 by $150k); unused losses carry forward. On sale, claimed depreciation is recaptured at up to 25%, and gains may owe capital-gains tax (a 1031 exchange can defer both). Figures are a year-1 estimate at your 24.0% rate — not tax advice; consult a CPA.
Schools (NCES district)
- District
- Bristol
- NCES district ID
- 4700360
- Math proficiency
- 37% ▼ -7.00%
- Reading proficiency
- 35% ▼ -8.00%
- Median HH income
- $37,018
- Composite
- 29.95/100
- National rank
- #6376
- State rank
- #29 of 139 in TN
Livability — Bristol
- Score
- 73/100
- State rank
- #24
- US rank
- #5413
Category grades
Schools grade is shown separately in the Schools card above.
Census & demographics
- Census place
- Bristol, TN
- County
- Sullivan County · 121,987 people
- City population
- 38,494
- Metro
- Kingsport-Bristol, TN-VA
- Population (ZIP)
- 38,494
- Household income
- $56,128
- Rent vs Own
- Severe rent burden
- 724.0
Population outlook (Sullivan County) Hauer SSP2
- Today (2025)
- 157,030 people
- By 2030
- 156,415 · -0.4%
- By 2040
- 153,778 · -2.1%
- By 2050
- 149,018 · -5.1%
- By 2075
- 138,068 · -12.1%
- By 2100
- 119,927 · -23.6%
Race, ethnicity, and origin ACS 2023
- Neighborhood character
- Predominantly White (91%)
- Race & ethnicity
- White 91% Two or more races 5% Hispanic / Latino 3% Black 2%
- Common ancestry
- Serbian 3% Slovak 3% Italian 1%
- Foreign-born
- 2% · Canada
- Languages at home
- 97% English-only · Spanish 2%
Political lean MEDSL · Sullivan
- 2024 margin
- Solid R (+55.0) · D 22.0% · R 77.0% · Other 1.0%
- 2008→2024 swing
- -13.6pp toward R · 2008: -41.3pp · 2024: -55.0pp
- All cycles
- 2024: R+55.0 2020: R+51.9 2016: R+56.2 2012: R+47.2 2008: R+41.3
Not yet ingested
- Civics
- —
Market trends
- HPI YoY
- ▼ -294.12%
- Current HPI
- 263.38
- Rent YoY
- —
- Metro
- Kingsport-Bristol, TN-VA
- State GDP YoY
- ▲ 2.78%
- F500 in state
- 22
Industry mix (Fortune 500 HQ in TN)
| Industry | F500 HQs | Revenue |
|---|---|---|
| Healthcare | 3 | $91B |
|
||
| Retail | 3 | $72B |
|
||
| Transportation / Logistics | 1 | $88B |
|
||
| Paper / Packaging | 1 | $19B |
|
||
| Insurance | 1 | $13B |
|
||
| Energy | 1 | $12B |
|
||
Price history
+476.9% since first listed4 events — show timeline
- 2026-05-28 Listed $225,000 TVRMLS
- 2023-05-31 Sold (Public Records) $187,000 Public Records
- 1995-10-12 Sold (Public Records) $27,600 Public Records
- 1993-11-01 Sold (Public Records) $39,000 Public Records
Property tax history
+4.8%/yrLatest (2025): $1,866 · +22.8% YoY. Source: county tax records.
Cash-flow waterfall
monthlySold comps — $/sqft
last 12 mo · ≤1 miLoading sold comps…