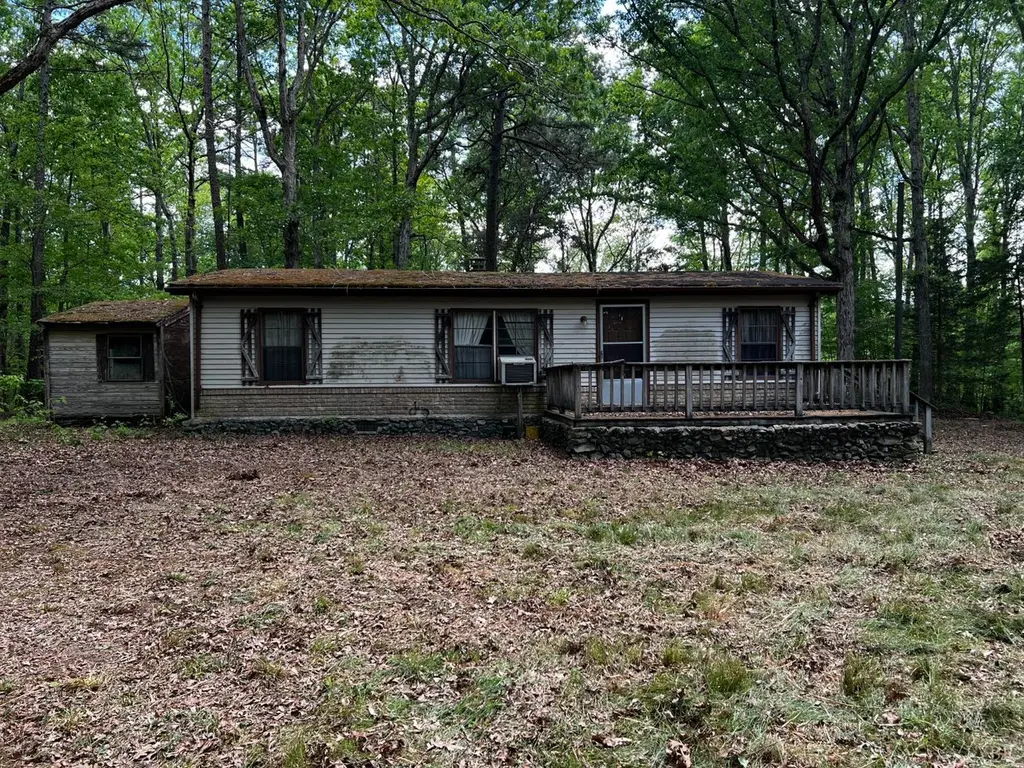
1162 Macdonald Rd · Scottsburg, VA
Flood risk 1/10 · Minimal
- FEMA flood zone
- X (unshaded)
- Chance of flooding over 30 yrs
- 0.0%
- Est. flood insurance / yr
- $507 – $1,088
Fire risk 4/10 · Minor
- Est. fire insurance / yr
- $666 – $1,236
Heat risk 6/10 · Moderate
- Hot days now (above 104°F)
- 7 days/yr
- Hot days in 30 yrs
- 17 days/yr
Wind risk 4/10 · Minor
- Chance of severe wind over 30 yrs
- 11.0%
Air-quality risk 2/10 · Minimal
- Unhealthy air days now
- 0 days/yr
- Unhealthy air days in 30 yrs
- 1 days/yr
Risk factors via First Street. Map © Google.
Why this score? — see what drove the B+ grade
The composite is a weighted blend of 9 inputs, each scored 0–100. Each bar is that input's sub-score; the figure is the points it added to the 100-point composite (weight × sub-score).
- Cash flow +30.0/30.0
- 1% rule +10.0/10.0
- DSCR +10.0/10.0
- Appreciation +8.0/10.0
- ARV discount +7.5/15.0
- Schools +3.6/10.0
- Livability +3.3/5.0
- Rent growth +2.5/5.0
- Condition / age +2.5/5.0
$47,238
🖨 Deal sheet (PDF) 📄 Offer letter ✓ Due diligence
Listing remarks
Investor opportunity. Property requires significant renovation and is being sold strictly as-is. Seller will make no repairs or remove any contents. Due to condition, property will not qualify for government financing and is best suited for cash purchasers.
Key facts
- 7,405 sq ft lot
- Built 1980
Neighborhood map
What this means for you Summary
Snapshot
- This is a 3-bed/1.5-bath single-family listed at $47k.
Deal economics
- At list price, monthly cash flow is $508 ($6k/yr) — positive.
- The deal already cash-flows at list — no discount required.
- Meets the 1% rule at list price ($1k rent vs $47k).
Location & tenants
- Location reads 66/100 on livability (#323 in VA) — a middle-class / working-renter tenant base. Strengths: cost of living A+, housing A-; Watch: health & safety C-, crime D+, amenities F.
- Halifax County Public School District (town): math 29% / reading 59% proficiency, ranked #116 of 131 in VA (top 88%) — families likely to look elsewhere, expect single-tenant / working-renter base with shorter leases.
- Zoned schools: Scottsburg Elementary (math 37% / reading 62%, grade D, #742 of 1,108 statewide, top 70%, 188 students, 94% FRL); Halifax County Middle (math 27% / reading 60%, grade D, #285 of 342 statewide, top 84%, 925 students, 92% FRL); Halifax County High (math 40% / reading 69%, grade C-, #281 of 319 statewide, top 90%, 1,397 students, 90% FRL) — zoned schools average 92% FRL vs 58% district-wide (34 pts higher); higher-poverty schools than district average — tighter screening recommended.
- Market conditions: 17 active listings in the ZIP; 97 units permitted in Halifax County in 2024 (0 in 5+ unit buildings).
Forward outlook
- In year one you build about $3k of equity ($326 loan paydown + $3k appreciation (6.1% local appreciation)).
- Halifax County population projected at -22% by 2050 — secular population decline; favor cash flow + early exit over multi-decade hold.
- At projected returns (6.1% appreciation + 3.0% rent growth), your $13k cash investment doubles in ~2 years — after that, you're playing with house money.
- By year 10, paydown + projected appreciation supports a ~$33k cash-out refi (75% LTV) — recoverable capital for the next deal without selling this one.
Negotiation context
- Only 1 days on market — expect competitive offers; lowballing is unlikely to land.
Risks & watch-outs
- Climate carrying-cost: extreme-heat days projected 7→17/yr by 2055 (HVAC capex compounding) — expect insurance premiums to compound above CPI over the hold.
Questions for the listing agent
- Is there a deadline driving the sale (1031 exchange, divorce, estate, relocation)? That informs how much negotiation room exists.
- Schools are B-rated — typically a magnet for longer-tenancy family renters. What's the average tenant stay here, and is there a school-zone premium baked into asking?
- Crime grade is D in this area — have there been break-ins, vandalism, or insurance claims at this property in the last 3 years? What carrier currently insures it and at what premium?
- What's the average days-on-market for RENTAL listings here right now (not sales)? A rising rental-DOM trend means longer vacancies and softer asking-rent achievability than the comps imply.
- What's the recent tenant-quality profile in this submarket — average credit score on applications, eviction rate, late-payment / NSF rate, and stable-employment percentage? A property-management company in the area should have these aggregated.
- How much new for-sale + rental construction is in the pipeline within 1–3 miles? Heavy new supply typically softens prices + rents 12–24 months out; constrained supply supports both.
Investment metrics
- 1% rule
- 2.13% ✓
- Cap rate
- 19.19%
- Cash-on-cash
- 46.06%
- DSCR
- 3.05
- GRM
- 3.9
CMA / ARV
No comps found within radius.
Projected returns pro-forma
6.07% appreciation · 3.0% rent growth · sell at horizon
- IRR
- 55.3%
- Equity multiple
- 4.49×
- Total profit
- $46,147
- Equity at exit
- $29,891
- IRR
- 52.1%
- Equity multiple
- 9.34×
- Total profit
- $110,354
- Equity at exit
- $54,374
Cash invested: $13,227 (down + closing). Projections, not guarantees.
Landlord ↔ Tenant lean methodology
- Overall (STATE)
- 55 Moderately Landlord-Leaning
- State Virginia
- 55 Moderately Landlord-Leaning · D+2
- County
- — inherits STATE
- City
- — inherits STATE
ZIP-level market 24589
- Home prices YoY
- 3.9%
- Active inventory
- 17
- Price-to-rent
- 3.9×
Monthly cashflow live
- Estimated rent
- $1,006 medium interval (Pro) →
- Mortgage (P&I)
- −$248
- Tax from tax record
- −$20 /mo · $236/yr
- Insurance
- −$20
- HOA
- −$0
- Vacancy / Maint / Mgmt
- −$211
- Net cashflow
- $508
Break-even live
Sensitivity live
| Price | -10% $534 | -5% $521 | +0% $508 | +5% $494 | +10% $481 |
|---|---|---|---|---|---|
| Rent | -10% $428 | -5% $468 | +0% $508 | +5% $547 | +10% $587 |
| Rate | -1.0pp $531 | -0.5pp $520 | base $508 | +0.5pp $495 | +1.0pp $483 |
UW: 25.0% down · 7.5% · 30yr · 1.5% tax · 5.0% vac · 8.0% maint · 8.0% mgmt
Financing live
Cash to close
- Down payment
- $11,810
- Closing costs
- $1,417
- Reserves months
- —
- Total cash needed
- —
Loan-product check · same deal, 3 products live
Conventional
25% down · 7.5% · 30yr
- Down + closing
- —
- Monthly P&I
- —
- Monthly cashflow
- —
- DSCR
- —
- Eligible?
- —
Personal DTI + credit; lowest rate.
DSCR
20% down · 8.5% · 30yr
- Down + closing
- —
- Monthly P&I
- —
- Monthly cashflow
- —
- DSCR
- —
- Eligible?
- —
No personal income docs; deal must DSCR.
Hard money
10% down · 12.0% · 12mo
- Down + closing
- —
- Monthly P&I
- —
- Monthly cashflow
- —
- DSCR
- —
- Eligible?
- —
Short-term bridge; refi at stabilization.
Listing history 2 events
-
2026-04-24status Pending
-
2026-04-23$47,238 Active
ⓘ Source: listings_history table (triggers on properties + properties_extension) + one-shot
backfill from property_details.listing_events for pre-trigger history.
Tax reassessment forecast VA · Resets to sale price
- Current annual tax
- $236 · $20/mo
- Projected year-2 tax
- $387 · $32/mo
- Expected delta
- +$151/yr (+$13/mo · 64.0%)
ⓘ Screening estimate from a state-policy table — verify with the county assessor before closing.
Climate risk First Street
- Flood 1/10 Low FEMA zone X (unshaded) · 0% chance over 30 yrs
- Wildfire 4/10 Moderate
- Heat 6/10 Major 7 d/yr ≥104°F today · 17 d/yr by 30 yrs out
- Wind 4/10 Moderate 11% chance of damaging wind over 30 yrs
- Air quality 2/10 Low 0 unhealthy d/yr today · 1 by 30 yrs out
Nearby sold comps map
Loading sold comps map…
Walkable amenities ~0.75 mi
Loading nearby amenities…
Taxation est. · year 1
- Rental income
- $12,072
- − Mortgage interest
- −$2,646
- − Property taxes
- −$236
- − Insurance
- −$236
- − Repairs & maintenance
- −$966
- − Management
- −$966
- − Depreciation
- −$1,374
- Taxable income
- $5,648
- Est. tax owed @ 24.0%
- −$1,356
- After-tax cash flow
- $4,737/yr
For passive investors: Depreciation is non-cash, so a rental often shows a tax loss while cash-flowing — sheltering income. Rental losses are passive: they offset passive income freely, and up to $25,000/yr can offset ordinary (W-2) income if you actively participate and your MAGI is under $100k (phasing out to $0 by $150k); unused losses carry forward. On sale, claimed depreciation is recaptured at up to 25%, and gains may owe capital-gains tax (a 1031 exchange can defer both). Figures are a year-1 estimate at your 24.0% rate — not tax advice; consult a CPA.
Schools (NCES district)
- District
- Halifax County Public School District
- NCES district ID
- 5101770
- Math proficiency
- 29% ▼ -51.00%
- Reading proficiency
- 59% ▼ -15.00%
- Median HH income
- $36,137
- Composite
- 36.36/100
- National rank
- #4687
- State rank
- #116 of 131 in VA
Livability — Scottsburg
- Score
- 66/100
- State rank
- #323
- US rank
- #11757
Category grades
Schools grade is shown separately in the Schools card above.
Census & demographics
- Population (ZIP)
- 1,859
Population outlook (Halifax County) Hauer SSP2
- Today (2025)
- 32,892 people
- By 2030
- 31,438 · -4.4%
- By 2040
- 28,350 · -13.8%
- By 2050
- 25,553 · -22.3%
- By 2075
- 20,217 · -38.5%
- By 2100
- 14,645 · -55.5%
Race, ethnicity, and origin ACS 2023
- Neighborhood character
- Predominantly White (67%)
- Race & ethnicity
- White 67% Black 29% Two or more races 3%
- Common ancestry
- Polish 2% Serbian 1%
- Foreign-born
- 1% · Canada
- Languages at home
- 99% English-only · Spanish 1%
Political lean MEDSL · Halifax
- 2024 margin
- Strong R (+21.1) · D 39.1% · R 60.2%
- 2008→2024 swing
- -18.2pp toward R · 2008: -2.8pp · 2024: -21.1pp
- All cycles
- 2024: R+21.1 2020: R+15.1 2016: R+16.6 2012: R+5.6 2008: R+2.8
Not yet ingested
- Civics
- —
Market trends
- HPI YoY
- ▲ 6.07%
- Current HPI
- 160.1469
- Rent YoY
- —
- Metro
- —
- State GDP YoY
- ▲ 2.40%
- F500 in state
- 50
Industry mix (Fortune 500 HQ in VA)
| Industry | F500 HQs | Revenue |
|---|---|---|
| Aerospace / Defense | 4 | $236B |
|
||
| Technology / Defense | 3 | $32B |
|
||
| Financial Services | 2 | $176B |
|
||
| Utilities | 2 | $27B |
|
||
| Insurance | 2 | $25B |
|
||
| Technology | 2 | $15B |
|
||
Price history
2 events — show timeline
- 2026-04-24 Pending — LMLS
- 2026-04-23 Listed $47,238 LMLS
Property tax history
+7.3%/yrLatest (2025): $236 · +0.0% YoY. Source: county tax records.
Cash-flow waterfall
monthlySold comps — $/sqft
last 12 mo · ≤1 miLoading sold comps…