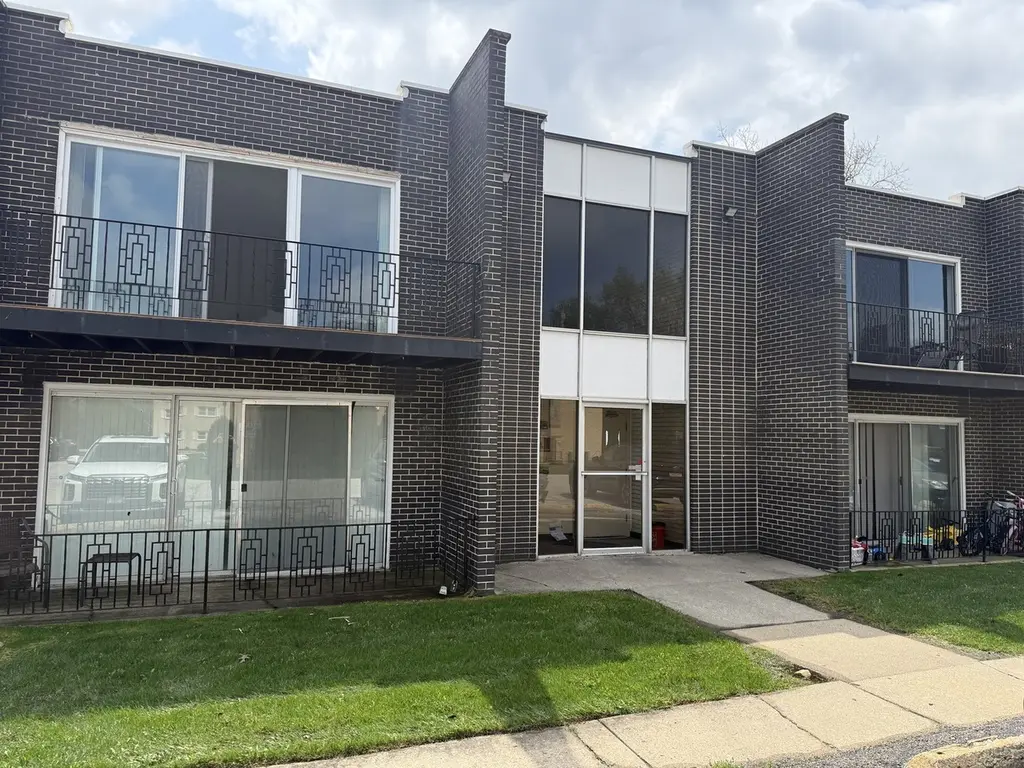
18330 Cherry Creek Dr #5 · Homewood, IL
Flood risk 1/10 · Minimal
- FEMA flood zone
- X (unshaded)
- Chance of flooding over 30 yrs
- 0.0%
- Est. flood insurance / yr
- $507 – $1,088
Fire risk 1/10 · Minimal
- Est. fire insurance / yr
- $804 – $1,492
Heat risk 3/10 · Minor
- Hot days now (above 101°F)
- 7 days/yr
- Hot days in 30 yrs
- 15 days/yr
Wind risk 2/10 · Minimal
- Chance of severe wind over 30 yrs
- —
Air-quality risk 3/10 · Minor
- Unhealthy air days now
- 4 days/yr
- Unhealthy air days in 30 yrs
- 4 days/yr
Risk factors via First Street. Map © Google.
Why this score? — see what drove the C grade
The composite is a weighted blend of 9 inputs, each scored 0–100. Each bar is that input's sub-score; the figure is the points it added to the 100-point composite (weight × sub-score).
- Cash flow +20.0/30.0
- 1% rule +10.0/10.0
- ARV discount +7.5/15.0
- DSCR +6.4/10.0
- Livability +4.0/5.0
- Rent growth +2.5/5.0
- Condition / age +2.5/5.0
- Schools +2.4/10.0
- Appreciation +0.0/10.0
$115,000
🖨 Deal sheet (PDF) 📄 Offer letter ✓ Due diligence
Listing remarks MLS
Beautiful updated unit. Everything is new or like new. Unit has new windows, carpet, kitchen, appliances, you name it it is gorgeous. Double size storage unit. A must see. This second floor unit is such a good buy.
Key facts
- New floors
- Close to metra line
- 2nd floor unit
Tags
Property features AI
Finance
- Other: Commuter-friendly location with school bus service, commuter bus and train access, and interstate access; Parcel number on file
- Financial info: Special service area: No
- HOA & community: Monthly association fee of $591; Association covers heat, water, gas, parking, insurance, and exterior maintenance; On-site amenities include coin laundry and storage; Manager off-site; Pets allowed (cats and dogs allowed; large max pet weight listed)
Exterior
- Parking: One parking space (total)
- Utilities: Water source: Lake Michigan; Public sewer
- Home design: Attached single, condominium; Entry level is second floor; Condo ownership; Rehab planned for 2025
- Construction: Brick construction; Building age approximately 31–40 years; Part of an 8-unit building
- Exterior features: Balcony; Common lot
Interior
- Kitchen: Second-level kitchen with eating area/table space (18 x 9)
- Bedrooms: Master bedroom on second level (16 x 14) with window treatments; Second bedroom on second level (13 x 12) with window treatments; Additional bedrooms listed (two other bedroom entries)
- Flooring: Wood laminate flooring throughout main living areas and bedrooms
- Bathrooms: One full bathroom
- Heating & cooling: Natural gas heating; Central air conditioning
- Interior features: Four total rooms; Unfinished full basement
- Laundry & utility: Laundry room
Neighborhood map
What this means for you Summary
Snapshot
- This is a 2-bed/1.0-bath condo listed at $115k.
Deal economics
- At list price, monthly cash flow is $142 ($2k/yr) — positive.
- The deal already cash-flows at list — no discount required.
- Meets the 1% rule at list price ($2k rent vs $115k).
- Recommended offer: $108k (6.0% below list) — sets the bar for market timing.
- Cap rate 7.8% vs local median 6.1% in Homewood — meaningfully above typical; check what's discounted (condition, days-on-market, listing class) to confirm the premium yield is real.
Location & tenants
- Location reads 81/100 on livability (#81 in IL, #1,314 nationally) — a professional / high-income tenant draw. Strengths: commute A+, employment A+, cost of living A+; Watch: amenities F.
- Homewood Flossmoor Chsd 233 (suburban): math 21% / reading 27% proficiency, ranked #272 of 620 in IL (top 44%) — low school quality limits family demand, transient renter base, plan for 1-2y turnover.
- Zoned schools: Western Avenue Elem School (math 32% / reading 37%, grade F, #517 of 2,056 statewide, top 28%, 491 students, 0% FRL); Parker Junior High School (math 16% / reading 21%, grade F, #438 of 665 statewide, top 67%, 858 students, 0% FRL); Homewood-Flossmoor High School (math 21% / reading 27%, grade F, #304 of 693 statewide, top 44%, 2,798 students, 0% FRL).
- Market conditions: 102 active listings in the ZIP; 9 comparable units currently listed for rent nearby; rentals at typical pace (median 15d on market — plan ~3-4 weeks tenant-placement turnaround); 6,272 units permitted in Cook County in 2024 (4,658 in 5+ unit buildings).
Forward outlook
- Local home prices are declining (-3.0%/yr); year-one equity from $795 of loan paydown is wiped out by about $3k of value loss. Plan a longer hold.
Negotiation context
- It's been on market 73 days — a 6% lower offer ($108k) is reasonable based on typical stale-listing flexibility.
- 3 sale attempts since 12y ago; this cycle's ask has dropped $10k (8%) from the opening price — seller is motivated, your offer sets the floor, not the list.
- Current owner paid $45k; list at $115k implies a 156% gain — meaningful room to come down on a strong offer.
Risks & watch-outs
- Watch-outs: property tax is 2.9% of price; HOA is 28% of rent.
Questions for the listing agent
- It's been on market 73 days. Have you received any prior offers? Is the seller open to a 6% concession, seller financing, or rate buy-down credit?
- Property tax is high relative to price — has the assessment been appealed recently, and will the sale trigger a re-assessment?
- What does the HOA fee cover, when was the last increase, and are there any pending special assessments or reserve-fund shortfalls?
- Any open or pending special assessments — roof, HVAC, plumbing, elevator, façade? What's the per-unit balance and payoff schedule, and is the seller paying it off at close or rolling it to the buyer?
- Why hasn't it sold? Are there any deal-killer items the seller is aware of (foundation, flood, title, zoning, code violations)?
- Is there a deadline driving the sale (1031 exchange, divorce, estate, relocation)? That informs how much negotiation room exists.
- Schools are D-rated, which usually means shorter tenancies and higher turnover. Who's the typical renter profile here, and what's been the actual vacancy rate?
- What's the average days-on-market for RENTAL listings here right now (not sales)? A rising rental-DOM trend means longer vacancies and softer asking-rent achievability than the comps imply.
- What's the recent tenant-quality profile in this submarket — average credit score on applications, eviction rate, late-payment / NSF rate, and stable-employment percentage? A property-management company in the area should have these aggregated.
- How much new apartment / multifamily construction is in the pipeline within 1–3 miles? Heavy new supply (>2% of stock underway) typically softens rents 12–24 months out; light construction supports rent growth.
Investment metrics
- 1% rule
- 1.83% ✓
- Cap rate
- 7.77%
- Cash-on-cash
- 5.29%
- DSCR
- 1.24
- GRM
- 4.6
CMA / ARV
No comps found within radius.
Projected returns pro-forma
-3.0% appreciation · 3.0% rent growth · sell at horizon
- IRR
- -7.6%
- Equity multiple
- 0.72×
- Total profit
- $-9,113
- Equity at exit
- $17,147
- IRR
- 2.4%
- Equity multiple
- 1.18×
- Total profit
- $5,645
- Equity at exit
- $9,943
Cash invested: $32,200 (down + closing). Projections, not guarantees.
Landlord ↔ Tenant lean methodology
- Overall (STATE)
- 43 Moderately Tenant-Leaning
- State Illinois
- 43 Moderately Tenant-Leaning · D+7
- County
- — inherits STATE
- City
- — inherits STATE
ZIP-level market 60430
- Home prices YoY
- -32.1%
- Active inventory
- 102
- Price-to-rent
- 4.6×
Monthly cashflow live
- Estimated rent
- $2,101 high interval (Pro) →
- Mortgage (P&I)
- −$603
- Tax from tax record
- −$275 /mo · $3,306/yr
- Insurance
- −$48
- HOA
- −$591
- Vacancy / Maint / Mgmt
- −$441
- Net cashflow
- $142
Break-even live
Sensitivity live
| Price | -10% $207 | -5% $175 | +0% $142 | +5% $109 | +10% $77 |
|---|---|---|---|---|---|
| Rent | -10% $-24 | -5% $59 | +0% $142 | +5% $225 | +10% $308 |
| Rate | -1.0pp $200 | -0.5pp $171 | base $142 | +0.5pp $112 | +1.0pp $82 |
UW: 25.0% down · 7.5% · 30yr · 1.5% tax · 5.0% vac · 8.0% maint · 8.0% mgmt
Financing live
Cash to close
- Down payment
- $28,750
- Closing costs
- $3,450
- Reserves months
- —
- Total cash needed
- —
Loan-product check · same deal, 3 products live
Conventional
25% down · 7.5% · 30yr
- Down + closing
- —
- Monthly P&I
- —
- Monthly cashflow
- —
- DSCR
- —
- Eligible?
- —
Personal DTI + credit; lowest rate.
DSCR
20% down · 8.5% · 30yr
- Down + closing
- —
- Monthly P&I
- —
- Monthly cashflow
- —
- DSCR
- —
- Eligible?
- —
No personal income docs; deal must DSCR.
Hard money
10% down · 12.0% · 12mo
- Down + closing
- —
- Monthly P&I
- —
- Monthly cashflow
- —
- DSCR
- —
- Eligible?
- —
Short-term bridge; refi at stabilization.
Rent comps 9 comps
| Address | Beds | Baths | Sqft | Rent | $/sqft | DOM | Units | Dist |
|---|---|---|---|---|---|---|---|---|
| 2420 183rd St Homewood, IL | 2.0 | 1.0 | 1100 | $1,750 | $1.59 | 13d | 1 | 0.46mi |
| 3212 Charlemagne Ave Hazel Crest, IL | 3.0 | 2.5 | 1412 | $2,650 | $1.88 | 1d | 1 | 0.78mi |
| 2640 Flossmoor Rd Unit 2S Flossmoor, IL | 2.0 | 1.5 | 800 | $1,800 | $2.25 | 17d | 1 | 0.95mi |
| 2722 Larkspur Ln Hazel Crest, IL | 3.0 | 1.5 | 1441 | $2,650 | $1.84 | 14d | 1 | 0.98mi |
| 1933 Hickory Rd Homewood, IL | 1.0 | 1.0 | 850 | $1,550 | $1.82 | 23d | 1 | 1.05mi |
| 1933 Hickory Rd Unit 1937-C Homewood, IL | 1.0 | 1.0 | 850 | $1,550 | $1.82 | 21d | 1 | 1.06mi |
| 17561 Hillside Ave Homewood, IL | 3.0 | 1.0 | 1174 | $2,500 | $2.13 | 19d | 1 | 1.17mi |
| 17561 Hillside Ave Homewood, IL | 3.0 | 1.0 | 1174 | $2,300 | $1.96 | 0d | 1 | 1.17mi |
| 3501 177th St Country Club Hills, IL | 2.0 | 2.0 | 839 | $2,850 | $3.40 | 0d | 1 | 1.24mi |
HOA detail condo
- Monthly dues
- $591 · $7,092/yr
- Assessments
- None detected in remarks — confirm with the listing agent.
Listing history 23 events
-
2026-06-21days on market $115,000 Active 73 DOM
-
2026-06-18days on market $115,000 Active 70 DOM
-
2026-06-17days on market $115,000 Active 69 DOM
-
2026-06-16days on market $115,000 Active 68 DOM
-
2026-06-15days on market $115,000 Active 67 DOM
-
2026-06-13days on market $115,000 Active 65 DOM
-
2026-06-09days on market $115,000 Active 61 DOM
-
2026-06-08days on market $115,000 Active 60 DOM
-
2026-06-07days on market $115,000 Active 59 DOM
-
2026-06-04days on market $115,000 Active 56 DOM
-
2026-06-03days on market $115,000 Active 55 DOM
-
2026-06-02days on market $115,000 Active 54 DOM
-
2026-06-01days on market $115,000 Active 53 DOM
-
2026-05-31days on market $115,000 Active 52 DOM
-
2026-04-30price $115,000
-
2026-04-09$125,000 Active
-
2025-07-10historical
-
2025-06-19Active
-
2015-02-26soldstatus $45,000
-
2015-02-23soldstatus $45,000 Closed Sale 217-char remark
Show marketing remark (217 chars)
Beautiful updated unit. Everything is new or like new. Unit has new windows, carpet, kitchen, appliances, you name it it is gorgeous. Double size storage unit. A must see. This second floor unit is such a good buy.
-
2014-11-08historical Contingent 217-char remark
Show marketing remark (217 chars)
Beautiful updated unit. Everything is new or like new. Unit has new windows, carpet, kitchen, appliances, you name it it is gorgeous. Double size storage unit. A must see. This second floor unit is such a good buy.
-
2014-08-12$49,900 New 217-char remark
Show marketing remark (217 chars)
Beautiful updated unit. Everything is new or like new. Unit has new windows, carpet, kitchen, appliances, you name it it is gorgeous. Double size storage unit. A must see. This second floor unit is such a good buy.
-
2003-12-31soldstatus $60,000
ⓘ Source: listings_history table (triggers on properties + properties_extension) + one-shot
backfill from property_details.listing_events for pre-trigger history.
Tax reassessment forecast IL · Partial reset (capped growth)
- Current annual tax
- $3,306 · $275/mo
- Projected year-2 tax
- $3,306 · $275/mo
- Expected delta
- $0/yr ($0/mo · 0.0%)
ⓘ Screening estimate from a state-policy table — verify with the county assessor before closing.
Climate risk First Street
- Flood 1/10 Low FEMA zone X (unshaded) · 0% chance over 30 yrs
- Wildfire 1/10 Low
- Heat 3/10 Moderate 7 d/yr ≥101°F today · 15 d/yr by 30 yrs out
- Wind 2/10 Low
- Air quality 3/10 Moderate 4 unhealthy d/yr today · 4 by 30 yrs out
Nearby sold comps map
Loading sold comps map…
Walkable amenities ~0.75 mi
Loading nearby amenities…
Taxation est. · year 1
- Rental income
- $25,207
- − Mortgage interest
- −$6,442
- − Property taxes
- −$3,306
- − Insurance
- −$575
- − Repairs & maintenance
- −$2,017
- − Management
- −$2,017
- − HOA
- −$7,092
- − Depreciation
- −$3,345
- Taxable income
- $414
- Est. tax owed @ 24.0%
- −$99
- After-tax cash flow
- $1,605/yr
For passive investors: Depreciation is non-cash, so a rental often shows a tax loss while cash-flowing — sheltering income. Rental losses are passive: they offset passive income freely, and up to $25,000/yr can offset ordinary (W-2) income if you actively participate and your MAGI is under $100k (phasing out to $0 by $150k); unused losses carry forward. On sale, claimed depreciation is recaptured at up to 25%, and gains may owe capital-gains tax (a 1031 exchange can defer both). Figures are a year-1 estimate at your 24.0% rate — not tax advice; consult a CPA.
Schools (NCES district)
- District
- Homewood Flossmoor Chsd 233
- NCES district ID
- 1719560
- Math proficiency
- 21% ▼ -15.00%
- Reading proficiency
- 27% ▼ -13.00%
- Median HH income
- $83,564
- Composite
- 24.42/100
- National rank
- #7681
- State rank
- #272 of 620 in IL
Livability — Homewood
- Score
- 81/100
- State rank
- #81
- US rank
- #1314
Category grades
Schools grade is shown separately in the Schools card above.
Census & demographics
- Census place
- Homewood, IL
- City population
- 19,993
- Population (ZIP)
- 19,993
Population outlook (Cook County) Hauer SSP2
- Today (2025)
- 5,347,519 people
- By 2030
- 5,357,703 · +0.2%
- By 2040
- 5,324,924 · -0.4%
- By 2050
- 5,230,762 · -2.2%
- By 2075
- 4,785,735 · -10.5%
- By 2100
- 4,188,836 · -21.7%
Race, ethnicity, and origin ACS 2023
- Neighborhood character
- Diverse neighborhood (Simpson 0.62)
- Race & ethnicity
- Black 44% White 42% Hispanic / Latino 9% Two or more races 6% Asian 1%
- Hispanic origin (detail)
- Mexican 7%
- Common ancestry
- Romanian 5% Iranian 2% Italian 2%
- Foreign-born
- 6% · Canada, Dominican Republic
- Languages at home
- 91% English-only · Spanish 5% Russian/Polish/Slavic 1% German/W. Germanic 1%
Political lean MEDSL · Cook
- 2024 margin
- Solid D (+42.0) · D 70.4% · R 28.4% · Other 1.2%
- 2008→2024 swing
- -11.4pp toward R · 2008: 53.4pp · 2024: 42.0pp
- All cycles
- 2024: D+42.0 2020: D+50.3 2016: D+53.0 2012: D+49.4 2008: D+53.4
Not yet ingested
- Civics
- —
Market trends
- HPI YoY
- ▼ -105.00%
- Current HPI
- 222.2923
- Rent YoY
- —
- Metro
- —
- State GDP YoY
- ▲ 1.59%
- F500 in state
- 60
Industry mix (Fortune 500 HQ in IL)
| Industry | F500 HQs | Revenue |
|---|---|---|
| Insurance | 4 | $201B |
|
||
| Consumer Goods | 4 | $87B |
|
||
| Industrial Machinery | 3 | $64B |
|
||
| Healthcare | 2 | $55B |
|
||
| Retail / Pharmacy | 1 | $148B |
|
||
| Agriculture / Food | 1 | $86B |
|
||
Price history
+91.7% since first listed9 events — show timeline
- 2026-04-30 Price Changed $115,000 MRED as Distributed by MLS Grid
- 2026-04-09 Listed $125,000 MRED as Distributed by MLS Grid
- 2025-07-10 Listing Removed — MRED as Distributed by MLS Grid
- 2025-06-19 Listed — MRED as Distributed by MLS Grid
- 2015-02-26 Sold (Public Records) $45,000 Public Records
- 2015-02-23 Sold (MLS) $45,000 MRED as Distributed by MLS Grid
- 2014-11-08 Contingent — MRED as Distributed by MLS Grid
- 2014-08-12 Listed $49,900 MRED as Distributed by MLS Grid
- 2003-12-31 Sold (Public Records) $60,000 Public Records
Property tax history
+3.4%/yrLatest (2023): $3,306 · +85.8% YoY. Source: county tax records.
Cash-flow waterfall
monthlySold comps — $/sqft
last 12 mo · ≤1 miLoading sold comps…