220 W 111th St Unit 2B · New York, NY
Flood risk 1/10 · Minimal
- FEMA flood zone
- X (unshaded)
- Chance of flooding over 30 yrs
- 0.0%
- Est. flood insurance / yr
- $507 – $1,088
Fire risk 1/10 · Minimal
- Est. fire insurance / yr
- $691 – $1,283
Heat risk 6/10 · Moderate
- Hot days now (above 99°F)
- 7 days/yr
- Hot days in 30 yrs
- 15 days/yr
Wind risk 6/10 · Moderate
- Chance of severe wind over 30 yrs
- 27.0%
Air-quality risk 4/10 · Minor
- Unhealthy air days now
- 5 days/yr
- Unhealthy air days in 30 yrs
- 6 days/yr
Risk factors via First Street. Map © Google.
Why this score? — see what drove the C- grade
The composite is a weighted blend of 9 inputs, each scored 0–100. Each bar is that input's sub-score; the figure is the points it added to the 100-point composite (weight × sub-score).
- Cash flow +12.7/30.0
- Appreciation +7.6/10.0
- ARV discount +7.5/15.0
- Schools +5.0/10.0
- 1% rule +4.5/10.0
- DSCR +3.8/10.0
- Livability +3.8/5.0
- Rent growth +3.1/5.0
- Condition / age +2.5/5.0
$699,000
🖨 Deal sheet (PDF) 📄 Offer letter ✓ Due diligence
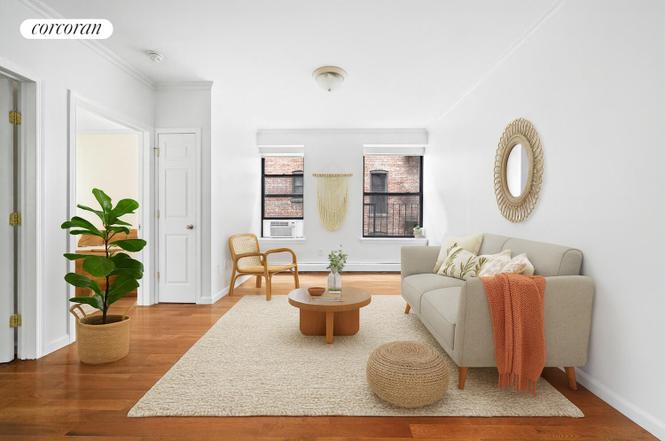
Listing remarks
Live or invest just one block from Central Park! This stylish, mint-condition 2BR/1BA pre-war condo checks all the boxes-bright, quiet, and full of charm. Enjoy a spacious living room, compact chef's kitchen with stainless steel appliances, a windowed bath, 9-ft ceilings, crown molding, and new hardwood floors throughout. A perfect blend of classic character and modern comfort. Located on a peaceful, tree-lined block in South Harlem's coveted Gold Coast, The Park Central is a beautifully restored 24-unit gem featuring a marble-and-mosaic lobby with tin ceilings, a Common roof deck, and laundry. Minutes from Central Park, Morningside Park, the 2/3/B/C trains, Columbia University, and the
Key facts
- 9-ft ceilings
- Crown molding
- Spacious living room
Tags
Property features AI
Finance
- Other: Building has elevator(s); Multi-unit building with 25 total units
- HOA & community: Monthly association fee of $856; Pets allowed (dogs permitted)
Exterior
- Home design: Located on entry level 2; 6-story building; Park Central building; Zoning: R8A
- Exterior features: Building roof deck; East and south exposures; Has a view
Interior
- Kitchen: Dishwasher
- Bedrooms: Total of 4 rooms (bedroom count not specified)
- Bathrooms: 1 full bathroom
- Interior features: Basement present (other type)
- Laundry & utility: Building laundry facilities
Neighborhood map
What this means for you Summary
Snapshot
- This is a 2-bed/1.0-bath condo listed at $699k.
Deal economics
- At list price, monthly cash flow is $-82 ($-982/yr) — negative.
- To cash-flow at today's rent, offer at most $685k (2.1% below list).
- To meet the 1% rule (rent ≥ 1% of price), the offer needs to be $661k (5.4% below list).
- Recommended offer: $615k (12.0% below list) — sets the bar for market timing.
- Cap rate 6.2% vs local median 2.6% in New York — top-decile yield for the area; either an underpriced asset or a hidden risk that comps aren't pricing in. Stress-test before assuming the spread holds.
Location & tenants
- Location reads 75/100 on livability (#268 in NY, #4,188 nationally) — a middle-class / working-renter tenant base. Strengths: amenities A+, commute A+, health & safety A; Watch: crime F, cost of living F.
- Zoned schools: Elm Tree Elementary School (math 27% / reading 52%, grade F, #1,444 of 2,108 statewide, top 71%, 806 students, 94% FRL); Mark Twain Is 239 For The Gifted And Talented (math 90% / reading 96%, grade A+, #6 of 729 statewide, top 1%, 1,207 students, 44% FRL); Midwood High School (math 94% / reading 96%, grade A+, #83 of 1,100 statewide, top 8%, 4,062 students, 73% FRL).
- Market conditions: Rents rising (+2.5%/yr); 96 active listings in the ZIP; 30 comparable units currently listed for rent nearby; rentals leasing fast (median 5d on market — plan ~1-2 weeks tenant-placement turnaround); solid renter incomes; 4,467 units permitted in New York County in 2024 (4,463 in 5+ unit buildings).
Forward outlook
- In year one you build about $42k of equity ($5k loan paydown + $37k appreciation (5.3% local appreciation)).
- New York County population projected at +21% by 2050 — long-run rental-demand tailwind backs the buy-and-hold thesis.
- At projected returns (5.3% appreciation + 2.5% rent growth), your $196k cash investment doubles in ~5 years — after that, you're playing with house money.
- By year 2, paydown + projected appreciation supports a ~$67k cash-out refi (75% LTV) — recoverable capital for the next deal without selling this one.
Negotiation context
- It's been on market 215 days — a 12% lower offer ($615k) is reasonable based on typical stale-listing flexibility.
- 2 sale attempts since 13y ago with the ask held roughly flat each time — persistent listings suggest the price (not the market) is what's stuck; bring a comps-based counter.
- Current owner paid $555k; 26% above their basis — modest negotiation headroom, anchor on the comps not their cost.
Risks & watch-outs
- Watch-outs: built in 1910 — expect roof / HVAC / electrical / plumbing capex.
- Climate carrying-cost: major wind risk, 27% chance of damaging wind over 30y; extreme-heat days projected 7→15/yr by 2055 (HVAC capex compounding) — expect insurance premiums to compound above CPI over the hold.
Questions for the listing agent
- What do current leases actually rent for vs. the listed asking? Can we see a recent rent roll and the last 12 months of T-12 income?
- It's been on market 215 days. Have you received any prior offers? Is the seller open to a 12% concession, seller financing, or rate buy-down credit?
- Built in 1910 — when were the roof, HVAC, electrical panel, plumbing, and water heater last replaced?
- What does the HOA fee cover, when was the last increase, and are there any pending special assessments or reserve-fund shortfalls?
- Any open or pending special assessments — roof, HVAC, plumbing, elevator, façade? What's the per-unit balance and payoff schedule, and is the seller paying it off at close or rolling it to the buyer?
- Why hasn't it sold? Are there any deal-killer items the seller is aware of (foundation, flood, title, zoning, code violations)?
- Is there a deadline driving the sale (1031 exchange, divorce, estate, relocation)? That informs how much negotiation room exists.
- Schools are B-rated — typically a magnet for longer-tenancy family renters. What's the average tenant stay here, and is there a school-zone premium baked into asking?
- Crime grade is F in this area — have there been break-ins, vandalism, or insurance claims at this property in the last 3 years? What carrier currently insures it and at what premium?
- What's the average days-on-market for RENTAL listings here right now (not sales)? A rising rental-DOM trend means longer vacancies and softer asking-rent achievability than the comps imply.
- What's the recent tenant-quality profile in this submarket — average credit score on applications, eviction rate, late-payment / NSF rate, and stable-employment percentage? A property-management company in the area should have these aggregated.
- How much new apartment / multifamily construction is in the pipeline within 1–3 miles? Heavy new supply (>2% of stock underway) typically softens rents 12–24 months out; light construction supports rent growth.
Investment metrics
- 1% rule
- 0.95% ✗
- Cap rate
- 6.15%
- Cash-on-cash
- -0.50%
- DSCR
- 0.98
- GRM
- 8.8
CMA / ARV
No comps found within radius.
Projected returns pro-forma
5.26% appreciation · 2.46% rent growth · sell at horizon
- IRR
- 12.9%
- Equity multiple
- 1.83×
- Total profit
- $163,059
- Equity at exit
- $407,120
- IRR
- 13.5%
- Equity multiple
- 3.49×
- Total profit
- $486,810
- Equity at exit
- $711,907
Cash invested: $195,720 (down + closing). Projections, not guarantees.
Landlord ↔ Tenant lean methodology
- Overall (CITY)
- 0 Strongly Tenant-Friendly
- State New York
- 15 Strongly Tenant-Friendly · D+10
- County
- — inherits STATE
- City New York
- 0 Strongly Tenant-Friendly · D+34
ZIP-level market 10026
- Home prices YoY
- 1.6%
- Rents YoY
- 2.5%
- Active inventory
- 96
- Price-to-rent
- 8.8×
Monthly cashflow live
- Estimated rent
- $6,614 high interval (Pro) →
- Mortgage (P&I)
- −$3,666
- Tax from tax record
- −$494 /mo · $5,925/yr
- Insurance
- −$291
- HOA
- −$856
- Vacancy / Maint / Mgmt
- −$1,389
- Net cashflow
- $-82
Break-even live
Sensitivity live
| Price | -10% $314 | -5% $116 | +0% $-82 | +5% $-280 | +10% $-478 |
|---|---|---|---|---|---|
| Rent | -10% $-604 | -5% $-343 | +0% $-82 | +5% $179 | +10% $441 |
| Rate | -1.0pp $270 | -0.5pp $96 | base $-82 | +0.5pp $-263 | +1.0pp $-447 |
UW: 25.0% down · 7.5% · 30yr · 1.5% tax · 5.0% vac · 8.0% maint · 8.0% mgmt
Financing live
Cash to close
- Down payment
- $174,750
- Closing costs
- $20,970
- Reserves months
- —
- Total cash needed
- —
Loan-product check · same deal, 3 products live
Conventional
25% down · 7.5% · 30yr
- Down + closing
- —
- Monthly P&I
- —
- Monthly cashflow
- —
- DSCR
- —
- Eligible?
- —
Personal DTI + credit; lowest rate.
DSCR
20% down · 8.5% · 30yr
- Down + closing
- —
- Monthly P&I
- —
- Monthly cashflow
- —
- DSCR
- —
- Eligible?
- —
No personal income docs; deal must DSCR.
Hard money
10% down · 12.0% · 12mo
- Down + closing
- —
- Monthly P&I
- —
- Monthly cashflow
- —
- DSCR
- —
- Eligible?
- —
Short-term bridge; refi at stabilization.
Rent comps 30 comps
| Address | Beds | Baths | Sqft | Rent | $/sqft | DOM | Units | Dist |
|---|---|---|---|---|---|---|---|---|
| 1 Morningside Dr New York, NY | 3.0 | 1.0–2.0 | 1655 | $8,195 | $4.95 | 0d | 1 | 0.31mi |
| 30 Morningside Dr #2096 New York, NY | 1.0–2.0 | 1.0–2.0 | 780 | $8,940 | $11.45 | 1d | 2 | 0.33mi |
| 202 W 102nd St Unit 1053014P New York, NY | 2.0 | 2.0 | 538 | $10,000 | $18.59 | 23d | 1 | 0.67mi |
| 308 W 107th St Unit 1239985P New York, NY | 1.0 | 1.0 | 559 | $5,497 | $9.83 | 1d | 1 | 0.68mi |
| 915 W End Ave #1020 New York, NY | 1.0–3.0 | 1.0–2.0 | 851 | $7,305 | $8.58 | 1d | 2 | 0.71mi |
| 808 Columbus Ave New York, NY | 2.0 | 1.0–2.0 | 773 | $9,876 | $12.77 | 0d | 30 | 0.72mi |
| 788 Columbus Ave #1323 New York, NY | 1.0–3.0 | 1.0–1.5 | 900 | $6,320 | $7.02 | 26d | 2 | 0.74mi |
| 814 Amsterdam Ave #1019 New York, NY | 1.0–2.0 | 1.0–2.0 | 800 | $5,270 | $6.59 | 26d | 2 | 0.74mi |
| 122 E 102nd St Unit 1021896P New York, NY | 2.0 | 1.0 | 742 | $5,429 | $7.32 | 17d | 1 | 0.87mi |
| 70 W 95th St New York, NY | 1.0–4.0 | 1.0–2.0 | 1095 | $13,166 | $12.02 | 18d | 1 | 0.88mi |
| 266 W 96th St #2030 New York, NY | 1.0 | 1.0 | 512 | $5,800 | $11.33 | 8d | 1 | 0.97mi |
| 255 W 94th St #686 New York, NY | 1.0–2.0 | 1.0–2.0 | 750 | $9,090 | $12.12 | 1d | 2 | 1.01mi |
| 1501 Lexington Ave #932 New York, NY | 1.0 | 1.0 | 583 | $7,403 | $12.69 | 1d | 3 | 1.05mi |
| 101 W 90th St New York, NY | 3.0 | 1.0–2.5 | 962 | $6,711 | $6.97 | 0d | 1 | 1.11mi |
| 175 E 96th St Unit 1251683P New York, NY | 2.0 | 1.0 | 600 | $6,380 | $10.63 | 4d | 2 | 1.11mi |
| 132 W 134th St New York, NY | 2.0 | 1.0 | 750 | $4,500 | $6.00 | 26d | 1 | 1.12mi |
| 212 W 91st St New York, NY | 1.0–2.0 | 1.0–2.0 | 825 | $9,650 | $11.70 | 4d | 3 | 1.15mi |
| 212 W 91st St New York, NY | 1.0–2.0 | 1.0–2.0 | 825 | $9,650 | $11.70 | 5d | 4 | 1.15mi |
| 212 W 91st St #416 New York, NY | 1.0–2.0 | 1.0–2.0 | 825 | $9,660 | $11.71 | 1d | 2 | 1.16mi |
| 215 E 96th St Unit 688 New York, NY | 1.0 | 1.0 | 717 | $7,810 | $10.89 | 0d | 1 | 1.17mi |
| 215 E 95th St #1293 New York, NY | 1.0–2.0 | 1.0–1.5 | 740 | $6,100 | $8.24 | 1d | 2 | 1.21mi |
| 210 W 89th St #165 New York, NY | 1.0 | 1.0 | 600 | $5,730 | $9.55 | 1d | 2 | 1.24mi |
| 118 E 91st St Unit 1022052P New York, NY | 3.0 | 1.0 | 592 | $6,180 | $10.44 | 9d | 1 | 1.26mi |
| 43 W 85th St Unit 1470323P New York, NY | 1.0 | 1.0 | 699 | $6,466 | $9.25 | 6d | 1 | 1.34mi |
| 2413 3rd Ave Bronx, NY | 1.0–3.0 | 1.0–2.0 | 857 | $4,022 | $4.69 | 1d | 21 | 1.39mi |
| 345 E 94th St #1470 New York, NY | 2.0 | 1.0–2.0 | 710 | $7,570 | $10.65 | 5d | 3 | 1.39mi |
| 5 Lincoln Ave Bronx, NY | 1.0–3.0 | 1.0–2.5 | 1011 | $5,138 | $5.08 | 0d | 181 | 1.40mi |
| 160 E 88th St #1332 New York, NY | 1.0 | 1.0 | 560 | $5,670 | $10.12 | 8d | 1 | 1.42mi |
| 200 E 89th St Unit 12G New York, NY | 1.0 | 1.0 | 650 | $5,000 | $7.69 | 19d | 1 | 1.43mi |
| 235 E 89th St Unit 1495783P New York, NY | 2.0 | 1.0 | 699 | $7,443 | $10.65 | 22d | 1 | 1.47mi |
HOA detail condo
- Monthly dues
- $856 · $10,272/yr
- Assessments
- None detected in remarks — confirm with the listing agent.
Listing history 16 events
-
2026-06-21days on market $699,000 Active 215 DOM
-
2026-06-18days on market $699,000 Active 212 DOM
-
2026-06-17days on market $699,000 Active 211 DOM
-
2026-06-15days on market $699,000 Active 209 DOM
-
2026-06-13days on market $699,000 Active 207 DOM
-
2026-06-10days on market $699,000 Active 203 DOM
-
2026-06-08days on market $699,000 Active 202 DOM
-
2026-06-04days on market $699,000 Active 198 DOM
-
2026-06-03days on market $699,000 Active 197 DOM
-
2026-06-01days on market $699,000 Active 195 DOM
-
2026-05-31days on market $699,000 Active 194 DOM
-
2025-11-18$699,000 Active
-
2025-07-02price $735,000
-
2013-11-14soldstatus $555,000
-
2013-08-28price $565,000
-
2013-05-20$555,000
ⓘ Source: listings_history table (triggers on properties + properties_extension) + one-shot
backfill from property_details.listing_events for pre-trigger history.
Tax reassessment forecast NY · Partial reset (capped growth)
- Current annual tax
- $5,925 · $494/mo
- Projected year-2 tax
- $8,869 · $739/mo
- Expected delta
- +$2,944/yr (+$245/mo · 49.7%)
ⓘ Screening estimate from a state-policy table — verify with the county assessor before closing.
Climate risk First Street
- Flood 1/10 Low FEMA zone X (unshaded) · 0% chance over 30 yrs
- Wildfire 1/10 Low
- Heat 6/10 Major 7 d/yr ≥99°F today · 15 d/yr by 30 yrs out
- Wind 6/10 Major 27% chance of damaging wind over 30 yrs
- Air quality 4/10 Moderate 5 unhealthy d/yr today · 6 by 30 yrs out
Nearby sold comps map
Loading sold comps map…
Walkable amenities ~0.75 mi
Loading nearby amenities…
Taxation est. · year 1
- Rental income
- $79,364
- − Mortgage interest
- −$39,155
- − Property taxes
- −$5,925
- − Insurance
- −$3,495
- − Repairs & maintenance
- −$6,349
- − Management
- −$6,349
- − HOA
- −$10,272
- − Depreciation
- −$20,335
- Taxable loss
- −$12,516
- Est. tax savings @ 24.0%
- +$3,004
- After-tax cash flow
- $2,021/yr
For passive investors: Depreciation is non-cash, so a rental often shows a tax loss while cash-flowing — sheltering income. Rental losses are passive: they offset passive income freely, and up to $25,000/yr can offset ordinary (W-2) income if you actively participate and your MAGI is under $100k (phasing out to $0 by $150k); unused losses carry forward. On sale, claimed depreciation is recaptured at up to 25%, and gains may owe capital-gains tax (a 1031 exchange can defer both). Figures are a year-1 estimate at your 24.0% rate — not tax advice; consult a CPA.
Schools (NCES district)
No district data.
Livability — New York
- Score
- 75/100
- State rank
- #268
- US rank
- #4188
Category grades
Schools grade is shown separately in the Schools card above.
Census & demographics
- Census place
- New York, NY
- County
- New York County · 1,599,927 people
- City population
- 7,731,280
- Metro
- New York-Newark-Jersey City, NY-NJ-PA
- Population (ZIP)
- 37,123
- Household income
- $81,244
- Rent vs Own
- Severe rent burden
- 2685.0
Population outlook (New York County) Hauer SSP2
- Today (2025)
- 1,825,725 people
- By 2030
- 1,904,611 · +4.3%
- By 2040
- 2,052,719 · +12.4%
- By 2050
- 2,206,601 · +20.9%
- By 2075
- 2,509,427 · +37.4%
- By 2100
- 2,702,933 · +48.0%
Race, ethnicity, and origin ACS 2023
- Neighborhood character
- Diverse neighborhood (Simpson 0.69)
- Race & ethnicity
- Black 45% White 25% Hispanic / Latino 18% Two or more races 11% Asian 6%
- Hispanic origin (detail)
- Mexican 1% Puerto Rican 4% Dominican 8%
- Common ancestry
- Lithuanian 2% Hispanic 2% Scotch-Irish 1%
- Foreign-born
- 27% · Canada, China, Vietnam
- Languages at home
- 67% English-only · Spanish 14% French/Haitian/Cajun 8% Other Indo-European 2%
Political lean MEDSL · New York
- 2024 margin
- Solid D (+64.8) · D 82.4% · R 17.6%
- 2008→2024 swing
- -7.4pp toward R · 2008: 72.2pp · 2024: 64.8pp
- All cycles
- 2024: D+64.8 2020: D+74.5 2016: D+77.2 2012: D+69.6 2008: D+72.2
Not yet ingested
- Civics
- —
Market trends
- HPI YoY
- ▲ 5.26%
- Current HPI
- 330.628
- Rent YoY
- ▲ 2.46%
- Metro
- New York-Newark-Jersey City, NY-NJ-PA
- State GDP YoY
- ▲ 2.60%
- F500 in state
- 92
Industry mix (Fortune 500 HQ in NY)
| Industry | F500 HQs | Revenue |
|---|---|---|
| Financial Services | 10 | $950B |
|
||
| Consumer Goods | 9 | $162B |
|
||
| Insurance | 4 | $225B |
|
||
| Telecommunications | 2 | $144B |
|
||
| Pharmaceuticals | 2 | $112B |
|
||
| Media / Entertainment | 2 | $69B |
|
||
Price history
+25.9% since first listed5 events — show timeline
- 2025-11-18 Listed $699,000 RLS at REBNY
- 2025-07-02 Price Changed $735,000 RLS at REBNY
- 2013-11-14 Sold (Public Records) $555,000 Public Records
- 2013-08-28 Price Changed $565,000 RLS at REBNY
- 2013-05-20 Listed $555,000 RLS at REBNY
Property tax history
+6.9%/yrLatest (2025): $5,925 · +3.3% YoY. Source: county tax records.
Cash-flow waterfall
monthlySold comps — $/sqft
last 12 mo · ≤1 miLoading sold comps…