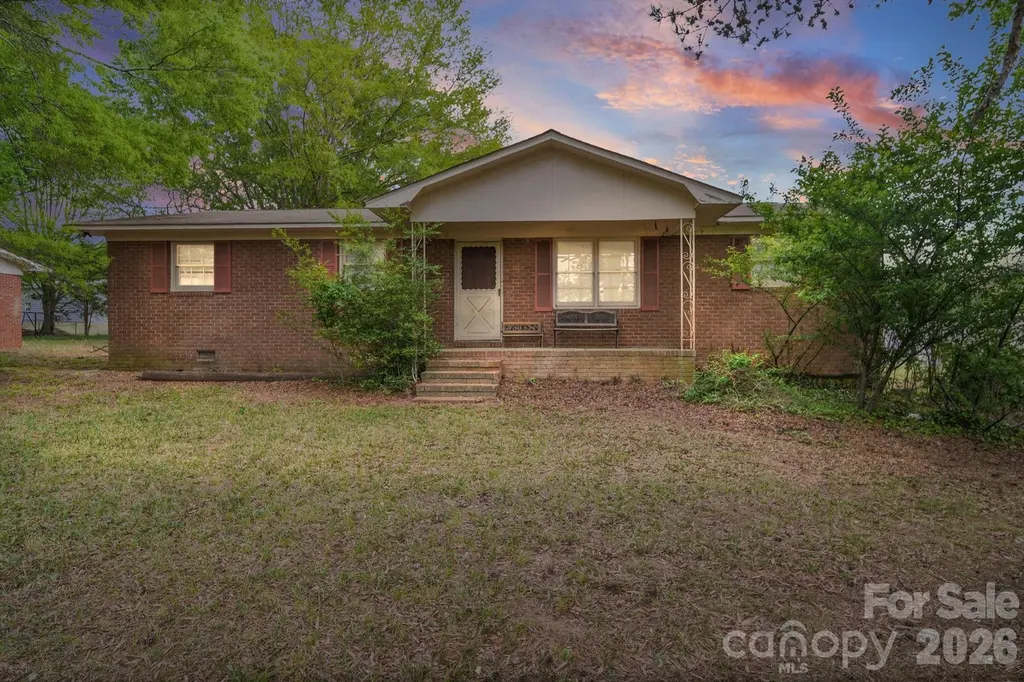
103 Pine St · Locust, NC
Flood risk 1/10 · Minimal
- FEMA flood zone
- X (unshaded)
- Chance of flooding over 30 yrs
- 0.0%
- Est. flood insurance / yr
- $507 – $1,088
Fire risk 4/10 · Minor
- Est. fire insurance / yr
- $906 – $1,684
Heat risk 6/10 · Moderate
- Hot days now (above 105°F)
- 7 days/yr
- Hot days in 30 yrs
- 16 days/yr
Wind risk 6/10 · Moderate
- Chance of severe wind over 30 yrs
- 27.0%
Air-quality risk 3/10 · Minor
- Unhealthy air days now
- 2 days/yr
- Unhealthy air days in 30 yrs
- 3 days/yr
Risk factors via First Street. Map © Google.
Why this score? — see what drove the B- grade
The composite is a weighted blend of 9 inputs, each scored 0–100. Each bar is that input's sub-score; the figure is the points it added to the 100-point composite (weight × sub-score).
- Cash flow +24.9/30.0
- Appreciation +10.0/10.0
- DSCR +8.1/10.0
- ARV discount +7.5/15.0
- 1% rule +6.1/10.0
- Schools +3.4/10.0
- Livability +3.1/5.0
- Rent growth +2.5/5.0
- Condition / age +2.5/5.0
$169,000
🖨 Deal sheet 📄 Offer letter ✓ Due diligence
Listing remarks MLS
This home has had remodeling work done but needs more. Side of home is being made into the 'new' front of home in order to face the new Charleston Place subdivison,a golf cart community with easy access to Locust Town Center.The new floor plan offers a great room, walk in pantry/utility room and possiblity of 4th bedroom and 2nd bathroom.***Seller will entertain any offers***
Key facts
- 0.41 acre lot
- Built 1971
- Listed 7 days
Property features AI
Finance
- Other: Zoning: MH
- HOA & community: No HOA
Exterior
- Parking: Driveway
- Utilities: Public water; Public sewer
- Home design: Single-family residence (residential); One level
- Construction: Site-built construction; Partial brick exterior with other materials; Crawl space foundation
- Exterior features: Lot approximately 0.41 acres; Road surfaces include gravel and paved
Interior
- Kitchen: No appliances specified
- Bedrooms: 4 bedrooms on the main level
- Bathrooms: 2 full bathrooms on the main level
- Heating & cooling: Central heating; Central air; Some systems listed as none
- Interior features: 9 total rooms; No built-in appliances listed
- Laundry & utility: Laundry located inside
Neighborhood map
What this means for you Summary
Snapshot
- This is a 4-bed/2.0-bath single-family listed at $169k.
Deal economics
- At list price, monthly cash flow is $365 ($4k/yr) — positive.
- The deal already cash-flows at list — no discount required.
- Meets the 1% rule at list price ($2k rent vs $169k).
- Cap rate 8.9% vs local median 2.6% in Locust — top-decile yield for the area; either an underpriced asset or a hidden risk that comps aren't pricing in. Stress-test before assuming the spread holds.
Location & tenants
- Location reads 62/100 on livability (#458 in NC) — a middle-class / working-renter tenant base. Strengths: cost of living A+, housing A+, crime A; Watch: amenities F, commute F, health & safety F.
- Stanly County Schools (rural): math 38% / reading 42% proficiency, ranked #113 of 178 in NC (top 64%) — families likely to look elsewhere, expect single-tenant / working-renter base with shorter leases.
- Zoned schools: West Stanly High (math 72% / reading 62%, grade B, #142 of 535 statewide, top 28%, 762 students, 36% FRL).
- Zoned-school proficiency averages 67% at this address vs 40% district-wide (+27 pts) — the actual schools serving this property are materially stronger than the Stanly County Schools average implies; a family-tenant draw the district grade alone would hide.
- Market conditions: 166 active listings in the ZIP; 367 units permitted in Stanly County in 2024 (0 in 5+ unit buildings).
Forward outlook
- In year one you build about $18k of equity ($1k loan paydown + $17k appreciation (10.0% local appreciation)).
- Stanly County population projected at -10% by 2050 — secular population decline; favor cash flow + early exit over multi-decade hold.
- At projected returns (10.0% appreciation + 3.0% rent growth), your $47k cash investment doubles in ~3 years — after that, you're playing with house money.
- By year 3, paydown + projected appreciation supports a ~$46k cash-out refi (75% LTV) — recoverable capital for the next deal without selling this one.
Negotiation context
- Only 7 days on market — expect competitive offers; lowballing is unlikely to land.
- Current owner paid $123k; 37% above their basis — modest negotiation headroom, anchor on the comps not their cost.
Risks & watch-outs
- Climate carrying-cost: major wind risk, 27% chance of damaging wind over 30y; extreme-heat days projected 7→16/yr by 2055 (HVAC capex compounding) — expect insurance premiums to compound above CPI over the hold.
Questions for the listing agent
- Built in 1971 — when were the roof, HVAC, electrical panel, plumbing, and water heater last replaced?
- Is there a deadline driving the sale (1031 exchange, divorce, estate, relocation)? That informs how much negotiation room exists.
- Schools are D-rated, which usually means shorter tenancies and higher turnover. Who's the typical renter profile here, and what's been the actual vacancy rate?
- What's the average days-on-market for RENTAL listings here right now (not sales)? A rising rental-DOM trend means longer vacancies and softer asking-rent achievability than the comps imply.
- What's the recent tenant-quality profile in this submarket — average credit score on applications, eviction rate, late-payment / NSF rate, and stable-employment percentage? A property-management company in the area should have these aggregated.
- How much new for-sale + rental construction is in the pipeline within 1–3 miles? Heavy new supply typically softens prices + rents 12–24 months out; constrained supply supports both.
Investment metrics
- 1% rule
- 1.11% ✓
- Cap rate
- 8.89%
- Cash-on-cash
- 9.27%
- DSCR
- 1.41
- GRM
- 7.5
CMA / ARV
- ARV (on-the-fly)
- $428,160
- Comps found
- 12
Show comp detail 12 sales within ~0.75 mi
| Address | Dist | Beds/Ba | Sqft | Sold | Price | $/sf | Match |
|---|---|---|---|---|---|---|---|
| 216 Smith St | 0.17mi | 3/2.0 (-1) | 1,689 (-5%) | 2mo | $420,000 | $249 | 77 |
| 306 Old Hickory Rd | 0.40mi | 3/2.0 (-1) | 1,940 (+9%) | 1mo | $485,000 | $250 | 61 |
| 267 Harrison Ln | 0.47mi | 3/2.5 (-1) | 1,732 (-3%) | 7mo | $306,500 | $177 | 60 |
| 248 Kerri Dawn Ln | 0.34mi | 3/2.5 (-1) | 2,000 (+12%) | 1mo | $360,000 | $180 | 56 |
| 159 Kingston Dr | 0.39mi | 3/2.0 (-1) | 1,562 (-12%) | 7mo | $375,000 | $240 | 51 |
| 108 Woodwinds St | 0.25mi | 3/2.5 (-1) | 2,028 (+14%) | 10mo | $580,000 | $286 | 50 |
| 134 Kerri Dawn Ln | 0.46mi | 3/2.5 (-1) | 1,975 (+11%) | 5mo | $370,000 | $187 | 50 |
| 156 Kerri Dawn Ln | 0.42mi | 3/2.0 (-1) | 1,565 (-12%) | 7mo | $375,000 | $240 | 49 |
| 127 Kingston Dr | 0.44mi | 3/2.0 (-1) | 1,553 (-13%) | 9mo | $385,000 | $248 | 46 |
| 146 Kerri Dawn Ln | 0.44mi | 3/2.5 (-1) | 2,033 (+14%) | 5mo | $359,900 | $177 | 45 |
| 529 N Central Ave | 0.59mi | 3/2.5 (-1) | 1,619 (-9%) | 10mo | $415,000 | $256 | 41 |
| 282 Harrison Ln | 0.48mi | 3/2.5 (-1) | 2,014 (+13%) | 10mo | $440,000 | $218 | 41 |
Match score weights: distance 35% · size 25% · config 20% · recency 20%. Top-matched comps best support the ARV.
Projected returns pro-forma
10.0% appreciation · 3.0% rent growth · sell at horizon
- IRR
- 31.0%
- Equity multiple
- 3.44×
- Total profit
- $115,309
- Equity at exit
- $152,249
- IRR
- 26.9%
- Equity multiple
- 7.79×
- Total profit
- $321,258
- Equity at exit
- $328,330
Cash invested: $47,320 (down + closing). Projections, not guarantees.
Landlord ↔ Tenant lean methodology
- Overall (STATE)
- 85 Strongly Landlord-Friendly
- State North Carolina
- 85 Strongly Landlord-Friendly · R+3
- County
- — inherits STATE
- City
- — inherits STATE
ZIP-level market 28097
- Home prices YoY
- 7.0%
- Active inventory
- 166
- Price-to-rent
- 7.5×
Monthly cashflow live
- Estimated rent
- $1,875 medium interval (Pro) →
- Mortgage (P&I)
- −$886
- Tax from tax record
- −$159 /mo · $1,911/yr
- Insurance
- −$70
- HOA
- −$0
- Vacancy / Maint / Mgmt
- −$394
- Net cashflow
- $365
Break-even live
UW: 25.0% down · 7.5% · 30yr · 1.5% tax · 5.0% vac · 8.0% maint · 8.0% mgmt
Financing live
Cash to close
- Down payment
- $42,250
- Closing costs
- $5,070
- Reserves months
- —
- Total cash needed
- —
Loan-product check · same deal, 3 products live
Conventional
25% down · 7.5% · 30yr
- Down + closing
- —
- Monthly P&I
- —
- Monthly cashflow
- —
- DSCR
- —
- Eligible?
- —
Personal DTI + credit; lowest rate.
DSCR
20% down · 8.5% · 30yr
- Down + closing
- —
- Monthly P&I
- —
- Monthly cashflow
- —
- DSCR
- —
- Eligible?
- —
No personal income docs; deal must DSCR.
Hard money
10% down · 12.0% · 12mo
- Down + closing
- —
- Monthly P&I
- —
- Monthly cashflow
- —
- DSCR
- —
- Eligible?
- —
Short-term bridge; refi at stabilization.
Listing history 5 events
-
2026-05-08status Pending
-
2026-05-01$169,000 Active
-
2015-02-02soldstatus $123,000
-
2011-11-14soldstatus $77,000
-
2011-11-11soldstatus $55,000 378-char remark
Show marketing remark (378 chars)
This home has had remodeling work done but needs more. Side of home is being made into the 'new' front of home in order to face the new Charleston Place subdivison,a golf cart community with easy access to Locust Town Center.The new floor plan offers a great room, walk in pantry/utility room and possiblity of 4th bedroom and 2nd bathroom.***Seller will entertain any offers***
ⓘ Source: listings_history table (triggers on properties + properties_extension) + one-shot
backfill from property_details.listing_events for pre-trigger history.
Tax reassessment forecast NC · Resets to sale price
- Current annual tax
- $1,911 · $159/mo
- Projected year-2 tax
- $1,911 · $159/mo
- Expected delta
- $0/yr ($0/mo · 0.0%)
ⓘ Screening estimate from a state-policy table — verify with the county assessor before closing.
Climate risk First Street
- Flood 1/10 Low FEMA zone X (unshaded) · 0% chance over 30 yrs
- Wildfire 4/10 Moderate
- Heat 6/10 Major 7 d/yr ≥105°F today · 16 d/yr by 30 yrs out
- Wind 6/10 Major 27% chance of damaging wind over 30 yrs
- Air quality 3/10 Moderate 2 unhealthy d/yr today · 3 by 30 yrs out
Nearby sold comps map
Loading sold comps map…
Walkable amenities ~0.75 mi
Loading nearby amenities…
Taxation est. · year 1
- Rental income
- $22,500
- − Mortgage interest
- −$9,467
- − Property taxes
- −$1,911
- − Insurance
- −$845
- − Repairs & maintenance
- −$1,800
- − Management
- −$1,800
- − Depreciation
- −$4,916
- Taxable income
- $1,762
- Est. tax owed @ 24.0%
- −$423
- After-tax cash flow
- $3,962/yr
For passive investors: Depreciation is non-cash, so a rental often shows a tax loss while cash-flowing — sheltering income. Rental losses are passive: they offset passive income freely, and up to $25,000/yr can offset ordinary (W-2) income if you actively participate and your MAGI is under $100k (phasing out to $0 by $150k); unused losses carry forward. On sale, claimed depreciation is recaptured at up to 25%, and gains may owe capital-gains tax (a 1031 exchange can defer both). Figures are a year-1 estimate at your 24.0% rate — not tax advice; consult a CPA.
Schools (NCES district)
- District
- Stanly County Schools
- NCES district ID
- 3704320
- Math proficiency
- 38% ▼ -1.00%
- Reading proficiency
- 42% ▲ 1.00%
- Median HH income
- $43,802
- Composite
- 33.9/100
- National rank
- #5343
- State rank
- #113 of 178 in NC
Livability — Locust
- Score
- 62/100
- State rank
- #458
- US rank
- #16792
Category grades
Schools grade is shown separately in the Schools card above.
Census & demographics
- Census place
- Locust, NC
- Population (ZIP)
- 7,976
Population outlook (Stanly County) Hauer SSP2
- Today (2025)
- 60,082 people
- By 2030
- 59,485 · -1.0%
- By 2040
- 57,407 · -4.5%
- By 2050
- 54,051 · -10.0%
- By 2075
- 45,384 · -24.5%
- By 2100
- 34,694 · -42.3%
Race, ethnicity, and origin ACS 2023
- Neighborhood character
- Predominantly White (94%)
- Race & ethnicity
- White 94% Hispanic / Latino 5% Two or more races 3%
- Common ancestry
- Serbian 4% Slovak 3% Romanian 2%
- Foreign-born
- 1% · Canada
- Languages at home
- 98% English-only · Spanish 1%
Political lean MEDSL · Stanly
- 2024 margin
- Solid R (+50.9) · D 24.2% · R 75.1%
- 2008→2024 swing
- -14.2pp toward R · 2008: -36.7pp · 2024: -50.9pp
- All cycles
- 2024: R+50.9 2020: R+51.1 2016: R+50.2 2012: R+40.4 2008: R+36.7
Not yet ingested
- Civics
- —
Market trends
- HPI YoY
- ▲ 26.92%
- Current HPI
- 409.27
- Rent YoY
- —
- Metro
- —
- State GDP YoY
- ▲ 3.28%
- F500 in state
- 26
Industry mix (Fortune 500 HQ in NC)
| Industry | F500 HQs | Revenue |
|---|---|---|
| Financial Services | 2 | $213B |
|
||
| Retail | 2 | $95B |
|
||
| Industrial Conglomerate | 1 | $38B |
|
||
| Metals / Steel | 1 | $35B |
|
||
| Utilities | 1 | $30B |
|
||
| Industrial Machinery | 1 | $19B |
|
||
Price history
+207.3% since first listed5 events — show timeline
- 2026-05-08 Pending — CANOPYMLS as Distributed by MLS Grid
- 2026-05-01 Listed $169,000 CANOPYMLS as Distributed by MLS Grid
- 2015-02-02 Sold (Public Records) $123,000 Public Records
- 2011-11-14 Sold (Public Records) $77,000 Public Records
- 2011-11-11 Sold (MLS) $55,000 CANOPYMLS as Distributed by MLS Grid
Property tax history
+3.2%/yrLatest (2025): $1,911 · +13.9% YoY. Source: county tax records.
Cash-flow waterfall
monthlySold comps — $/sqft
last 12 mo · ≤1 miLoading sold comps…