 Duplex
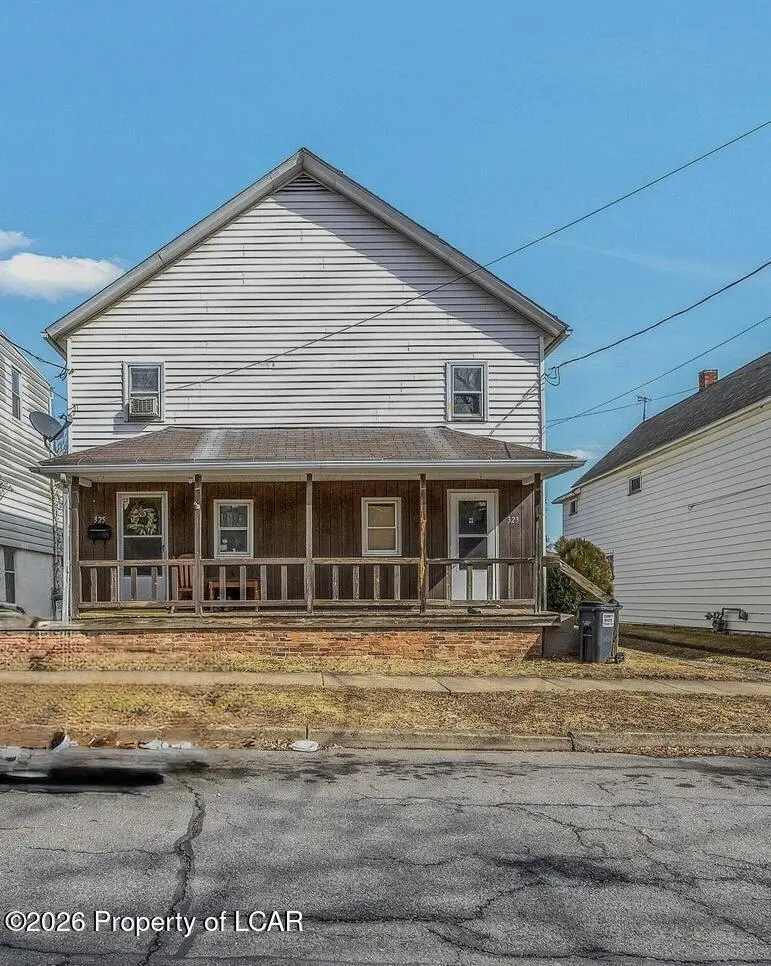
323 325 Vaughn St · Luzerne, PA
Flood risk 9/10 · Severe
- FEMA flood zone
- X
- Chance of flooding over 30 yrs
- 0.99%
- Est. flood insurance / yr
- $507 – $1,088
Fire risk 3/10 · Minor
- Est. fire insurance / yr
- $511 – $949
Heat risk 4/10 · Minor
- Hot days now (above 97°F)
- 7 days/yr
- Hot days in 30 yrs
- 16 days/yr
Wind risk 3/10 · Minor
- Chance of severe wind over 30 yrs
- 4.0%
Air-quality risk 3/10 · Minor
- Unhealthy air days now
- 2 days/yr
- Unhealthy air days in 30 yrs
- 4 days/yr
Risk factors via First Street. Map © Google.
Why this score? — see what drove the B- grade
The composite is a weighted blend of 9 inputs, each scored 0–100. Each bar is that input's sub-score; the figure is the points it added to the 100-point composite (weight × sub-score).
- Cash flow +27.4/30.0
- Appreciation +10.0/10.0
- DSCR +9.6/10.0
- 1% rule +6.9/10.0
- Livability +3.8/5.0
- ARV discount +2.9/15.0
- Rent growth +2.5/5.0
- Schools +2.5/10.0
- Condition / age +2.5/5.0
$229,500
🖨 Deal sheet 📄 Offer letter ✓ Due diligence
Multi-family units
County records classify this as Multi-Family (2-4 Unit). Listing-text estimate: 2 units. confirmed
Listing remarks MLS
Fantastic investment or owner occupant opportunity! This multi unit home is perfect for investors or those looking to live in one unit while generating income from the other. One side is recently updated, currently vacant and move in ready! The other unit is tenant occupied on a MTM lease, renting at $1,000 a month.
Key facts
- 8,967 sq ft lot
- Listed 5 days
Neighborhood map
What this means for you Summary
Snapshot
- This is a 2 × 3-bed/1.0-bath units multifamily listed at $230k.
Deal economics
- At list price, monthly cash flow is $602 ($7k/yr) — positive. Per door: $301/mo.
- The deal already cash-flows at list — no discount required.
- Meets the 1% rule at list price ($3k rent vs $230k).
- Cap rate 9.8% vs local median 6.1% in Luzerne — top-decile yield for the area; either an underpriced asset or a hidden risk that comps aren't pricing in. Stress-test before assuming the spread holds.
Location & tenants
- Location reads 76/100 on livability (#391 in PA, #3,538 nationally) — a middle-class / working-renter tenant base. Strengths: crime A+, cost of living A+, housing A+; Watch: amenities C-, schools D+, commute F.
- Wyoming Valley West SD (suburban): math 18% / reading 42% proficiency, ranked #445 of 539 in PA (top 83%) — families likely to look elsewhere, expect single-tenant / working-renter base with shorter leases.
- Market conditions: 17 active listings in the ZIP; 1 comparable units currently listed for rent nearby; 349 units permitted in Luzerne County in 2024 (16 in 5+ unit buildings).
Forward outlook
- In year one you build about $25k of equity ($2k loan paydown + $23k appreciation (10.0% local appreciation)).
- Luzerne County population projected at +4% by 2050 — modest demand growth; plan on rents tracking national, not racing it.
- At projected returns (10.0% appreciation + 3.0% rent growth), your $64k cash investment doubles in ~2 years — after that, you're playing with house money.
- By year 2, paydown + projected appreciation supports a ~$39k cash-out refi (75% LTV) — recoverable capital for the next deal without selling this one.
Negotiation context
- Only 5 days on market — expect competitive offers; lowballing is unlikely to land.
- 3 sale attempts with the ask held roughly flat each time — persistent listings suggest the price (not the market) is what's stuck; bring a comps-based counter.
- Current owner paid $195k; 18% above their basis — modest negotiation headroom, anchor on the comps not their cost.
Risks & watch-outs
- Watch-outs: flood insurance adds $66/mo; built in 1930 — expect roof / HVAC / electrical / plumbing capex.
- Climate carrying-cost: severe flood risk — expect insurance premiums to compound above CPI over the hold.
Questions for the listing agent
- Can we see the unit-by-unit rent roll, current vacancy, and any below-market leases? What's the average tenancy length?
- What capital expenditures (roof, boiler, parking lot, exteriors) have been made in the last 5 years, and what's planned in the next 2?
- Built in 1930 — when were the roof, HVAC, electrical panel, plumbing, and water heater last replaced?
- What's the actual annual flood-insurance premium (NFIP or private), and is the property in a SFHA with mandatory coverage?
- Is there a deadline driving the sale (1031 exchange, divorce, estate, relocation)? That informs how much negotiation room exists.
- Schools are D-rated, which usually means shorter tenancies and higher turnover. Who's the typical renter profile here, and what's been the actual vacancy rate?
- What's the average days-on-market for RENTAL listings here right now (not sales)? A rising rental-DOM trend means longer vacancies and softer asking-rent achievability than the comps imply.
- What's the recent tenant-quality profile in this submarket — average credit score on applications, eviction rate, late-payment / NSF rate, and stable-employment percentage? A property-management company in the area should have these aggregated.
- How much new apartment / multifamily construction is in the pipeline within 1–3 miles? Heavy new supply (>2% of stock underway) typically softens rents 12–24 months out; light construction supports rent growth.
Investment metrics
- 1% rule
- 1.19% ✓
- Cap rate
- 9.79%
- Cash-on-cash
- 12.49%
- DSCR
- 1.56
- GRM
- 7.0
CMA / ARV
- ARV (on-the-fly)
- $208,152
- Comps found
- 12
Show comp detail 12 sales within ~0.75 mi
| Address | Dist | Beds/Ba | Sqft | Sold | Price | $/sf | Match |
|---|---|---|---|---|---|---|---|
| 328 Charles St | 0.17mi | 6/2.0 | 2,200 (-11%) | 6mo | $185,500 | $84 | 68 |
| 805-807 Willard St | 0.69mi | 6/2.0 | 2,488 (+0%) | 0mo | $200,000 | $80 | 67 |
| 271-273 Walnut St | 0.15mi | 6/4.0 | 2,694 (+9%) | 5mo | $239,900 | $89 | 66 |
| 775-777 Bennett St | 0.69mi | 6/2.0 | 2,448 (-1%) | 7mo | $265,000 | $108 | 60 |
| 1154 1156 Murray St | 0.68mi | 6/2.0 | 2,327 (-6%) | 5mo | $276,000 | $119 | 54 |
| 43 45 Eley St | 0.46mi | 5/2.0 (-1) | 2,394 (-3%) | 18mo | $235,000 | $98 | 53 |
| 239 241 Kelly St | 0.59mi | 6/2.0 | 2,670 (+8%) | 10mo | $211,000 | $79 | 51 |
| 294 Main St | 0.60mi | 5/3.0 (-1) | 2,549 (+3%) | 17mo | $170,000 | $67 | 44 |
| 499 Slocum St | 0.70mi | 6/2.0 | 2,642 (+7%) | 14mo | $90,000 | $34 | 44 |
| 432 434 Schuyler Ave | 0.69mi | 6/2.0 | 2,800 (+13%) | 9mo | $249,000 | $89 | 38 |
| 486 488 Slocum St | 0.67mi | 6/3.0 | 2,264 (-9%) | 24mo | $160,000 | $71 | 30 |
| 51-53 Price St | 0.72mi | 6/2.0 | 2,800 (+13%) | 21mo | $202,000 | $72 | 27 |
Match score weights: distance 35% · size 25% · config 20% · recency 20%. Top-matched comps best support the ARV.
Projected returns pro-forma
10.0% appreciation · 3.0% rent growth · sell at horizon
- IRR
- 32.5%
- Equity multiple
- 3.54×
- Total profit
- $163,376
- Equity at exit
- $206,752
- IRR
- 28.1%
- Equity multiple
- 8.02×
- Total profit
- $451,007
- Equity at exit
- $445,868
Cash invested: $64,260 (down + closing). Projections, not guarantees.
Landlord ↔ Tenant lean methodology
- Overall (STATE)
- 62 Landlord-Friendly
- State Pennsylvania
- 62 Landlord-Friendly · EVEN
- County
- — inherits STATE
- City
- — inherits STATE
ZIP-level market 18709
- Home prices YoY
- 12.7%
- Active inventory
- 17
- Price-to-rent
- 13.9×
Monthly cashflow live
- Estimated rent
- $2,742 high interval (Pro) →
- Mortgage (P&I)
- −$1,204
- Tax from tax record
- −$198 /mo · $2,380/yr
- Insurance
- −$96
- Flood insurance flood zone
- −$66 /mo · $798/yr
- HOA
- −$0
- Vacancy / Maint / Mgmt
- −$576
- Net cashflow
- $602
Break-even live
2-unit breakdown (identical units grouped — click to expand)
| Units | Beds | Baths | Est. rent |
|---|---|---|---|
| 2× units | 3 | 1 | $2,742 |
| #1 | 3 | 1 | $1,371 |
| #2 | 3 | 1 | $1,371 |
| Total (2 units) | $2,742 | ||
UW: 25.0% down · 7.5% · 30yr · 1.5% tax · 5.0% vac · 8.0% maint · 8.0% mgmt
Financing live
Cash to close
- Down payment
- $57,375
- Closing costs
- $6,885
- Reserves months
- —
- Total cash needed
- —
Loan-product check · same deal, 3 products live
Conventional
25% down · 7.5% · 30yr
- Down + closing
- —
- Monthly P&I
- —
- Monthly cashflow
- —
- DSCR
- —
- Eligible?
- —
Personal DTI + credit; lowest rate.
DSCR
20% down · 8.5% · 30yr
- Down + closing
- —
- Monthly P&I
- —
- Monthly cashflow
- —
- DSCR
- —
- Eligible?
- —
No personal income docs; deal must DSCR.
Hard money
10% down · 12.0% · 12mo
- Down + closing
- —
- Monthly P&I
- —
- Monthly cashflow
- —
- DSCR
- —
- Eligible?
- —
Short-term bridge; refi at stabilization.
Rent comps 1 comps
| Address | Beds | Baths | Sqft | Rent | $/sqft | DOM | Units | Dist |
|---|---|---|---|---|---|---|---|---|
| 143 W Dorrance St Kingston, PA | 5.0 | 1.5 | 2200 | $2,500 | $1.14 | 21d | 1 | 0.35mi |
Listing history 8 events
-
2026-04-22status Pending
-
2026-04-17$229,500 Active
-
2025-04-24historical $1,500
-
2025-03-31soldstatus $195,000
-
2025-03-28soldstatus $195,000 Closed 317-char remark
Show marketing remark (317 chars)
Fantastic investment or owner occupant opportunity! This multi unit home is perfect for investors or those looking to live in one unit while generating income from the other. One side is recently updated, currently vacant and move in ready! The other unit is tenant occupied on a MTM lease, renting at $1,000 a month.
-
2025-03-25$1,500
-
2025-03-12status Pending 317-char remark
Show marketing remark (317 chars)
Fantastic investment or owner occupant opportunity! This multi unit home is perfect for investors or those looking to live in one unit while generating income from the other. One side is recently updated, currently vacant and move in ready! The other unit is tenant occupied on a MTM lease, renting at $1,000 a month.
-
2025-03-04$199,000 Active 317-char remark
Show marketing remark (317 chars)
Fantastic investment or owner occupant opportunity! This multi unit home is perfect for investors or those looking to live in one unit while generating income from the other. One side is recently updated, currently vacant and move in ready! The other unit is tenant occupied on a MTM lease, renting at $1,000 a month.
ⓘ Source: listings_history table (triggers on properties + properties_extension) + one-shot
backfill from property_details.listing_events for pre-trigger history.
Tax reassessment forecast PA · Partial reset (capped growth)
- Current annual tax
- $2,380 · $198/mo
- Projected year-2 tax
- $3,003 · $250/mo
- Expected delta
- +$623/yr (+$52/mo · 26.2%)
ⓘ Screening estimate from a state-policy table — verify with the county assessor before closing.
Climate risk First Street
- Flood 9/10 Extreme FEMA zone X · 99% chance over 30 yrs
- Wildfire 3/10 Moderate
- Heat 4/10 Moderate 7 d/yr ≥97°F today · 16 d/yr by 30 yrs out
- Wind 3/10 Moderate 4% chance of damaging wind over 30 yrs
- Air quality 3/10 Moderate 2 unhealthy d/yr today · 4 by 30 yrs out
Nearby sold comps map
Loading sold comps map…
Walkable amenities ~0.75 mi
Loading nearby amenities…
Taxation est. · year 1
- Rental income
- $32,904
- − Mortgage interest
- −$12,856
- − Property taxes
- −$2,380
- − Insurance
- −$1,945
- − Repairs & maintenance
- −$2,632
- − Management
- −$2,632
- − Depreciation
- −$6,676
- Taxable income
- $3,782
- Est. tax owed @ 24.0%
- −$908
- After-tax cash flow
- $6,319/yr
For passive investors: Depreciation is non-cash, so a rental often shows a tax loss while cash-flowing — sheltering income. Rental losses are passive: they offset passive income freely, and up to $25,000/yr can offset ordinary (W-2) income if you actively participate and your MAGI is under $100k (phasing out to $0 by $150k); unused losses carry forward. On sale, claimed depreciation is recaptured at up to 25%, and gains may owe capital-gains tax (a 1031 exchange can defer both). Figures are a year-1 estimate at your 24.0% rate — not tax advice; consult a CPA.
Schools (NCES district)
- District
- Wyoming Valley West SD
- NCES district ID
- 4225950
- Math proficiency
- 18% ▼ -11.00%
- Reading proficiency
- 42% ▼ -12.00%
- Median HH income
- $42,437
- Composite
- 25.38/100
- National rank
- #7470
- State rank
- #445 of 539 in PA
Livability — Luzerne
- Score
- 76/100
- State rank
- #391
- US rank
- #3538
Category grades
Schools grade is shown separately in the Schools card above.
Census & demographics
- Census place
- Luzerne, PA
- City population
- 2,959
- Population (ZIP)
- 2,959
Population outlook (Luzerne County) Hauer SSP2
- Today (2025)
- 319,505 people
- By 2030
- 319,943 · +0.1%
- By 2040
- 322,643 · +1.0%
- By 2050
- 330,817 · +3.5%
- By 2075
- 379,145 · +18.7%
- By 2100
- 431,908 · +35.2%
Race, ethnicity, and origin ACS 2023
- Neighborhood character
- Predominantly White (89%)
- Race & ethnicity
- White 89% Two or more races 6% Black 4% Hispanic / Latino 1%
- Common ancestry
- Romanian 18% Scotch-Irish 8% Iranian 4%
- Foreign-born
- 1%
- Languages at home
- 99% English-only · Other Indo-European 1%
Political lean MEDSL · Luzerne
- 2024 margin
- R (+19.2) · D 40.0% · R 59.2%
- 2008→2024 swing
- -27.6pp toward R · 2008: 8.4pp · 2024: -19.2pp
- All cycles
- 2024: R+19.2 2020: R+14.4 2016: R+19.6 2012: D+4.8 2008: D+8.4
Not yet ingested
- Civics
- —
Market trends
- HPI YoY
- ▲ 28.54%
- Current HPI
- 254.1718
- Rent YoY
- —
- Metro
- —
- State GDP YoY
- ▲ 1.68%
- F500 in state
- 34
Industry mix (Fortune 500 HQ in PA)
| Industry | F500 HQs | Revenue |
|---|---|---|
| Healthcare | 2 | $309B |
|
||
| Insurance | 2 | $27B |
|
||
| Telecommunications / Media | 1 | $124B |
|
||
| Industrial Distribution | 1 | $22B |
|
||
| Financial Services | 1 | $20B |
|
||
| Chemicals / Materials | 1 | $18B |
|
||
Price history
+15.3% since first listed8 events — show timeline
- 2026-04-22 Pending — LCAR
- 2026-04-17 Listed $229,500 LCAR
- 2025-04-24 Rental Removed $1,500 LCAR
- 2025-03-31 Sold (Public Records) $195,000 Public Records
- 2025-03-28 Sold (MLS) $195,000 LCAR
- 2025-03-25 Listed for Rent $1,500 LCAR
- 2025-03-12 Pending — LCAR
- 2025-03-04 Listed $199,000 LCAR
Property tax history
+2.5%/yrLatest (2026): $2,380 · +0.7% YoY. Source: county tax records.
Cash-flow waterfall
monthlySold comps — $/sqft
last 12 mo · ≤1 miLoading sold comps…