14575 Bonaire Blvd #402 · Delray Beach, FL
Flood risk 4/10 · Minor
- FEMA flood zone
- X (unshaded)
- Chance of flooding over 30 yrs
- 0.2%
- Est. flood insurance / yr
- $507 – $1,088
Fire risk 1/10 · Minimal
- Est. fire insurance / yr
- $947 – $1,759
Heat risk 8/10 · Major
- Hot days now (above 107°F)
- 2 days/yr
- Hot days in 30 yrs
- 6 days/yr
Wind risk 10/10 · Severe
- Chance of severe wind over 30 yrs
- 99.0%
Air-quality risk 2/10 · Minimal
- Unhealthy air days now
- 1 days/yr
- Unhealthy air days in 30 yrs
- 2 days/yr
Risk factors via First Street. Map © Google.
Why this score? — see what drove the B+ grade
The composite is a weighted blend of 9 inputs, each scored 0–100. Each bar is that input's sub-score; the figure is the points it added to the 100-point composite (weight × sub-score).
- Cash flow +29.1/30.0
- 1% rule +10.0/10.0
- DSCR +10.0/10.0
- ARV discount +7.5/15.0
- Appreciation +5.3/10.0
- Schools +4.3/10.0
- Livability +3.9/5.0
- Rent growth +2.6/5.0
- Condition / age +2.5/5.0
$139,000
🖨 Deal sheet 📄 Offer letter ✓ Due diligence
Listing remarks
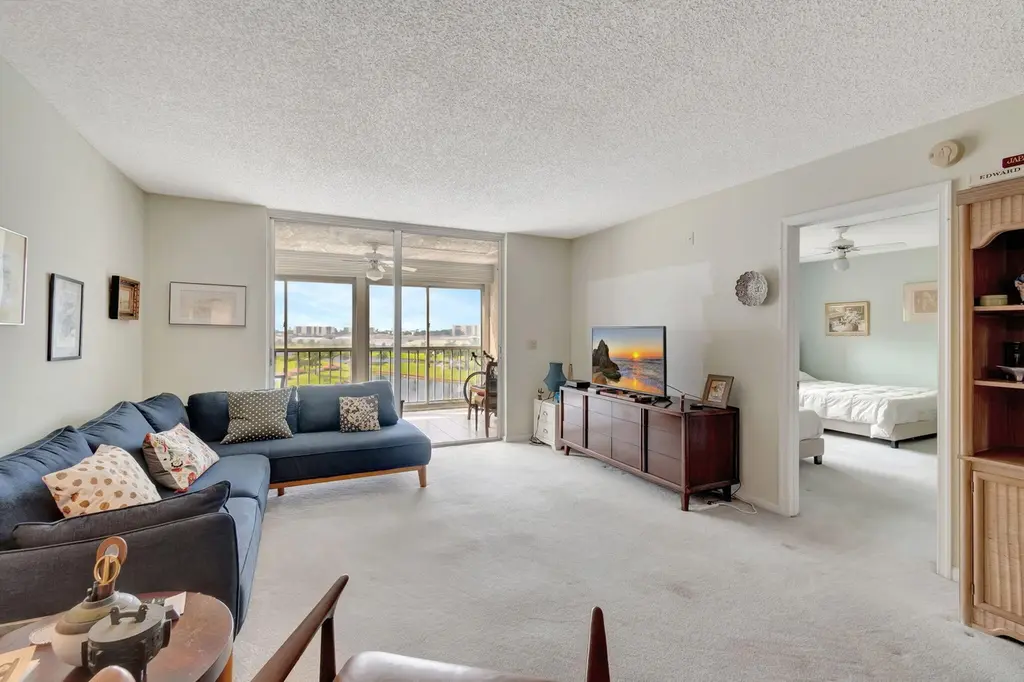
VILLAGES OF ORIOLE--ACTIVE ADULT COMMUNITY, 55+! This captivating condo, located at 14575 Bonaire Boulevard, Unit 402, Delray Beach, FL, invites you into the bustling Adult Community of the Villages of Oriole. Take notice of the enticing screened-in patio with large glass windows. These additions encourage abundant natural light indoors while still preserving the utmost security. The exceptional, panoramic, mesmerizing lake view provides an extraordinary backdrop for casual morning refreshments or cherished family gatherings. Approach the heart of this home to find a well-appointed kitchen complete with all essential appliances, including a stackable washer and dryer. This meal-preparation
Key facts
- Walk-in closet
- Panoramic lake view
- En-suite bathroom
Tags
Property features AI
Finance
- Financial info: Pets not allowed; Community contains 385 units
- HOA & community: Has association; Monthly HOA fee (paid monthly); Association amenities include pool, fitness center, clubhouse, billiard room, shuffleboard court, trails, library, management, manager on site, trash chute, street lights, and internet included; Association fee covers cable TV, water, trash, common area maintenance, elevator, reserve funds, and grounds maintenance
Exterior
- Parking: Assigned parking; Guest parking; 1 open parking space
- Utilities: Public water; Public sewer; Three-phase electric; Cable connected
- Home design: Condominium; One level; Faces south; Resale unit
- Construction: Concrete / CBS construction; Concrete perimeter foundation; Other roof; 7-story building; Building area 1,060 (public records)
- Exterior features: Covered patio; Screened patio; Patio; Glass-enclosed patio; Waterfront
Interior
- Kitchen: Dishwasher; Electric range; Microwave; Refrigerator
- Bedrooms: 2 bedrooms on the main level
- Flooring: Carpet
- Bathrooms: 2 full bathrooms on the main level
- Heating & cooling: Central electric heating; Central air conditioning; Ceiling fan(s)
- Interior features: Walk-in closets; Split bedroom layout; Blinds and drapes; Furnished (negotiable)
- Laundry & utility: Inside laundry
Neighborhood map
What this means for you Summary
Snapshot
- This is a 2-bed/2.0-bath condo listed at $139k.
Deal economics
- At list price, monthly cash flow is $480 ($6k/yr) — positive.
- The deal already cash-flows at list — no discount required.
- Meets the 1% rule at list price ($3k rent vs $139k).
- Recommended offer: $126k (9.0% below list) — sets the bar for market timing.
- Cap rate 10.4% vs local median 4.3% in Delray Beach — top-decile yield for the area; either an underpriced asset or a hidden risk that comps aren't pricing in. Stress-test before assuming the spread holds.
Location & tenants
- Location reads 77/100 on livability (#202 in FL, #3,160 nationally) — a middle-class / working-renter tenant base. Strengths: housing A+, health & safety A+, commute A-; Watch: cost of living C-, crime D-, amenities F.
- Palm Beach (suburban): math 46% / reading 53% proficiency, ranked #34 of 73 in FL (top 47%) — families likely to look elsewhere, expect single-tenant / working-renter base with shorter leases.
- Market conditions: Rents flat; 577 active listings in the ZIP; 40 comparable units currently listed for rent nearby; rentals at typical pace (median 24d on market — plan ~3-4 weeks tenant-placement turnaround); solid renter incomes; 3,974 units permitted in Palm Beach County in 2024 (1,012 in 5+ unit buildings).
- This rent runs 41% of the median local income ($80k/yr) — at the standard rent-burdened threshold; future hikes will face affordability resistance.
Forward outlook
- In year one you build about $2k of equity ($961 loan paydown + $955 appreciation (0.7% local appreciation)).
- Palm Beach County population projected at +30% by 2050 — long-run rental-demand tailwind backs the buy-and-hold thesis.
- At projected returns (0.7% appreciation + 0.5% rent growth), your $39k cash investment doubles in ~6 years — after that, you're playing with house money.
Negotiation context
- It's been on market 92 days — a 9% lower offer ($126k) is reasonable based on typical stale-listing flexibility.
- 2 sale attempts since 2y ago with the ask held roughly flat each time — persistent listings suggest the price (not the market) is what's stuck; bring a comps-based counter.
- Current owner paid $58k; list at $139k implies a 142% gain — meaningful room to come down on a strong offer.
Risks & watch-outs
- Watch-outs: HOA is 26% of rent.
- Climate carrying-cost: severe wind risk, 99% chance of damaging wind over 30y; extreme-heat days projected 2→6/yr by 2055 (HVAC capex compounding) — expect insurance premiums to compound above CPI over the hold.
Questions for the listing agent
- It's been on market 92 days. Have you received any prior offers? Is the seller open to a 9% concession, seller financing, or rate buy-down credit?
- Built in 1979 — when were the roof, HVAC, electrical panel, plumbing, and water heater last replaced?
- What does the HOA fee cover, when was the last increase, and are there any pending special assessments or reserve-fund shortfalls?
- Any open or pending special assessments — roof, HVAC, plumbing, elevator, façade? What's the per-unit balance and payoff schedule, and is the seller paying it off at close or rolling it to the buyer?
- Why hasn't it sold? Are there any deal-killer items the seller is aware of (foundation, flood, title, zoning, code violations)?
- Is there a deadline driving the sale (1031 exchange, divorce, estate, relocation)? That informs how much negotiation room exists.
- Schools are B-rated — typically a magnet for longer-tenancy family renters. What's the average tenant stay here, and is there a school-zone premium baked into asking?
- Crime grade is D in this area — have there been break-ins, vandalism, or insurance claims at this property in the last 3 years? What carrier currently insures it and at what premium?
- What's the average days-on-market for RENTAL listings here right now (not sales)? A rising rental-DOM trend means longer vacancies and softer asking-rent achievability than the comps imply.
- What's the recent tenant-quality profile in this submarket — average credit score on applications, eviction rate, late-payment / NSF rate, and stable-employment percentage? A property-management company in the area should have these aggregated.
- How much new apartment / multifamily construction is in the pipeline within 1–3 miles? Heavy new supply (>2% of stock underway) typically softens rents 12–24 months out; light construction supports rent growth.
Investment metrics
- 1% rule
- 1.99% ✓
- Cap rate
- 10.43%
- Cash-on-cash
- 14.79%
- DSCR
- 1.66
- GRM
- 4.2
CMA / ARV
No comps found within radius.
Projected returns pro-forma
0.69% appreciation · 0.51% rent growth · sell at horizon
- IRR
- 13.1%
- Equity multiple
- 1.64×
- Total profit
- $24,765
- Equity at exit
- $45,201
- IRR
- 14.6%
- Equity multiple
- 2.54×
- Total profit
- $60,037
- Equity at exit
- $58,363
Cash invested: $38,920 (down + closing). Projections, not guarantees.
Landlord ↔ Tenant lean methodology
- Overall (STATE)
- 87 Strongly Landlord-Friendly
- State Florida
- 87 Strongly Landlord-Friendly · R+3
- County
- — inherits STATE
- City
- — inherits STATE
ZIP-level market 33446
- Home prices YoY
- 0.3%
- Rents YoY
- 0.5%
- Active inventory
- 577
- Price-to-rent
- 4.2×
Monthly cashflow live
- Estimated rent
- $2,770 high interval (Pro) →
- Mortgage (P&I)
- −$729
- Tax from tax record
- −$202 /mo · $2,424/yr
- Insurance
- −$58
- HOA
- −$720
- Vacancy / Maint / Mgmt
- −$582
- Net cashflow
- $480
Break-even live
UW: 25.0% down · 7.5% · 30yr · 1.5% tax · 5.0% vac · 8.0% maint · 8.0% mgmt
Financing live
Cash to close
- Down payment
- $34,750
- Closing costs
- $4,170
- Reserves months
- —
- Total cash needed
- —
Loan-product check · same deal, 3 products live
Conventional
25% down · 7.5% · 30yr
- Down + closing
- —
- Monthly P&I
- —
- Monthly cashflow
- —
- DSCR
- —
- Eligible?
- —
Personal DTI + credit; lowest rate.
DSCR
20% down · 8.5% · 30yr
- Down + closing
- —
- Monthly P&I
- —
- Monthly cashflow
- —
- DSCR
- —
- Eligible?
- —
No personal income docs; deal must DSCR.
Hard money
10% down · 12.0% · 12mo
- Down + closing
- —
- Monthly P&I
- —
- Monthly cashflow
- —
- DSCR
- —
- Eligible?
- —
Short-term bridge; refi at stabilization.
Rent comps 40 comps
| Address | Beds | Baths | Sqft | Rent | $/sqft | DOM | Units | Dist |
|---|---|---|---|---|---|---|---|---|
| 14671 Bonaire Blvd #505 Delray Beach, FL | 1.0 | 2.0 | 925 | $1,600 | $1.73 | 24d | 1 | 0.11mi |
| 6550 Country Wood Way Delray Beach, FL | 3.0 | 2.0 | 1408 | $4,000 | $2.84 | 5d | 1 | 0.14mi |
| 6550 Country Wood Way Delray Beach, FL | 3.0 | 2.0 | 1408 | $4,000 | $2.84 | 24d | 1 | 0.14mi |
| 6557 Country Wood Way Delray Beach, FL | 3.0 | 2.0 | 1346 | $4,700 | $3.49 | 24d | 1 | 0.16mi |
| 14475 Strathmore Ln Delray Beach, FL | 2.0 | 2.0 | 1230 | $2,422 | $1.97 | 24d | 2 | 0.17mi |
| 32 Abbey Ln #207 Delray Beach, FL | 2.0 | 2.0 | 925 | $2,500 | $2.70 | 24d | 1 | 0.20mi |
| 6396 Country Wood Way Delray Beach, FL | 2.0 | 2.0 | 1364 | $3,000 | $2.20 | 24d | 1 | 0.22mi |
| 14735 Wildflower Ln Delray Beach, FL | 2.0 | 2.0 | 1073 | $2,350 | $2.19 | 2d | 1 | 0.22mi |
| 31 Abbey Ln #207 Delray Beach, FL | 2.0 | 2.0 | 925 | $1,300 | $1.41 | 24d | 1 | 0.22mi |
| 14832 Wildflower Ln Delray Beach, FL | 2.0 | 2.0 | 1073 | $2,500 | $2.33 | 17d | 1 | 0.23mi |
| 6372 Sleepy Willow Way Delray Beach, FL | 2.0 | 2.0 | 1344 | $3,975 | $2.96 | 24d | 1 | 0.24mi |
| 6372 Sleepy Willow Way Delray Beach, FL | 2.0 | 2.0 | 1344 | $3,975 | $2.96 | 15d | 1 | 0.24mi |
| 14747 Wildflower Ln Delray Beach, FL | 2.0 | 2.0 | 1229 | $2,475 | $2.01 | 24d | 1 | 0.27mi |
| 14624 Three Ponds Trl Delray Beach, FL | 3.0 | 2.0 | 1411 | $3,250 | $2.30 | 17d | 1 | 0.28mi |
| 23 Abbey Ln #208 Delray Beach, FL | 2.0 | 2.0 | 925 | $1,500 | $1.62 | 3d | 1 | 0.29mi |
| 3 Abbey Ln #102 Delray Beach, FL | 2.0 | 2.0 | 925 | $2,500 | $2.70 | 24d | 1 | 0.30mi |
| 21 Abbey Ln #107 Delray Beach, FL | 2.0 | 2.0 | 925 | $1,800 | $1.95 | 15d | 1 | 0.30mi |
| 14608 Country Side Ln Delray Beach, FL | 2.0 | 2.0 | 1303 | $2,950 | $2.26 | 24d | 1 | 0.31mi |
| 19 Abbey Ln #206 Delray Beach, FL | 2.0 | 2.0 | 925 | $1,750 | $1.89 | 24d | 1 | 0.31mi |
| 14556 Wiley Range Rd Delray Beach, FL | 2.0 | 2.0 | 1319 | $3,000 | $2.27 | 24d | 1 | 0.32mi |
| 6866 Huntington Ln #305 Delray Beach, FL | 2.0 | 2.0 | 1230 | $4,500 | $3.66 | 24d | 1 | 0.33mi |
| 20 Abbey Ln #102 Delray Beach, FL | 2.0 | 2.0 | 925 | $2,600 | $2.81 | 24d | 1 | 0.33mi |
| 14534 Highland Center Way Delray Beach, FL | 2.0 | 2.0 | 1319 | $3,400 | $2.58 | 7d | 1 | 0.37mi |
| 6813 Moonlit Dr Delray Beach, FL | 2.0 | 2.0 | 1148 | $2,150 | $1.87 | 24d | 1 | 0.38mi |
| 6795 Huntington Ln #406 Delray Beach, FL | 2.0 | 2.0 | 990 | $2,500 | $2.53 | 20d | 1 | 0.39mi |
| 7076 Huntington Ln #608 Delray Beach, FL | 2.0 | 2.0 | 1230 | $2,600 | $2.11 | 24d | 1 | 0.40mi |
| 6234 Pointe Regal Cir Delray Beach, FL | 2.0 | 2.0 | 1217 | $3,899 | $3.20 | 24d | 1 | 0.42mi |
| 10 Willowbrook Ln #105 Delray Beach, FL | 2.0 | 2.0 | 1005 | $2,100 | $2.09 | 10d | 1 | 0.42mi |
| 14800 Cumberland Dr Delray Beach, FL | 2.0 | 2.0 | 1321 | $4,048 | $3.06 | 5d | 4 | 0.43mi |
| 14 Willowbrook Ln #101 Delray Beach, FL | 2.0 | 2.0 | 1005 | $1,700 | $1.69 | 5d | 1 | 0.43mi |
| 189 Seville Ter Unit 189 Delray Beach, FL | 2.0 | 2.0 | 880 | $1,900 | $2.16 | 24d | 1 | 0.46mi |
| 14828 Golden Jax Ln Unit 8103 Delray Beach, FL | 2.0 | 2.0 | 1321 | $3,949 | $2.99 | 5d | 1 | 0.48mi |
| 14828 Golden Jax Ln Unit 6-105 Radiance Delray Beach, FL | 2.0 | 2.0 | 1321 | $4,148 | $3.14 | 16d | 1 | 0.48mi |
| 14828 Golden Jax Ln Unit 8-105 Radiance Delray Beach, FL | 2.0 | 2.0 | 1321 | $3,948 | $2.99 | 15d | 1 | 0.48mi |
| 14509 Sloan Ridge Dr Unit 10-104 Luminosa Delray Beach, FL | 3.0 | 2.0 | 1328 | $3,827 | $2.88 | 24d | 1 | 0.48mi |
| 7192 Huntington Ln #307 Delray Beach, FL | 2.0 | 2.0 | 1070 | $3,500 | $3.27 | 18d | 1 | 0.49mi |
| 28 Seville B Delray Beach, FL | 2.0 | 2.0 | 883 | $1,950 | $2.21 | 10d | 1 | 0.49mi |
| 14307 Bedford Dr #302 Delray Beach, FL | 2.0 | 2.0 | 990 | $2,200 | $2.22 | 24d | 1 | 0.49mi |
| 6096 Kings Gate Cir Delray Beach, FL | 2.0 | 2.0 | 1311 | $2,500 | $1.91 | 24d | 1 | 0.49mi |
| 14747 Cumberland Dr #301 Delray Beach, FL | 2.0 | 2.0 | 1044 | $1,900 | $1.82 | 24d | 1 | 0.51mi |
HOA detail condo
- Monthly dues
- $720 · $8,640/yr
- Likely covers
- security
- Assessments
- None detected in remarks — confirm with the listing agent.
Listing history 18 events
-
2026-06-18days on market $139,000 Active 92 DOM
-
2026-06-17days on market $139,000 Active 91 DOM
-
2026-06-16days on market $139,000 Active 90 DOM
-
2026-06-15days on market $139,000 Active 89 DOM
-
2026-06-13days on market $139,000 Active 87 DOM
-
2026-06-09days on market $139,000 Active 83 DOM
-
2026-06-08days on market $139,000 Active 82 DOM
-
2026-06-07days on market $139,000 Active 81 DOM
-
2026-06-04days on market $139,000 Active 78 DOM
-
2026-06-03days on market $139,000 Active 77 DOM
-
2026-06-02days on market $139,000 Active 76 DOM
-
2026-06-01days on market $139,000 Active 75 DOM
-
2026-05-31days on market $139,000 Active 74 DOM
-
2026-03-18$139,000 Active
-
2026-01-06historical
-
2025-06-02price $149,900
-
2024-10-31$185,000 Active
-
1992-10-13soldstatus $57,500
ⓘ Source: listings_history table (triggers on properties + properties_extension) + one-shot
backfill from property_details.listing_events for pre-trigger history.
Tax reassessment forecast FL · Resets to sale price
- Current annual tax
- $2,424 · $202/mo
- Projected year-2 tax
- $2,424 · $202/mo
- Expected delta
- $0/yr ($0/mo · 0.0%)
ⓘ Screening estimate from a state-policy table — verify with the county assessor before closing.
Climate risk First Street
- Flood 4/10 Moderate FEMA zone X (unshaded) · 20% chance over 30 yrs
- Wildfire 1/10 Low
- Heat 8/10 Severe 2 d/yr ≥107°F today · 6 d/yr by 30 yrs out
- Wind 10/10 Extreme 99% chance of damaging wind over 30 yrs
- Air quality 2/10 Low 1 unhealthy d/yr today · 2 by 30 yrs out
Nearby sold comps map
Loading sold comps map…
Walkable amenities ~0.75 mi
Loading nearby amenities…
Taxation est. · year 1
- Rental income
- $33,244
- − Mortgage interest
- −$7,786
- − Property taxes
- −$2,424
- − Insurance
- −$695
- − Repairs & maintenance
- −$2,659
- − Management
- −$2,659
- − HOA
- −$8,640
- − Depreciation
- −$4,044
- Taxable income
- $4,336
- Est. tax owed @ 24.0%
- −$1,041
- After-tax cash flow
- $4,716/yr
For passive investors: Depreciation is non-cash, so a rental often shows a tax loss while cash-flowing — sheltering income. Rental losses are passive: they offset passive income freely, and up to $25,000/yr can offset ordinary (W-2) income if you actively participate and your MAGI is under $100k (phasing out to $0 by $150k); unused losses carry forward. On sale, claimed depreciation is recaptured at up to 25%, and gains may owe capital-gains tax (a 1031 exchange can defer both). Figures are a year-1 estimate at your 24.0% rate — not tax advice; consult a CPA.
Schools (NCES district)
- District
- Palm Beach
- NCES district ID
- 1201500
- Math proficiency
- 46% ▼ -16.00%
- Reading proficiency
- 53% ▼ -4.00%
- Median HH income
- $53,943
- Composite
- 42.72/100
- National rank
- #3160
- State rank
- #34 of 73 in FL
Livability — Delray Beach
- Score
- 77/100
- State rank
- #202
- US rank
- #3160
Category grades
Schools grade is shown separately in the Schools card above.
Census & demographics
- County
- Palm Beach County · 1,438,312 people
- City population
- 123,167
- Metro
- Miami-Fort Lauderdale-Pompano Beach, FL
- Population (ZIP)
- 28,431
- Household income
- $80,187
- Rent vs Own
- Severe rent burden
- 494.0
Population outlook (Palm Beach County) Hauer SSP2
- Today (2025)
- 1,637,487 people
- By 2030
- 1,743,255 · +6.5%
- By 2040
- 1,948,712 · +19.0%
- By 2050
- 2,132,979 · +30.3%
- By 2075
- 2,530,027 · +54.5%
- By 2100
- 2,706,979 · +65.3%
Race, ethnicity, and origin ACS 2023
- Neighborhood character
- Predominantly White (79%)
- Race & ethnicity
- White 79% Hispanic / Latino 13% Two or more races 9% Black 4%
- Hispanic origin (detail)
- Puerto Rican 3% Dominican 1%
- Common ancestry
- Romanian 9% Scotch-Irish 9% Italian 2%
- Foreign-born
- 20% · Canada, Jamaica, Guatemala
- Languages at home
- 80% English-only · Spanish 12% Other Indo-European 2% French/Haitian/Cajun 2%
Political lean MEDSL · Palm Beach
- 2024 margin
- Toss-up / Even · D 50.0% · R 49.2%
- 2008→2024 swing
- -22.1pp toward R · 2008: 22.9pp · 2024: 0.8pp
- All cycles
- 2024: D+0.8 2020: D+12.8 2016: D+15.3 2012: D+17.0 2008: D+22.9
Not yet ingested
- Civics
- —
Market trends
- HPI YoY
- ▲ 0.69%
- Current HPI
- 242.5138
- Rent YoY
- ▲ 0.51%
- Metro
- Miami-Fort Lauderdale-Pompano Beach, FL
- State GDP YoY
- ▲ 3.28%
- F500 in state
- 36
Industry mix (Fortune 500 HQ in FL)
| Industry | F500 HQs | Revenue |
|---|---|---|
| Industrial Technology | 2 | $29B |
|
||
| Insurance | 2 | $17B |
|
||
| Retail | 1 | $60B |
|
||
| Technology Distribution | 1 | $58B |
|
||
| Homebuilding | 1 | $35B |
|
||
| Technology Manufacturing | 1 | $35B |
|
||
Price history
+141.7% since first listed5 events — show timeline
- 2026-03-18 Listed $139,000 Beaches MLS
- 2026-01-06 Listing Removed — Beaches MLS
- 2025-06-02 Price Changed $149,900 Beaches MLS
- 2024-10-31 Listed $185,000 Beaches MLS
- 1992-10-13 Sold (Public Records) $57,500 Public Records
Property tax history
+7.0%/yrLatest (2025): $2,424 · +3.7% YoY. Source: county tax records.
Cash-flow waterfall
monthlySold comps — $/sqft
last 12 mo · ≤1 miLoading sold comps…