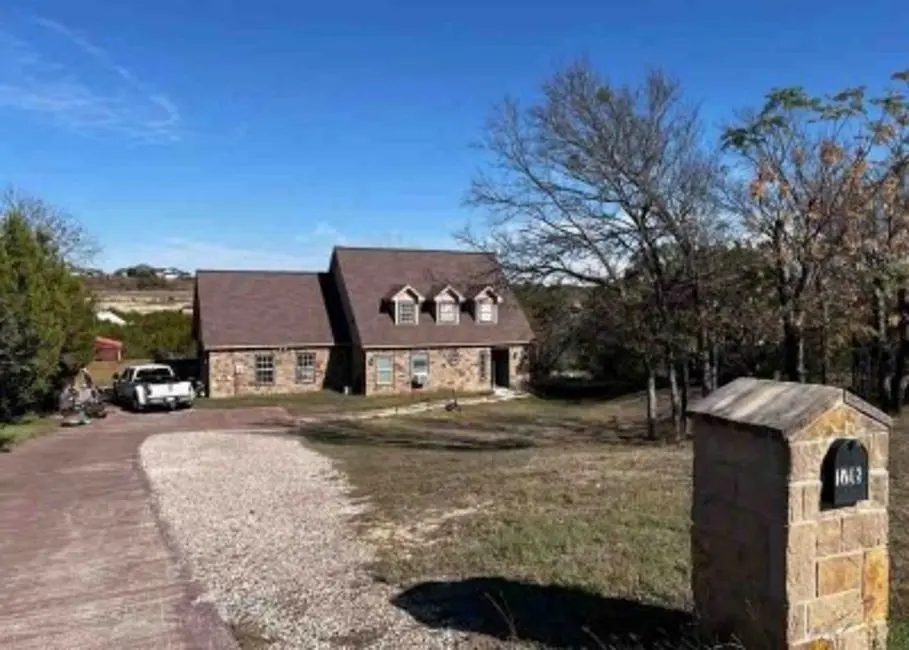
1708 Texas Dr · Glen Rose, TX
Flood risk 1/10 · Minimal
- FEMA flood zone
- X (unshaded)
- Chance of flooding over 30 yrs
- 0.0%
- Est. flood insurance / yr
- $507 – $1,088
Fire risk 3/10 · Minor
- Est. fire insurance / yr
- $1,222 – $2,270
Heat risk 7/10 · Major
- Hot days now (above 109°F)
- 7 days/yr
- Hot days in 30 yrs
- 24 days/yr
Wind risk 6/10 · Moderate
- Chance of severe wind over 30 yrs
- 27.0%
Air-quality risk 2/10 · Minimal
- Unhealthy air days now
- 1 days/yr
- Unhealthy air days in 30 yrs
- 1 days/yr
Risk factors via First Street. Map © Google.
Why this score? — see what drove the C grade
The composite is a weighted blend of 9 inputs, each scored 0–100. Each bar is that input's sub-score; the figure is the points it added to the 100-point composite (weight × sub-score).
- Cash flow +19.3/30.0
- ARV discount +15.0/15.0
- DSCR +6.1/10.0
- 1% rule +5.7/10.0
- Schools +4.6/10.0
- Livability +3.7/5.0
- Rent growth +2.5/5.0
- Condition / age +2.5/5.0
- Appreciation +0.0/10.0
$233,500
🖨 Deal sheet (PDF) 📄 Offer letter ✓ Due diligence
Listing remarks MLS
WOW! Great custom 2 story beautifully refreshed with paint, carpet and stainless steel appliances!! This home offers a large living area that opens up to a sparkling pool and a fantastic view! Master bedroom is located downstairs with 2 additional bedrooms, full bath and another huge living area upstairs. Side entry garage with lots of room for additional parking and sits on over a half acre lot!! This is a Fannie Mae Homepath property.
Key facts
- 0.66 acre lot
- 2 garage spots
- Built 2001
Property features AI
Exterior
- Parking: 2-car garage; Garage parking
- Utilities: Public water
- Home design: Residential property; Built in 2001; Slab foundation
- Construction: Brick and wood siding exterior; Composition roof
- Exterior features: Subdivision lot
Interior
- Bedrooms: First-floor bedroom (11 x 13); First-floor bedroom (10 x 12); First-floor bedroom (12 x 11)
- Bathrooms: 2 full bathrooms
- Heating & cooling: Central heating (electric); Central air conditioning (electric)
- Interior features: 3 total rooms
Neighborhood map
What this means for you Summary
Snapshot
- This is a 3-bed/2.0-bath single-family listed at $234k.
Deal economics
- At list price, monthly cash flow is $256 ($3k/yr) — positive.
- The deal already cash-flows at list — no discount required.
- Meets the 1% rule at list price ($2k rent vs $234k).
- Recommended offer: $230k (1.5% below list) — sets the bar for market timing.
- Cap rate 7.6% vs local median 2.9% in Glen Rose — top-decile yield for the area; either an underpriced asset or a hidden risk that comps aren't pricing in. Stress-test before assuming the spread holds.
Location & tenants
- Location reads 73/100 on livability (#231 in TX) — a middle-class / working-renter tenant base. Strengths: crime A+, cost of living A+, housing A+; Watch: health & safety D+, amenities F, commute F.
- Glen Rose ISD (rural): math 51% / reading 56% proficiency, ranked #126 of 826 in TX (top 15%) — acceptable for families but not a draw, mixed tenant base, ~2y average lease.
- Zoned schools: Glen Rose El (476 students, 52% FRL); Glen Rose J H School (math 44% / reading 49%, grade D+, #443 of 1,662 statewide, top 28%, 463 students, 41% FRL); Glen Rose H S (math 57% / reading 67%, grade B-, #237 of 1,632 statewide, top 16%, 587 students, 34% FRL) — zoned schools at 42% FRL track the district average.
- Market conditions: 150 active listings in the ZIP; 2 comparable units currently listed for rent nearby; 43 units permitted in Somervell County in 2024 (10 in 5+ unit buildings).
Forward outlook
- Local home prices are declining (-3.0%/yr); year-one equity from $2k of loan paydown is wiped out by about $7k of value loss. Plan a longer hold.
- Somervell County population projected at +7% by 2050 — modest demand growth; plan on rents tracking national, not racing it.
Negotiation context
- It's been on market 29 days — a 2% lower offer ($230k) is reasonable based on typical stale-listing flexibility.
- 10 sale attempts since 19y ago with the ask held roughly flat each time — persistent listings suggest the price (not the market) is what's stuck; bring a comps-based counter.
Risks & watch-outs
- Climate carrying-cost: major wind risk, 27% chance of damaging wind over 30y; extreme-heat days projected 7→24/yr by 2055 (HVAC capex compounding) — expect insurance premiums to compound above CPI over the hold.
Questions for the listing agent
- Is there a deadline driving the sale (1031 exchange, divorce, estate, relocation)? That informs how much negotiation room exists.
- What's the average days-on-market for RENTAL listings here right now (not sales)? A rising rental-DOM trend means longer vacancies and softer asking-rent achievability than the comps imply.
- What's the recent tenant-quality profile in this submarket — average credit score on applications, eviction rate, late-payment / NSF rate, and stable-employment percentage? A property-management company in the area should have these aggregated.
- How much new for-sale + rental construction is in the pipeline within 1–3 miles? Heavy new supply typically softens prices + rents 12–24 months out; constrained supply supports both.
Investment metrics
- 1% rule
- 1.07% ✓
- Cap rate
- 7.61%
- Cash-on-cash
- 4.69%
- DSCR
- 1.21
- GRM
- 7.8
CMA / ARV
- ARV (on-the-fly)
- $426,570
- Comps found
- 12
Show comp detail 12 sales within ~0.75 mi
| Address | Dist | Beds/Ba | Sqft | Sold | Price | $/sf | Match |
|---|---|---|---|---|---|---|---|
| 1708 Texas Dr | 0.00mi | 3/2.0 | 2,410 (0%) | 1mo | $233,500 | $97 | 100 |
| 100 Mesa Dr | 0.30mi | 4/2.0 (+1) | 2,435 (+1%) | 6mo | $392,000 | $161 | 74 |
| 168 Valley Vw | 0.51mi | 3/2.0 | 2,431 (+1%) | 1mo | $415,000 | $171 | 74 |
| 144 Valley Vw | 0.62mi | 3/2.0 | 2,340 (-3%) | 1mo | $525,000 | $224 | 66 |
| 124 Mesa Dr | 0.16mi | 3/2.0 | 2,049 (-15%) | 7mo | $355,000 | $173 | 62 |
| 125 Camelot St | 0.30mi | 3/2.0 | 2,048 (-15%) | 1mo | $379,000 | $185 | 60 |
| 102 Skyline Dr | 0.49mi | 3/2.0 | 2,190 (-9%) | 2mo | $440,000 | $201 | 60 |
| 119 Mesa Dr | 0.17mi | 4/2.0 (+1) | 2,078 (-14%) | 7mo | $356,028 | $171 | 58 |
| 137 Mesa Dr | 0.14mi | 4/2.0 (+1) | 2,078 (-14%) | 9mo | $367,990 | $177 | 58 |
| 113 King Arthur Ct | 0.30mi | 4/2.0 (+1) | 2,075 (-14%) | 3mo | $360,000 | $173 | 55 |
| 106 Skyline Dr | 0.52mi | 3/2.0 | 2,100 (-13%) | 9mo | $435,000 | $207 | 47 |
| 1111 College Ave | 0.74mi | 4/3.5 (+1) | 2,368 (-2%) | 8mo | $495,000 | $209 | 46 |
Match score weights: distance 35% · size 25% · config 20% · recency 20%. Top-matched comps best support the ARV.
Projected returns pro-forma
-3.0% appreciation · 3.0% rent growth · sell at horizon
- IRR
- -8.9%
- Equity multiple
- 0.67×
- Total profit
- $-21,453
- Equity at exit
- $34,816
- IRR
- 0.6%
- Equity multiple
- 1.04×
- Total profit
- $2,700
- Equity at exit
- $20,189
Cash invested: $65,380 (down + closing). Projections, not guarantees.
Landlord ↔ Tenant lean methodology
- Overall (STATE)
- 87 Strongly Landlord-Friendly
- State Texas
- 87 Strongly Landlord-Friendly · R+5
- County
- — inherits STATE
- City
- — inherits STATE
ZIP-level market 76043
- Home prices YoY
- -24.2%
- Active inventory
- 150
- Price-to-rent
- 7.8×
Monthly cashflow live
- Estimated rent
- $2,499 medium interval (Pro) →
- Mortgage (P&I)
- −$1,224
- Tax from tax record
- −$397 /mo · $4,762/yr
- Insurance
- −$97
- HOA
- −$0
- Vacancy / Maint / Mgmt
- −$525
- Net cashflow
- $256
Break-even live
Sensitivity live
| Price | -10% $388 | -5% $322 | +0% $256 | +5% $190 | +10% $123 |
|---|---|---|---|---|---|
| Rent | -10% $58 | -5% $157 | +0% $256 | +5% $354 | +10% $453 |
| Rate | -1.0pp $373 | -0.5pp $315 | base $256 | +0.5pp $195 | +1.0pp $134 |
UW: 25.0% down · 7.5% · 30yr · 1.5% tax · 5.0% vac · 8.0% maint · 8.0% mgmt
Financing live
Cash to close
- Down payment
- $58,375
- Closing costs
- $7,005
- Reserves months
- —
- Total cash needed
- —
Loan-product check · same deal, 3 products live
Conventional
25% down · 7.5% · 30yr
- Down + closing
- —
- Monthly P&I
- —
- Monthly cashflow
- —
- DSCR
- —
- Eligible?
- —
Personal DTI + credit; lowest rate.
DSCR
20% down · 8.5% · 30yr
- Down + closing
- —
- Monthly P&I
- —
- Monthly cashflow
- —
- DSCR
- —
- Eligible?
- —
No personal income docs; deal must DSCR.
Hard money
10% down · 12.0% · 12mo
- Down + closing
- —
- Monthly P&I
- —
- Monthly cashflow
- —
- DSCR
- —
- Eligible?
- —
Short-term bridge; refi at stabilization.
Rent comps 2 comps
| Address | Beds | Baths | Sqft | Rent | $/sqft | DOM | Units | Dist |
|---|---|---|---|---|---|---|---|---|
| 101 Mesa Dr Glen Rose, TX | 4.0 | 2.0 | 2076 | $2,545 | $1.23 | 45d | 1 | 0.30mi |
| 1043 County Road 327 Glen Rose, TX | 3.0 | 2.0 | 1900 | $2,300 | $1.21 | 45d | 1 | 1.17mi |
Listing history 37 events
-
2026-04-29status Pending
-
2026-03-31$233,500 Active
-
2019-01-07soldstatus Sold 442-char remark
Show marketing remark (442 chars)
WOW! Great custom 2 story beautifully refreshed with paint, carpet and stainless steel appliances!! This home offers a large living area that opens up to a sparkling pool and a fantastic view! Master bedroom is located downstairs with 2 additional bedrooms, full bath and another huge living area upstairs. Side entry garage with lots of room for additional parking and sits on over a half acre lot!! This is a Fannie Mae Homepath property.
-
2018-12-06status Pending 442-char remark
Show marketing remark (442 chars)
WOW! Great custom 2 story beautifully refreshed with paint, carpet and stainless steel appliances!! This home offers a large living area that opens up to a sparkling pool and a fantastic view! Master bedroom is located downstairs with 2 additional bedrooms, full bath and another huge living area upstairs. Side entry garage with lots of room for additional parking and sits on over a half acre lot!! This is a Fannie Mae Homepath property.
-
2018-11-21price $235,000 442-char remark
Show marketing remark (442 chars)
WOW! Great custom 2 story beautifully refreshed with paint, carpet and stainless steel appliances!! This home offers a large living area that opens up to a sparkling pool and a fantastic view! Master bedroom is located downstairs with 2 additional bedrooms, full bath and another huge living area upstairs. Side entry garage with lots of room for additional parking and sits on over a half acre lot!! This is a Fannie Mae Homepath property.
-
2018-11-17$243,900 Active 442-char remark
Show marketing remark (442 chars)
WOW! Great custom 2 story beautifully refreshed with paint, carpet and stainless steel appliances!! This home offers a large living area that opens up to a sparkling pool and a fantastic view! Master bedroom is located downstairs with 2 additional bedrooms, full bath and another huge living area upstairs. Side entry garage with lots of room for additional parking and sits on over a half acre lot!! This is a Fannie Mae Homepath property.
-
2018-11-14historical
-
2018-10-22price $243,900
-
2018-09-28status Active
-
2018-09-22status Pending
-
2018-09-10historical Active Option Contract
-
2018-08-29$249,500 Active
-
2018-02-22historical
-
2018-02-14price $219,000
-
2018-02-01price $229,000
-
2018-01-20status Active
-
2017-12-08historical
-
2017-11-02$239,000 Active
-
2015-12-28soldstatus
-
2015-12-28soldstatus
-
2015-12-18soldstatus Sold
-
2015-11-30status Pending
-
2015-11-04historical Active Contingent
-
2015-10-15price $239,900
-
2015-09-24$244,500 Active
-
2015-09-11historical
-
2015-06-12$244,500 Active
-
2015-06-05historical
-
2015-04-13price $250,425
-
2015-03-14$263,000 Active
-
2008-04-22soldstatus
-
2008-04-18soldstatus
-
2008-03-04historical
-
2007-05-18$189,900
-
2001-05-01soldstatus
-
2000-03-27soldstatus
-
1997-06-16soldstatus
ⓘ Source: listings_history table (triggers on properties + properties_extension) + one-shot
backfill from property_details.listing_events for pre-trigger history.
Tax reassessment forecast TX · Resets to sale price
- Current annual tax
- $4,762 · $397/mo
- Projected year-2 tax
- $4,762 · $397/mo
- Expected delta
- $0/yr ($0/mo · 0.0%)
ⓘ Screening estimate from a state-policy table — verify with the county assessor before closing.
Climate risk First Street
- Flood 1/10 Low FEMA zone X (unshaded) · 0% chance over 30 yrs
- Wildfire 3/10 Moderate
- Heat 7/10 Severe 7 d/yr ≥109°F today · 24 d/yr by 30 yrs out
- Wind 6/10 Major 27% chance of damaging wind over 30 yrs
- Air quality 2/10 Low 1 unhealthy d/yr today · 1 by 30 yrs out
Nearby sold comps map
Loading sold comps map…
Walkable amenities ~0.75 mi
Loading nearby amenities…
Taxation est. · year 1
- Rental income
- $29,989
- − Mortgage interest
- −$13,080
- − Property taxes
- −$4,762
- − Insurance
- −$1,168
- − Repairs & maintenance
- −$2,399
- − Management
- −$2,399
- − Depreciation
- −$6,793
- Taxable loss
- −$611
- Est. tax savings @ 24.0%
- +$147
- After-tax cash flow
- $3,214/yr
For passive investors: Depreciation is non-cash, so a rental often shows a tax loss while cash-flowing — sheltering income. Rental losses are passive: they offset passive income freely, and up to $25,000/yr can offset ordinary (W-2) income if you actively participate and your MAGI is under $100k (phasing out to $0 by $150k); unused losses carry forward. On sale, claimed depreciation is recaptured at up to 25%, and gains may owe capital-gains tax (a 1031 exchange can defer both). Figures are a year-1 estimate at your 24.0% rate — not tax advice; consult a CPA.
Schools (NCES district)
- District
- Glen Rose ISD
- NCES district ID
- 4820850
- Math proficiency
- 51% ▼ -7.00%
- Reading proficiency
- 56% ▼ -3.00%
- Median HH income
- $51,084
- Composite
- 45.78/100
- National rank
- #2565
- State rank
- #126 of 826 in TX
Livability — Glen Rose
- Score
- 73/100
- State rank
- #231
- US rank
- #5572
Category grades
Schools grade is shown separately in the Schools card above.
Census & demographics
- Census place
- Glen Rose, TX
- Population (ZIP)
- 7,286
Population outlook (Somervell County) Hauer SSP2
- Today (2025)
- 9,445 people
- By 2030
- 9,716 · +2.9%
- By 2040
- 10,069 · +6.6%
- By 2050
- 10,145 · +7.4%
- By 2075
- 10,111 · +7.1%
- By 2100
- 9,202 · -2.6%
Race, ethnicity, and origin ACS 2023
- Neighborhood character
- Predominantly White (72%)
- Race & ethnicity
- White 72% Hispanic / Latino 23% Two or more races 13% Black 2%
- Hispanic origin (detail)
- Mexican 22%
- Common ancestry
- Slovak 3% Lithuanian 1% Romanian 1%
- Foreign-born
- 10% · Canada
- Languages at home
- 81% English-only · Spanish 19%
Political lean MEDSL · Somervell
- 2024 margin
- Solid R (+70.8) · D 14.2% · R 85.0%
- 2008→2024 swing
- -17.6pp toward R · 2008: -53.1pp · 2024: -70.8pp
- All cycles
- 2024: R+70.8 2020: R+67.5 2016: R+68.8 2012: R+64.1 2008: R+53.1
Not yet ingested
- Civics
- —
Market trends
- HPI YoY
- ▼ -65.10%
- Current HPI
- 203.3924
- Rent YoY
- —
- Metro
- —
- State GDP YoY
- ▲ 3.95%
- F500 in state
- 110
Industry mix (Fortune 500 HQ in TX)
| Industry | F500 HQs | Revenue |
|---|---|---|
| Energy | 16 | $1,198B |
|
||
| Technology | 5 | $198B |
|
||
| Engineering / Construction | 4 | $72B |
|
||
| Energy Services | 3 | $60B |
|
||
| Utilities | 3 | $41B |
|
||
| Healthcare | 2 | $330B |
|
||
Price history
+23.0% since first listed37 events — show timeline
- 2026-04-29 Pending — HARMLS
- 2026-03-31 Listed $233,500 HARMLS
- 2019-01-07 Sold (MLS) — NTREIS
- 2018-12-06 Pending — NTREIS
- 2018-11-21 Price Changed $235,000 NTREIS
- 2018-11-17 Listed $243,900 NTREIS
- 2018-11-14 Listing Removed — NTREIS
- 2018-10-22 Price Changed $243,900 NTREIS
- 2018-09-28 Relisted — NTREIS
- 2018-09-22 Pending — NTREIS
- 2018-09-10 Contingent — NTREIS
- 2018-08-29 Listed $249,500 NTREIS
- 2018-02-22 Listing Removed — NTREIS
- 2018-02-14 Price Changed $219,000 NTREIS
- 2018-02-01 Price Changed $229,000 NTREIS
- 2018-01-20 Relisted — NTREIS
- 2017-12-08 Listing Removed — NTREIS
- 2017-11-02 Listed $239,000 NTREIS
- 2015-12-28 Sold (Public Records) — Public Records
- 2015-12-28 Sold (Public Records) — Public Records
- 2015-12-18 Sold (MLS) — NTREIS
- 2015-11-30 Pending — NTREIS
- 2015-11-04 Contingent — NTREIS
- 2015-10-15 Price Changed $239,900 NTREIS
- 2015-09-24 Listed $244,500 NTREIS
- 2015-09-11 Listing Removed — NTREIS
- 2015-06-12 Listed $244,500 NTREIS
- 2015-06-05 Listing Removed — NTREIS
- 2015-04-13 Price Changed $250,425 NTREIS
- 2015-03-14 Listed $263,000 NTREIS
- 2008-04-22 Sold (Public Records) — Public Records
- 2008-04-18 Sold (MLS) — NTREIS
- 2008-03-04 Listing Removed — NTREIS
- 2007-05-18 Listed $189,900 NTREIS
- 2001-05-01 Sold (Public Records) — Public Records
- 2000-03-27 Sold (Public Records) — Public Records
- 1997-06-16 Sold (Public Records) — Public Records
Property tax history
+2.6%/yrLatest (2025): $4,762 · -1.9% YoY. Source: county tax records.
Cash-flow waterfall
monthlySold comps — $/sqft
last 12 mo · ≤1 miLoading sold comps…