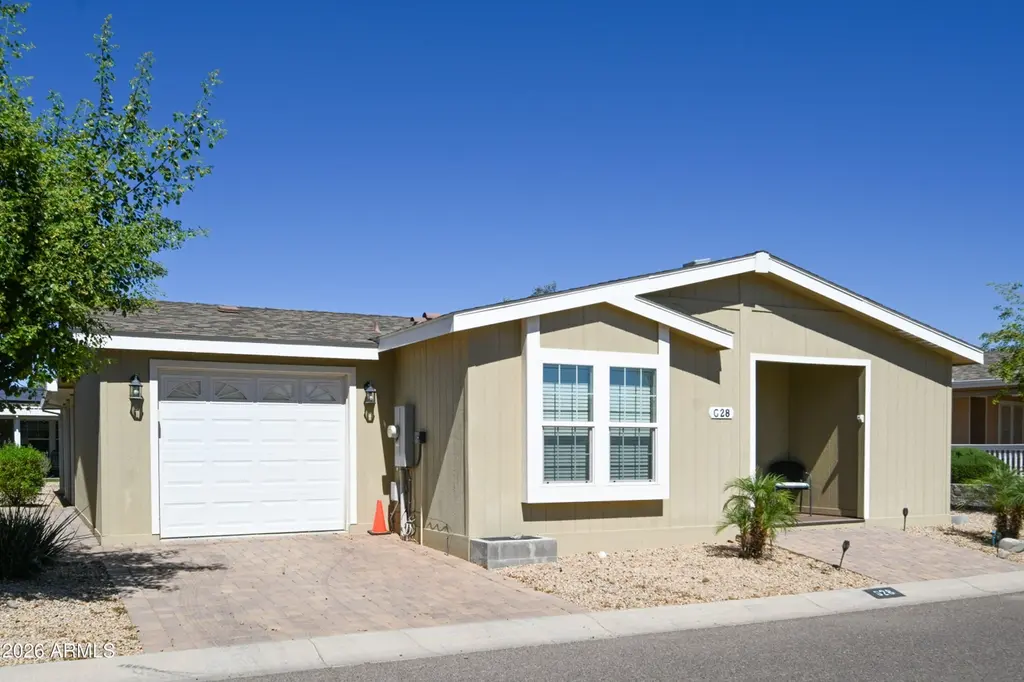
11201 N El Mirage Rd Unit G28 · El Mirage, AZ
Flood risk No data
- FEMA flood zone
- —
- Chance of flooding over 30 yrs
- —
- Est. flood insurance / yr
- —
Fire risk No data
- Est. fire insurance / yr
- —
Heat risk No data
- Hot days now (above threshold)
- —
- Hot days in 30 yrs
- —
Wind risk No data
- Chance of severe wind over 30 yrs
- —
Air-quality risk No data
- Unhealthy air days now
- —
- Unhealthy air days in 30 yrs
- —
Risk factors via First Street. Map © Google.
Why this score? — see what drove the C- grade
The composite is a weighted blend of 9 inputs, each scored 0–100. Each bar is that input's sub-score; the figure is the points it added to the 100-point composite (weight × sub-score).
- Cash flow +17.3/30.0
- ARV discount +12.2/15.0
- DSCR +5.4/10.0
- 1% rule +4.7/10.0
- Schools +3.3/10.0
- Livability +3.2/5.0
- Rent growth +2.5/5.0
- Condition / age +2.5/5.0
- Appreciation +0.0/10.0
$179,000
🖨 Deal sheet 📄 Offer letter ✓ Due diligence
Listing remarks MLS
ON LEASED LAND: Step inside this absolutely stunning 2 bedroom 2 bath 2020 Cavco home. Barely lived in. Fully furnished!! Just bring your personal items. Spacious open kitchen opens to the front room, perfect for entertaining. Large Covered patio for morning beverage or entertaining. Plus a 1 car garage. Home is located in the Greens. Pueblo El Mirage offers many amenities, such as an 18-hole championship golf course, 26 pickleball courts, tennis courts, dog parks, heated pool, lawn bowling, billiards room, workshops, onsite post office and more!
Key facts
- Dog parks
- Pickleball courts
- Tennis courts
Tags
Neighborhood map
What this means for you Summary
Snapshot
- This is a 2-bed/2.0-bath land listed at $179k.
Deal economics
- At list price, monthly cash flow is $130 ($2k/yr) — positive.
- The deal already cash-flows at list — no discount required.
- To meet the 1% rule (rent ≥ 1% of price), the offer needs to be $173k (3.4% below list).
- Recommended offer: $163k (9.0% below list) — sets the bar for market timing.
- Cap rate 7.2% vs local median 4.5% in El Mirage — top-decile yield for the area; either an underpriced asset or a hidden risk that comps aren't pricing in. Stress-test before assuming the spread holds.
Location & tenants
- Location reads 63/100 on livability (#112 in AZ) — a middle-class / working-renter tenant base. Strengths: housing A+, cost of living A; Watch: schools D-, amenities F, commute F.
- Dysart Unified District (4243) (suburban): math 34% / reading 40% proficiency, ranked #73 of 249 in AZ (top 29%) — families likely to look elsewhere, expect single-tenant / working-renter base with shorter leases.
- Market conditions: Rents flat; 132 active listings in the ZIP; 40 comparable units currently listed for rent nearby; rentals at typical pace (median 18d on market — plan ~3-4 weeks tenant-placement turnaround); solid renter incomes; 36,011 units permitted in Maricopa County in 2024 (12,801 in 5+ unit buildings).
Forward outlook
- Local home prices are declining (-3.0%/yr); year-one equity from $1k of loan paydown is wiped out by about $5k of value loss. Plan a longer hold.
- Maricopa County population projected at +38% by 2050 — long-run rental-demand tailwind backs the buy-and-hold thesis.
Negotiation context
- It's been on market 91 days — a 9% lower offer ($163k) is reasonable based on typical stale-listing flexibility.
Questions for the listing agent
- It's been on market 91 days. Have you received any prior offers? Is the seller open to a 9% concession, seller financing, or rate buy-down credit?
- Why hasn't it sold? Are there any deal-killer items the seller is aware of (foundation, flood, title, zoning, code violations)?
- Is there a deadline driving the sale (1031 exchange, divorce, estate, relocation)? That informs how much negotiation room exists.
- Schools are D-rated, which usually means shorter tenancies and higher turnover. Who's the typical renter profile here, and what's been the actual vacancy rate?
- What's the average days-on-market for RENTAL listings here right now (not sales)? A rising rental-DOM trend means longer vacancies and softer asking-rent achievability than the comps imply.
- What's the recent tenant-quality profile in this submarket — average credit score on applications, eviction rate, late-payment / NSF rate, and stable-employment percentage? A property-management company in the area should have these aggregated.
- How much new for-sale + rental construction is in the pipeline within 1–3 miles? Heavy new supply typically softens prices + rents 12–24 months out; constrained supply supports both.
Investment metrics
- 1% rule
- 0.97% ✗
- Cap rate
- 7.16%
- Cash-on-cash
- 3.10%
- DSCR
- 1.14
- GRM
- 8.6
CMA / ARV
- ARV (median comp)
- $199,999
- List price
- $179,000
- Delta
- -10.50%
- Verdict
- UNDERPRICED
- Comps
- 7 within 1.0 mi
Projected returns pro-forma
-3.0% appreciation · 0.08% rent growth · sell at horizon
- IRR
- -14.7%
- Equity multiple
- 0.49×
- Total profit
- $-25,667
- Equity at exit
- $26,689
- IRR
- -11.9%
- Equity multiple
- 0.39×
- Total profit
- $-30,734
- Equity at exit
- $15,477
Cash invested: $50,120 (down + closing). Projections, not guarantees.
Landlord ↔ Tenant lean methodology
- Overall (STATE)
- 87 Strongly Landlord-Friendly
- State Arizona
- 87 Strongly Landlord-Friendly · R+3
- County
- — inherits STATE
- City
- — inherits STATE
ZIP-level market 85335
- Home prices YoY
- -13.3%
- Rents YoY
- 0.1%
- Active inventory
- 132
- Price-to-rent
- 8.6×
Monthly cashflow live
- Estimated rent
- $1,730 high interval (Pro) →
- Mortgage (P&I)
- −$939
- Tax est. 1.5%
- −$224 /mo · $2,685/yr
- Insurance
- −$75
- HOA
- −$0
- Vacancy / Maint / Mgmt
- −$363
- Net cashflow
- $130
Break-even live
UW: 25.0% down · 7.5% · 30yr · 1.5% tax · 5.0% vac · 8.0% maint · 8.0% mgmt
Financing live
Cash to close
- Down payment
- $44,750
- Closing costs
- $5,370
- Reserves months
- —
- Total cash needed
- —
Loan-product check · same deal, 3 products live
Conventional
25% down · 7.5% · 30yr
- Down + closing
- —
- Monthly P&I
- —
- Monthly cashflow
- —
- DSCR
- —
- Eligible?
- —
Personal DTI + credit; lowest rate.
DSCR
20% down · 8.5% · 30yr
- Down + closing
- —
- Monthly P&I
- —
- Monthly cashflow
- —
- DSCR
- —
- Eligible?
- —
No personal income docs; deal must DSCR.
Hard money
10% down · 12.0% · 12mo
- Down + closing
- —
- Monthly P&I
- —
- Monthly cashflow
- —
- DSCR
- —
- Eligible?
- —
Short-term bridge; refi at stabilization.
Rent comps 40 comps
| Address | Beds | Baths | Sqft | Rent | $/sqft | DOM | Units | Dist |
|---|---|---|---|---|---|---|---|---|
| 11825 W Altadena Ave El Mirage, AZ | 3.0 | 2.0 | 1090 | $1,710 | $1.57 | 12d | 1 | 0.47mi |
| 11714 W Poinsettia Dr El Mirage, AZ | 3.0 | 2.0 | 1238 | $1,695 | $1.37 | 43d | 1 | 0.60mi |
| 11801 W Paradise Dr El Mirage, AZ | 3.0 | 2.0 | 1238 | $1,700 | $1.37 | 24d | 1 | 0.62mi |
| 12621 W Cherry Hills Dr El Mirage, AZ | 3.0 | 2.0 | 1238 | $1,725 | $1.39 | 24d | 1 | 0.64mi |
| 11922 N Olive St El Mirage, AZ | 3.0 | 2.0 | 1090 | $1,695 | $1.56 | 4d | 1 | 0.70mi |
| 11934 N Olive St El Mirage, AZ | 3.0 | 2.0 | 1238 | $1,669 | $1.35 | 5d | 1 | 0.72mi |
| 12701 W Cherry Hills Dr El Mirage, AZ | 3.0 | 2.0 | 1090 | $1,675 | $1.54 | 24d | 1 | 0.73mi |
| 12563 W Charter Oak Rd El Mirage, AZ | 3.0 | 2.0 | 1358 | $1,749 | $1.29 | 24d | 1 | 0.74mi |
| 12137 W Flores Dr El Mirage, AZ | 3.0 | 2.0 | 1238 | $1,785 | $1.44 | 12d | 1 | 0.77mi |
| 11620 W Peoria Ave Youngtown, AZ | 1.0–4.0 | 1.0–2.0 | 992 | $1,495 | $1.51 | 5d | 1 | 0.77mi |
| 12649 W Shaw Butte Dr El Mirage, AZ | 3.0 | 2.0 | 1238 | $1,755 | $1.42 | 4d | 1 | 0.78mi |
| 11518 W Paradise Dr El Mirage, AZ | 3.0 | 2.0 | 1238 | $1,750 | $1.41 | 24d | 1 | 0.79mi |
| 12005 W Scotts Dr El Mirage, AZ | 3.0 | 2.0 | 1089 | $1,810 | $1.66 | 2d | 1 | 0.80mi |
| 12220 W Rosewood Dr El Mirage, AZ | 3.0 | 2.0 | 1090 | $1,665 | $1.53 | 24d | 1 | 0.85mi |
| 12519 N Pablo St El Mirage, AZ | 3.0 | 2.0 | 1225 | $1,720 | $1.40 | 43d | 1 | 0.90mi |
| 12648 N Main St El Mirage, AZ | 3.0 | 2.0 | 1296 | $1,699 | $1.31 | 1d | 1 | 0.94mi |
| 10595 N 115th Dr Youngtown, AZ | 3.0 | 2.0 | 1424 | $1,794 | $1.26 | 17d | 1 | 0.94mi |
| 12012 W Rosewood Dr El Mirage, AZ | 3.0 | 2.5 | 1385 | $1,595 | $1.15 | 5d | 1 | 0.94mi |
| 11517 W Charter Oak Rd El Mirage, AZ | 3.0 | 2.0 | 1296 | $1,885 | $1.45 | 24d | 1 | 0.95mi |
| 11517 W Charter Oak Rd El Mirage, AZ | 3.0 | 2.0 | 1296 | $1,755 | $1.35 | 14d | 1 | 0.95mi |
| 12418 W Windrose Dr El Mirage, AZ | 3.0 | 2.0 | 1106 | $1,650 | $1.49 | 24d | 1 | 1.02mi |
| 12071 W Dahlia Dr El Mirage, AZ | 3.0 | 2.0 | 1089 | $1,595 | $1.46 | 18d | 1 | 1.06mi |
| 12112 W Dahlia Dr El Mirage, AZ | 3.0 | 2.5 | 1385 | $1,690 | $1.22 | 43d | 1 | 1.07mi |
| 11327 W Kansas Ave Youngtown, AZ | 3.0 | 2.0 | 1042 | $1,725 | $1.66 | 4d | 1 | 1.07mi |
| 12060 W Dahlia Dr El Mirage, AZ | 3.0 | 2.0 | 1238 | $1,595 | $1.29 | 3d | 1 | 1.10mi |
| 11356 N 113th Ave Youngtown, AZ | 2.0 | 1.0 | 800 | $1,450 | $1.81 | 43d | 1 | 1.10mi |
| 11356 N 113th Ave Youngtown, AZ | 2.0 | 1.0 | 800 | $1,450 | $1.81 | 5d | 1 | 1.10mi |
| 11807 W Aster Dr El Mirage, AZ | 2.0 | 1.0 | 1208 | $1,419 | $1.17 | 14d | 1 | 1.13mi |
| 11807 W Aster Dr El Mirage, AZ | 2.0 | 1.0 | 1208 | $1,529 | $1.27 | 43d | 1 | 1.13mi |
| 12521 W Myer Ln El Mirage, AZ | 3.0 | 2.0 | 1410 | $1,700 | $1.21 | 43d | 1 | 1.25mi |
| 11634 W Vogel Ave Youngtown, AZ | 3.0 | 2.0 | 1424 | $1,939 | $1.36 | 21d | 1 | 1.25mi |
| 11634 W Vogel Ave Youngtown, AZ | 3.0 | 2.0 | 1424 | $1,799 | $1.26 | 5d | 1 | 1.25mi |
| 11485 W Camden Dr Youngtown, AZ | 3.0 | 2.0 | 1174 | $1,775 | $1.51 | 5d | 1 | 1.31mi |
| 12913 W Corrine Dr El Mirage, AZ | 3.0 | 2.0 | 1245 | $1,745 | $1.40 | 5d | 1 | 1.31mi |
| 12914 W Rosewood Dr El Mirage, AZ | 3.0 | 2.0 | 1407 | $1,940 | $1.38 | 20d | 1 | 1.32mi |
| 12910 W Corrine Dr El Mirage, AZ | 3.0 | 2.0 | 1407 | $1,900 | $1.35 | 10d | 1 | 1.33mi |
| 12440 N 113th Ave Youngtown, AZ | 1.0–3.0 | 1.0–2.0 | 927 | $1,535 | $1.66 | 5d | 2 | 1.34mi |
| 11216 W Nevada Ave Youngtown, AZ | 2.0 | 1.0 | 810 | $1,300 | $1.60 | 5d | 1 | 1.37mi |
| 11202 W Nevada Ave Youngtown, AZ | 2.0 | 1.0 | 810 | $1,325 | $1.64 | 24d | 1 | 1.40mi |
| 11202 W Nevada Ave Youngtown, AZ | 2.0 | 1.0 | 810 | $1,375 | $1.70 | 43d | 1 | 1.40mi |
Listing history 14 events
-
2026-06-18days on market $179,000 Active 91 DOM
-
2026-06-17days on market $179,000 Active 90 DOM
-
2026-06-16days on market $179,000 Active 89 DOM
-
2026-06-15days on market $179,000 Active 88 DOM
-
2026-06-13days on market $179,000 Active 86 DOM
-
2026-06-09days on market $179,000 Active 82 DOM
-
2026-06-08days on market $179,000 Active 81 DOM
-
2026-06-07days on market $179,000 Active 80 DOM
-
2026-06-04days on market $179,000 Active 77 DOM
-
2026-06-03days on market $179,000 Active 76 DOM
-
2026-06-02days on market $179,000 Active 75 DOM
-
2026-06-01days on market $179,000 Active 74 DOM
-
2026-05-31days on market $179,000 Active 73 DOM
-
2026-03-19$179,000 Active 566-char remark
Show marketing remark (566 chars)
ON LEASED LAND: Step inside this absolutely stunning 2 bedroom 2 bath 2020 Cavco home. Barely lived in. Fully furnished!! Just bring your personal items. Spacious open kitchen opens to the front room, perfect for entertaining. Large Covered patio for morning beverage or entertaining. Plus a 1 car garage. Home is located in the Greens. Pueblo El Mirage offers many amenities, such as an 18-hole championship golf course, 26 pickleball courts, tennis courts, dog parks, heated pool, lawn bowling, billiards room, workshops, onsite post office and more!
ⓘ Source: listings_history table (triggers on properties + properties_extension) + one-shot
backfill from property_details.listing_events for pre-trigger history.
Nearby sold comps map
Loading sold comps map…
Walkable amenities ~0.75 mi
Loading nearby amenities…
Taxation est. · year 1
- Rental income
- $20,758
- − Mortgage interest
- −$10,027
- − Property taxes
- −$2,685
- − Insurance
- −$895
- − Repairs & maintenance
- −$1,661
- − Management
- −$1,661
- − Depreciation
- −$5,207
- Taxable loss
- −$1,377
- Est. tax savings @ 24.0%
- +$331
- After-tax cash flow
- $1,885/yr
For passive investors: Depreciation is non-cash, so a rental often shows a tax loss while cash-flowing — sheltering income. Rental losses are passive: they offset passive income freely, and up to $25,000/yr can offset ordinary (W-2) income if you actively participate and your MAGI is under $100k (phasing out to $0 by $150k); unused losses carry forward. On sale, claimed depreciation is recaptured at up to 25%, and gains may owe capital-gains tax (a 1031 exchange can defer both). Figures are a year-1 estimate at your 24.0% rate — not tax advice; consult a CPA.
Schools (NCES district)
- District
- Dysart Unified District (4243)
- NCES district ID
- 0402690
- Math proficiency
- 34% ▼ -10.00%
- Reading proficiency
- 40% ▼ -5.00%
- Median HH income
- $58,033
- Composite
- 32.76/100
- National rank
- #5634
- State rank
- #73 of 249 in AZ
Livability — El Mirage
- Score
- 63/100
- State rank
- #112
- US rank
- #15164
Category grades
Schools grade is shown separately in the Schools card above.
Census & demographics
- Census place
- El Mirage, AZ
- County
- Maricopa County · 4,537,380 people
- City population
- 36,088
- Metro
- Phoenix-Mesa-Chandler, AZ
- Population (ZIP)
- 36,088
- Household income
- $78,050
- Rent vs Own
- Severe rent burden
- 669.0
Population outlook (Maricopa County) Hauer SSP2
- Today (2025)
- 4,979,203 people
- By 2030
- 5,378,229 · +8.0%
- By 2040
- 6,156,598 · +23.6%
- By 2050
- 6,872,376 · +38.0%
- By 2075
- 8,401,270 · +68.7%
- By 2100
- 9,247,439 · +85.7%
Race, ethnicity, and origin ACS 2023
- Neighborhood character
- Diverse neighborhood (Simpson 0.62)
- Race & ethnicity
- Hispanic / Latino 50% White 35% Two or more races 28% Black 6% Native American 1% Pacific Islander 1%
- Hispanic origin (detail)
- Mexican 37%
- Common ancestry
- Lithuanian 2% Romanian 1% Iranian 1%
- Foreign-born
- 15% · Canada
- Languages at home
- 66% English-only · Spanish 30% Other Indo-European 1% Other Asian/Pacific 1%
Political lean MEDSL · Maricopa
- 2024 margin
- Toss-up / Even · D 47.7% · R 51.2% · Other 1.1%
- 2008→2024 swing
- +7.1pp toward D · 2008: -10.6pp · 2024: -3.5pp
- All cycles
- 2024: R+3.5 2020: D+2.2 2016: R+3.5 2012: R+12.0 2008: R+10.6
Not yet ingested
- Civics
- —
Market trends
- HPI YoY
- ▼ -52.81%
- Current HPI
- 342.6503
- Rent YoY
- ▲ 0.08%
- Metro
- Phoenix-Mesa-Chandler, AZ
- State GDP YoY
- ▲ 4.54%
- F500 in state
- 20
Industry mix (Fortune 500 HQ in AZ)
| Industry | F500 HQs | Revenue |
|---|---|---|
| Technology | 2 | $13B |
|
||
| Mining / Metals | 1 | $23B |
|
||
| Environmental Services | 1 | $16B |
|
||
| Metals / Steel | 1 | $14B |
|
||
| Technology Distribution | 1 | $9B |
|
||
| Homebuilding | 1 | $8B |
|
||
Price history
1 event — show timeline
- 2026-03-19 Listed $179,000 ARMLS
Property tax history
+1.0%/yrLatest (2025): $341 · -0.2% YoY. Source: county tax records.
Cash-flow waterfall
monthlySold comps — $/sqft
last 12 mo · ≤1 miLoading sold comps…