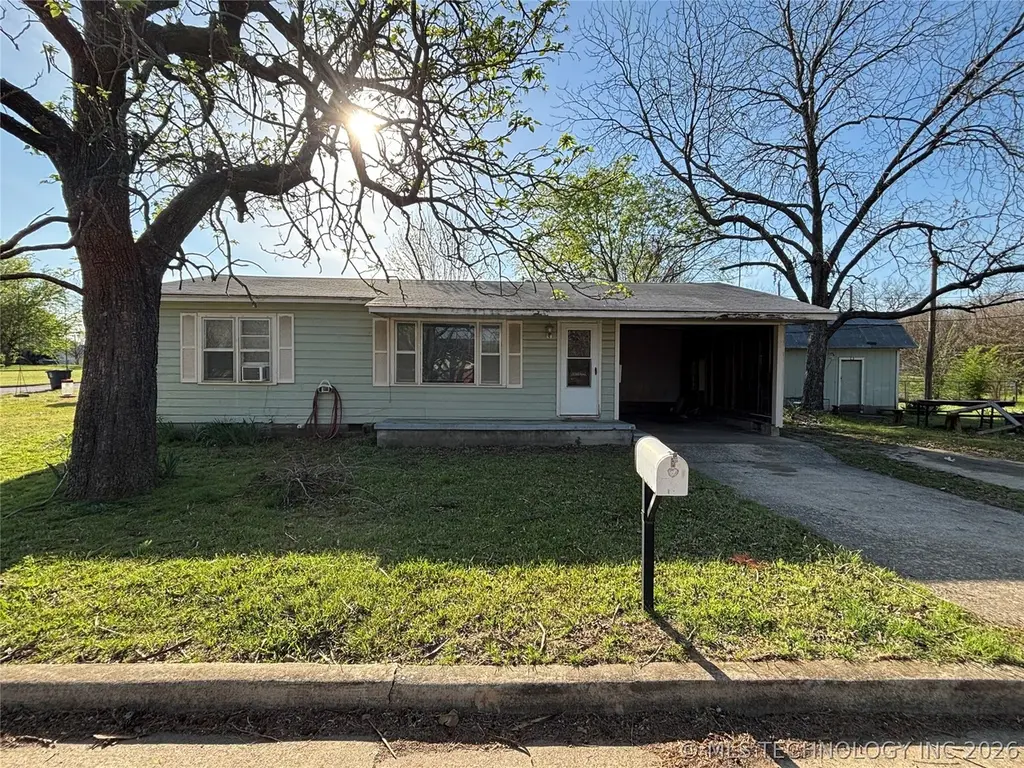
902 Roosevelt · Durant, OK
Flood risk 1/10 · Minimal
- FEMA flood zone
- X (unshaded)
- Chance of flooding over 30 yrs
- 0.0%
- Est. flood insurance / yr
- $507 – $1,088
Fire risk 4/10 · Minor
- Est. fire insurance / yr
- $2,463 – $4,575
Heat risk 7/10 · Major
- Hot days now (above 111°F)
- 7 days/yr
- Hot days in 30 yrs
- 20 days/yr
Wind risk 4/10 · Minor
- Chance of severe wind over 30 yrs
- 18.0%
Air-quality risk 3/10 · Minor
- Unhealthy air days now
- 2 days/yr
- Unhealthy air days in 30 yrs
- 2 days/yr
Risk factors via First Street. Map © Google.
Why this score? — see what drove the B+ grade
The composite is a weighted blend of 9 inputs, each scored 0–100. Each bar is that input's sub-score; the figure is the points it added to the 100-point composite (weight × sub-score).
- Cash flow +30.0/30.0
- ARV discount +15.0/15.0
- 1% rule +10.0/10.0
- DSCR +10.0/10.0
- Livability +3.1/5.0
- Schools +2.8/10.0
- Rent growth +2.5/5.0
- Condition / age +2.5/5.0
- Appreciation +0.0/10.0
$86,000
🖨 Deal sheet (PDF) 📄 Offer letter ✓ Due diligence
Listing remarks
902 Roosevelt Ave - Here is an 'investor special' on the north side of town. This is a 2 bedroom, 1 bath home that with some work would be a good starter home or a great rental. This property is a corner lot and has mature trees including Catalpa and a large pine tree. The bathroom has already been updated, including a modern shower. There is an attached carport and a storage building for extra space. This home was occupied until recently, but will need work and will not likely qualify for some home loans including FHA. The home is being sold "As Is". There is opportunity here! Come check it out!
Key facts
- Attached carport
- Storage building
- Modern shower
Tags
Property features AI
Exterior
- Parking: Attached garage (1 car); Carport
- Security: No safety shelter
- Utilities: Electricity available; Natural gas available; Public water; Public sewer
- Home design: Single-story; Faces east; Crawlspace foundation
- Construction: Wood frame construction; Asphalt/fiberglass roof
- Exterior features: Covered porch; Shed(s) / storage; Partial fencing; Corner lot; Mature trees
Interior
- Kitchen: Refrigerator included
- Flooring: Carpet; Laminate; Plywood
- Bathrooms: 1 full bathroom
- Heating & cooling: Gas heating; Radiant heating; Window cooling unit(s)
- Interior features: Ceiling fan(s); Laminate countertops; Electric oven connection; No additional interior features listed
- Laundry & utility: Electric dryer hookup
Neighborhood map
What this means for you Summary
Snapshot
- This is a 3-bed/1.0-bath single-family listed at $86k.
Deal economics
- At list price, monthly cash flow is $521 ($6k/yr) — positive.
- The deal already cash-flows at list — no discount required.
- Meets the 1% rule at list price ($1k rent vs $86k).
- Recommended offer: $81k (6.0% below list) — sets the bar for market timing.
- Cap rate 13.6% vs local median 3.1% in Durant — top-decile yield for the area; either an underpriced asset or a hidden risk that comps aren't pricing in. Stress-test before assuming the spread holds.
Location & tenants
- Location reads 62/100 on livability (#262 in OK) — a middle-class / working-renter tenant base. Strengths: cost of living A+, housing A+; Watch: health & safety C-, crime D+, amenities F.
- Durant (town): math 30% / reading 37% proficiency, ranked #49 of 270 in OK (top 18%) — families likely to look elsewhere, expect single-tenant / working-renter base with shorter leases.
- Zoned schools: Washington Irving Es (math 42% / reading 32%, grade F, #132 of 845 statewide, top 19%, 435 students, 0% FRL); Durant Intermediate Es (math 24% / reading 36%, grade F, #49 of 345 statewide, top 15%, 615 students, 0% FRL); Durant Hs (math 22% / reading 32%, grade F, #125 of 447 statewide, top 31%, 956 students, 0% FRL) — zoned schools average 0% FRL vs 55% district-wide (55 pts lower); this property's tenant base skews higher-income than the district average.
- Market conditions: Rents soft (-0.1%/yr); 311 active listings in the ZIP; 2 comparable units currently listed for rent nearby; 176 units permitted in Bryan County in 2024 (80 in 5+ unit buildings).
Forward outlook
- Local home prices are declining (-3.0%/yr); year-one equity from $595 of loan paydown is wiped out by about $3k of value loss. Plan a longer hold.
- Bryan County population projected at +26% by 2050 — long-run rental-demand tailwind backs the buy-and-hold thesis.
- At projected returns (-3.0% appreciation + 0.0% rent growth), your $24k cash investment doubles in ~6 years — after that, you're playing with house money.
Negotiation context
- It's been on market 88 days — a 6% lower offer ($81k) is reasonable based on typical stale-listing flexibility.
Risks & watch-outs
- Climate carrying-cost: extreme-heat days projected 7→20/yr by 2055 (HVAC capex compounding) — expect insurance premiums to compound above CPI over the hold.
Questions for the listing agent
- It's been on market 88 days. Have you received any prior offers? Is the seller open to a 6% concession, seller financing, or rate buy-down credit?
- Built in 1969 — when were the roof, HVAC, electrical panel, plumbing, and water heater last replaced?
- Why hasn't it sold? Are there any deal-killer items the seller is aware of (foundation, flood, title, zoning, code violations)?
- Is there a deadline driving the sale (1031 exchange, divorce, estate, relocation)? That informs how much negotiation room exists.
- Schools are D-rated, which usually means shorter tenancies and higher turnover. Who's the typical renter profile here, and what's been the actual vacancy rate?
- Crime grade is D in this area — have there been break-ins, vandalism, or insurance claims at this property in the last 3 years? What carrier currently insures it and at what premium?
- What's the average days-on-market for RENTAL listings here right now (not sales)? A rising rental-DOM trend means longer vacancies and softer asking-rent achievability than the comps imply.
- What's the recent tenant-quality profile in this submarket — average credit score on applications, eviction rate, late-payment / NSF rate, and stable-employment percentage? A property-management company in the area should have these aggregated.
- How much new for-sale + rental construction is in the pipeline within 1–3 miles? Heavy new supply typically softens prices + rents 12–24 months out; constrained supply supports both.
Investment metrics
- 1% rule
- 1.59% ✓
- Cap rate
- 13.57%
- Cash-on-cash
- 25.97%
- DSCR
- 2.16
- GRM
- 5.2
CMA / ARV
- ARV (on-the-fly)
- $164,934
- Comps found
- 12
Show comp detail 12 sales within ~0.75 mi
| Address | Dist | Beds/Ba | Sqft | Sold | Price | $/sf | Match |
|---|---|---|---|---|---|---|---|
| 1120 W Willow | 0.18mi | 4/2.0 (+1) | 1,399 (+7%) | 2mo | $176,000 | $126 | 70 |
| 724 N 7th | 0.43mi | 3/2.0 | 1,256 (-4%) | 2mo | $190,000 | $151 | 68 |
| 1704 Lahoma | 0.55mi | 3/2.0 | 1,325 (+1%) | 3mo | $230,000 | $174 | 66 |
| 1822 W Elm St | 0.52mi | 3/1.0 | 1,232 (-6%) | 1mo | $51,277 | $42 | 65 |
| 411 N 7th Ave | 0.49mi | 2/2.0 (-1) | 1,259 (-4%) | 2mo | $38,000 | $30 | 60 |
| 515 W Pine | 0.51mi | 2/1.0 (-1) | 1,246 (-5%) | 4mo | $134,000 | $108 | 59 |
| 307 N 8th | 0.49mi | 3/2.0 | 1,228 (-6%) | 6mo | $168,000 | $137 | 58 |
| 1702 Maple | 0.38mi | 3/1.0 | 1,497 (+14%) | 1mo | $143,100 | $96 | 58 |
| 1524 W Maple St W | 0.29mi | 3/1.5 | 1,504 (+15%) | 2mo | $115,000 | $76 | 58 |
| 1715 Worley St | 0.54mi | 3/2.0 | 1,426 (+9%) | 3mo | $180,000 | $126 | 54 |
| 1211 Four Seasons Dr | 0.67mi | 3/2.0 | 1,448 (+11%) | 1mo | $229,000 | $158 | 46 |
| 1312 N 3rd Ave W | 0.73mi | 2/1.0 (-1) | 1,120 (-14%) | 4mo | $167,000 | $149 | 34 |
Match score weights: distance 35% · size 25% · config 20% · recency 20%. Top-matched comps best support the ARV.
Projected returns pro-forma
-3.0% appreciation · 0.0% rent growth · sell at horizon
- IRR
- 16.3%
- Equity multiple
- 1.63×
- Total profit
- $15,251
- Equity at exit
- $12,823
- IRR
- 22.7%
- Equity multiple
- 2.68×
- Total profit
- $40,536
- Equity at exit
- $7,436
Cash invested: $24,080 (down + closing). Projections, not guarantees.
Landlord ↔ Tenant lean methodology
- Overall (STATE)
- 83 Strongly Landlord-Friendly
- State Oklahoma
- 83 Strongly Landlord-Friendly · R+20
- County
- — inherits STATE
- City
- — inherits STATE
ZIP-level market 74701
- Home prices YoY
- -11.3%
- Rents YoY
- -0.1%
- Active inventory
- 311
- Price-to-rent
- 5.2×
Monthly cashflow live
- Estimated rent
- $1,367 medium interval (Pro) →
- Mortgage (P&I)
- −$451
- Tax from tax record
- −$72 /mo · $863/yr
- Insurance
- −$36
- HOA
- −$0
- Vacancy / Maint / Mgmt
- −$287
- Net cashflow
- $521
Break-even live
Sensitivity live
| Price | -10% $570 | -5% $546 | +0% $521 | +5% $497 | +10% $472 |
|---|---|---|---|---|---|
| Rent | -10% $413 | -5% $467 | +0% $521 | +5% $575 | +10% $629 |
| Rate | -1.0pp $564 | -0.5pp $543 | base $521 | +0.5pp $499 | +1.0pp $476 |
UW: 25.0% down · 7.5% · 30yr · 1.5% tax · 5.0% vac · 8.0% maint · 8.0% mgmt
Financing live
Cash to close
- Down payment
- $21,500
- Closing costs
- $2,580
- Reserves months
- —
- Total cash needed
- —
Loan-product check · same deal, 3 products live
Conventional
25% down · 7.5% · 30yr
- Down + closing
- —
- Monthly P&I
- —
- Monthly cashflow
- —
- DSCR
- —
- Eligible?
- —
Personal DTI + credit; lowest rate.
DSCR
20% down · 8.5% · 30yr
- Down + closing
- —
- Monthly P&I
- —
- Monthly cashflow
- —
- DSCR
- —
- Eligible?
- —
No personal income docs; deal must DSCR.
Hard money
10% down · 12.0% · 12mo
- Down + closing
- —
- Monthly P&I
- —
- Monthly cashflow
- —
- DSCR
- —
- Eligible?
- —
Short-term bridge; refi at stabilization.
Rent comps 2 comps
| Address | Beds | Baths | Sqft | Rent | $/sqft | DOM | Units | Dist |
|---|---|---|---|---|---|---|---|---|
| 2200 W University Blvd Durant, OK | 1.0–2.0 | 1.0 | 803 | $1,000 | $1.25 | 23d | 6 | 0.61mi |
| 112 Wilson St Durant, OK | 2.0–3.0 | 1.0–2.0 | 901 | $975 | $1.08 | 23d | 5 | 0.91mi |
Listing history 23 events
-
2026-06-22days on market $86,000 Active 88 DOM
-
2026-06-21days on market $86,000 Active 87 DOM
-
2026-06-19days on market $86,000 Active 85 DOM
-
2026-06-18days on market $86,000 Active 84 DOM
-
2026-06-17days on market $86,000 Active 83 DOM
-
2026-06-16days on market $86,000 Active 82 DOM
-
2026-06-15days on market $86,000 Active 81 DOM
-
2026-06-14days on market $86,000 Active 79 DOM
-
2026-06-12days on market $86,000 Active 78 DOM
-
2026-06-09days on market $86,000 Active 75 DOM
-
2026-06-08days on market $86,000 Active 74 DOM
-
2026-06-07days on market $86,000 Active 73 DOM
-
2026-06-07days on market $86,000 Active 72 DOM
-
2026-06-03days on market $86,000 Active 69 DOM
-
2026-06-02days on market $86,000 Active 68 DOM
-
2026-06-01days on market $86,000 Active 67 DOM
-
2026-05-31days on market $86,000 Active 66 DOM
-
2026-05-30days on market $86,000 Active 65 DOM
-
2026-04-24price $86,000
-
2026-03-25$87,500 Active
-
2013-10-23soldstatus $91,500
-
2004-10-20soldstatus $80,000
-
2004-01-09soldstatus $11,000
ⓘ Source: listings_history table (triggers on properties + properties_extension) + one-shot
backfill from property_details.listing_events for pre-trigger history.
Tax reassessment forecast OK · Resets to sale price
- Current annual tax
- $863 · $72/mo
- Projected year-2 tax
- $863 · $72/mo
- Expected delta
- $0/yr ($0/mo · -0.0%)
ⓘ Screening estimate from a state-policy table — verify with the county assessor before closing.
Climate risk First Street
- Flood 1/10 Low FEMA zone X (unshaded) · 0% chance over 30 yrs
- Wildfire 4/10 Moderate
- Heat 7/10 Severe 7 d/yr ≥111°F today · 20 d/yr by 30 yrs out
- Wind 4/10 Moderate 18% chance of damaging wind over 30 yrs
- Air quality 3/10 Moderate 2 unhealthy d/yr today · 2 by 30 yrs out
Nearby sold comps map
Loading sold comps map…
Walkable amenities ~0.75 mi
Loading nearby amenities…
Taxation est. · year 1
- Rental income
- $16,404
- − Mortgage interest
- −$4,817
- − Property taxes
- −$863
- − Insurance
- −$430
- − Repairs & maintenance
- −$1,312
- − Management
- −$1,312
- − Depreciation
- −$2,502
- Taxable income
- $5,167
- Est. tax owed @ 24.0%
- −$1,240
- After-tax cash flow
- $5,014/yr
For passive investors: Depreciation is non-cash, so a rental often shows a tax loss while cash-flowing — sheltering income. Rental losses are passive: they offset passive income freely, and up to $25,000/yr can offset ordinary (W-2) income if you actively participate and your MAGI is under $100k (phasing out to $0 by $150k); unused losses carry forward. On sale, claimed depreciation is recaptured at up to 25%, and gains may owe capital-gains tax (a 1031 exchange can defer both). Figures are a year-1 estimate at your 24.0% rate — not tax advice; consult a CPA.
Schools (NCES district)
- District
- Durant
- NCES district ID
- 4010350
- Math proficiency
- 30% ▼ -11.00%
- Reading proficiency
- 37% ▼ -7.00%
- Median HH income
- $35,850
- Composite
- 27.73/100
- National rank
- #6903
- State rank
- #49 of 270 in OK
Livability — Durant
- Score
- 62/100
- State rank
- #262
- US rank
- #17020
Category grades
Schools grade is shown separately in the Schools card above.
Census & demographics
- Census place
- Durant, OK
- County
- Bryan County · 27,497 people
- City population
- 27,497
- Metro
- Durant, OK
- Population (ZIP)
- 27,497
- Household income
- $58,036
- Rent vs Own
- Severe rent burden
- 759.0
Population outlook (Bryan County) Hauer SSP2
- Today (2025)
- 50,265 people
- By 2030
- 52,866 · +5.2%
- By 2040
- 58,018 · +15.4%
- By 2050
- 63,073 · +25.5%
- By 2075
- 74,439 · +48.1%
- By 2100
- 81,743 · +62.6%
Race, ethnicity, and origin ACS 2023
- Neighborhood character
- Diverse neighborhood (Simpson 0.56)
- Race & ethnicity
- White 65% Native American 14% Two or more races 13% Hispanic / Latino 9% Black 3%
- Hispanic origin (detail)
- Mexican 7%
- Common ancestry
- Italian 1% Slovak 1% Serbian 1%
- Foreign-born
- 3% · Canada
- Languages at home
- 94% English-only · Spanish 5% Other Indo-European 1%
Political lean MEDSL · Bryan
- 2024 margin
- Solid R (+58.5) · D 20.0% · R 78.6% · Other 1.4%
- 2008→2024 swing
- -23.0pp toward R · 2008: -35.5pp · 2024: -58.5pp
- All cycles
- 2024: R+58.5 2020: R+56.5 2016: R+55.6 2012: R+44.5 2008: R+35.5
Not yet ingested
- Civics
- —
Market trends
- HPI YoY
- ▼ -38.66%
- Current HPI
- 303.3877
- Rent YoY
- ▼ -0.13%
- Metro
- Durant, OK
- State GDP YoY
- ▲ 1.55%
- F500 in state
- 6
Industry mix (Fortune 500 HQ in OK)
| Industry | F500 HQs | Revenue |
|---|---|---|
| Energy | 3 | $48B |
|
||
Price history
+681.8% since first listed5 events — show timeline
- 2026-04-24 Price Changed $86,000 MLS Technology, Inc.
- 2026-03-25 Listed $87,500 MLS Technology, Inc.
- 2013-10-23 Sold (Public Records) $91,500 Public Records
- 2004-10-20 Sold (Public Records) $80,000 Public Records
- 2004-01-09 Sold (Public Records) $11,000 Public Records
Property tax history
-0.4%/yrLatest (2025): $863 · -3.1% YoY. Source: county tax records.
Cash-flow waterfall
monthlySold comps — $/sqft
last 12 mo · ≤1 miLoading sold comps…