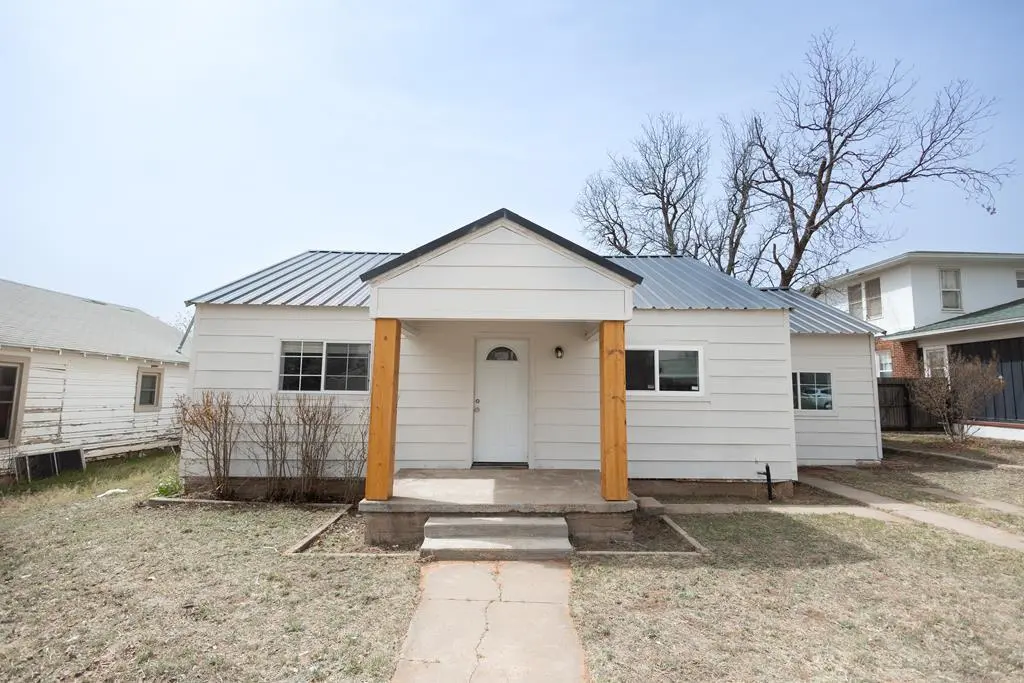
737 Hickory St · Colorado City, TX
Flood risk 1/10 · Minimal
- FEMA flood zone
- X
- Chance of flooding over 30 yrs
- 0.0%
- Est. flood insurance / yr
- $507 – $1,088
Fire risk 6/10 · Moderate
- Est. fire insurance / yr
- $1,222 – $2,270
Heat risk 7/10 · Major
- Hot days now (above 104°F)
- 7 days/yr
- Hot days in 30 yrs
- 20 days/yr
Wind risk 3/10 · Minor
- Chance of severe wind over 30 yrs
- 5.0%
Air-quality risk 1/10 · Minimal
- Unhealthy air days now
- 0 days/yr
- Unhealthy air days in 30 yrs
- 0 days/yr
Risk factors via First Street. Map © Google.
Why this score? — see what drove the C+ grade
The composite is a weighted blend of 9 inputs, each scored 0–100. Each bar is that input's sub-score; the figure is the points it added to the 100-point composite (weight × sub-score).
- Cash flow +24.3/30.0
- DSCR +7.8/10.0
- ARV discount +7.5/15.0
- Appreciation +7.2/10.0
- 1% rule +6.1/10.0
- Livability +3.5/5.0
- Schools +3.0/10.0
- Rent growth +2.5/5.0
- Condition / age +2.5/5.0
$110,000
🖨 Deal sheet 📄 Offer letter ✓ Due diligence
Listing remarks MLS
This 3 bedroom, 1 bathroom home offers 1,136 sq ft of comfortable living with updates throughout. New flooring, fresh interior paint, updated interior doors, and newer windows give the home a clean, refreshed feel. The kitchen features new countertops, a modern sink, and updated fixtures, while the bathroom has been remodeled with a fresh look. The exterior has been recently painted, and a durable metal roof adds long term peace of mind. Out front, stained posts on the porch add a warm, inviting touch. Out back, you'll find a large fenced yard with plenty of space to enjoy.
Key facts
- New flooring
- New countertops
- Fresh interior paint
Tags
Neighborhood map
What this means for you Summary
Snapshot
- This is a 3-bed/1.0-bath single-family listed at $110k.
Deal economics
- At list price, monthly cash flow is $222 ($3k/yr) — positive.
- The deal already cash-flows at list — no discount required.
- Meets the 1% rule at list price ($1k rent vs $110k).
- Recommended offer: $100k (9.0% below list) — sets the bar for market timing.
Location & tenants
- Location reads 70/100 on livability (#355 in TX) — a middle-class / working-renter tenant base. Strengths: cost of living A+, housing A+, crime B+; Watch: schools C-, health & safety C-, amenities F.
- Colorado ISD (town): math 37% / reading 34% proficiency, ranked #508 of 826 in TX (top 62%) — families likely to look elsewhere, expect single-tenant / working-renter base with shorter leases.
- Market conditions: 84 active listings in the ZIP.
Forward outlook
- In year one you build about $6k of equity ($761 loan paydown + $5k appreciation (4.4% local appreciation)).
- Mitchell County population projected at +8% by 2050 — modest demand growth; plan on rents tracking national, not racing it.
- At projected returns (4.4% appreciation + 3.0% rent growth), your $31k cash investment doubles in ~4 years — after that, you're playing with house money.
- By year 7, paydown + projected appreciation supports a ~$36k cash-out refi (75% LTV) — recoverable capital for the next deal without selling this one.
Negotiation context
- It's been on market 93 days — a 9% lower offer ($100k) is reasonable based on typical stale-listing flexibility.
Risks & watch-outs
- Watch-outs: built in 1948 — expect roof / HVAC / electrical / plumbing capex.
- Climate carrying-cost: major wildfire risk; extreme-heat days projected 7→20/yr by 2055 (HVAC capex compounding) — expect insurance premiums to compound above CPI over the hold.
Questions for the listing agent
- It's been on market 93 days. Have you received any prior offers? Is the seller open to a 9% concession, seller financing, or rate buy-down credit?
- Built in 1948 — when were the roof, HVAC, electrical panel, plumbing, and water heater last replaced?
- Why hasn't it sold? Are there any deal-killer items the seller is aware of (foundation, flood, title, zoning, code violations)?
- Is there a deadline driving the sale (1031 exchange, divorce, estate, relocation)? That informs how much negotiation room exists.
- What's the average days-on-market for RENTAL listings here right now (not sales)? A rising rental-DOM trend means longer vacancies and softer asking-rent achievability than the comps imply.
- What's the recent tenant-quality profile in this submarket — average credit score on applications, eviction rate, late-payment / NSF rate, and stable-employment percentage? A property-management company in the area should have these aggregated.
- How much new for-sale + rental construction is in the pipeline within 1–3 miles? Heavy new supply typically softens prices + rents 12–24 months out; constrained supply supports both.
Investment metrics
- 1% rule
- 1.11% ✓
- Cap rate
- 8.71%
- Cash-on-cash
- 8.64%
- DSCR
- 1.38
- GRM
- 7.5
CMA / ARV
- ARV (median comp)
- $44,942
- List price
- $110,000
- Delta
- 144.76%
- Verdict
- OVERPRICED
- Comps
- 4 within 1.0 mi
Show comp detail 1 sale within ~0.75 mi
| Address | Dist | Beds/Ba | Sqft | Sold | Price | $/sf | Match |
|---|---|---|---|---|---|---|---|
| 603 Pine St | 0.45mi | 2/1.0 (-1) | 1,036 (-9%) | 14mo | $36,550 | $35 | 48 |
Match score weights: distance 35% · size 25% · config 20% · recency 20%. Top-matched comps best support the ARV.
Projected returns pro-forma
4.37% appreciation · 3.0% rent growth · sell at horizon
- IRR
- 18.9%
- Equity multiple
- 2.16×
- Total profit
- $35,580
- Equity at exit
- $58,179
- IRR
- 19.2%
- Equity multiple
- 4.16×
- Total profit
- $97,372
- Equity at exit
- $97,129
Cash invested: $30,800 (down + closing). Projections, not guarantees.
Landlord ↔ Tenant lean methodology
- Overall (STATE)
- 87 Strongly Landlord-Friendly
- State Texas
- 87 Strongly Landlord-Friendly · R+5
- County
- — inherits STATE
- City
- — inherits STATE
ZIP-level market 79512
- Home prices YoY
- 4.6%
- Active inventory
- 84
- Price-to-rent
- 7.5×
Monthly cashflow live
- Estimated rent
- $1,223 medium interval (Pro) →
- Mortgage (P&I)
- −$577
- Tax from tax record
- −$122 /mo · $1,460/yr
- Insurance
- −$46
- HOA
- −$0
- Vacancy / Maint / Mgmt
- −$257
- Net cashflow
- $222
Break-even live
UW: 25.0% down · 7.5% · 30yr · 1.5% tax · 5.0% vac · 8.0% maint · 8.0% mgmt
Financing live
Cash to close
- Down payment
- $27,500
- Closing costs
- $3,300
- Reserves months
- —
- Total cash needed
- —
Loan-product check · same deal, 3 products live
Conventional
25% down · 7.5% · 30yr
- Down + closing
- —
- Monthly P&I
- —
- Monthly cashflow
- —
- DSCR
- —
- Eligible?
- —
Personal DTI + credit; lowest rate.
DSCR
20% down · 8.5% · 30yr
- Down + closing
- —
- Monthly P&I
- —
- Monthly cashflow
- —
- DSCR
- —
- Eligible?
- —
No personal income docs; deal must DSCR.
Hard money
10% down · 12.0% · 12mo
- Down + closing
- —
- Monthly P&I
- —
- Monthly cashflow
- —
- DSCR
- —
- Eligible?
- —
Short-term bridge; refi at stabilization.
Listing history 17 events
-
2026-06-18days on market $110,000 Active 93 DOM
-
2026-06-17days on market $110,000 Active 92 DOM
-
2026-06-16days on market $110,000 Active 91 DOM
-
2026-06-15days on market $110,000 Active 90 DOM
-
2026-06-13days on market $110,000 Active 88 DOM
-
2026-06-12days on market $110,000 Active 87 DOM
-
2026-06-09days on market $110,000 Active 84 DOM
-
2026-06-08days on market $110,000 Active 83 DOM
-
2026-06-08days on market $110,000 Active 82 DOM
-
2026-06-05days on market $110,000 Active 80 DOM
-
2026-06-03days on market $110,000 Active 78 DOM
-
2026-06-02days on market $110,000 Active 77 DOM
-
2026-06-01days on market $110,000 Active 76 DOM
-
2026-05-31days on market $110,000 Active 75 DOM
-
2026-04-27price $110,000 580-char remark
Show marketing remark (580 chars)
This 3 bedroom, 1 bathroom home offers 1,136 sq ft of comfortable living with updates throughout. New flooring, fresh interior paint, updated interior doors, and newer windows give the home a clean, refreshed feel. The kitchen features new countertops, a modern sink, and updated fixtures, while the bathroom has been remodeled with a fresh look. The exterior has been recently painted, and a durable metal roof adds long term peace of mind. Out front, stained posts on the porch add a warm, inviting touch. Out back, you'll find a large fenced yard with plenty of space to enjoy.
-
2026-03-17$115,000 Active 580-char remark
Show marketing remark (580 chars)
This 3 bedroom, 1 bathroom home offers 1,136 sq ft of comfortable living with updates throughout. New flooring, fresh interior paint, updated interior doors, and newer windows give the home a clean, refreshed feel. The kitchen features new countertops, a modern sink, and updated fixtures, while the bathroom has been remodeled with a fresh look. The exterior has been recently painted, and a durable metal roof adds long term peace of mind. Out front, stained posts on the porch add a warm, inviting touch. Out back, you'll find a large fenced yard with plenty of space to enjoy.
-
2022-08-05soldstatus
ⓘ Source: listings_history table (triggers on properties + properties_extension) + one-shot
backfill from property_details.listing_events for pre-trigger history.
Tax reassessment forecast TX · Resets to sale price
- Current annual tax
- $1,460 · $122/mo
- Projected year-2 tax
- $2,013 · $168/mo
- Expected delta
- +$553/yr (+$46/mo · 37.9%)
ⓘ Screening estimate from a state-policy table — verify with the county assessor before closing.
Climate risk First Street
- Flood 1/10 Low FEMA zone X · 0% chance over 30 yrs
- Wildfire 6/10 Major
- Heat 7/10 Severe 7 d/yr ≥104°F today · 20 d/yr by 30 yrs out
- Wind 3/10 Moderate 5% chance of damaging wind over 30 yrs
- Air quality 1/10 Low 0 unhealthy d/yr today · 0 by 30 yrs out
Nearby sold comps map
Loading sold comps map…
Walkable amenities ~0.75 mi
Loading nearby amenities…
Taxation est. · year 1
- Rental income
- $14,675
- − Mortgage interest
- −$6,162
- − Property taxes
- −$1,460
- − Insurance
- −$550
- − Repairs & maintenance
- −$1,174
- − Management
- −$1,174
- − Depreciation
- −$3,200
- Taxable income
- $956
- Est. tax owed @ 24.0%
- −$229
- After-tax cash flow
- $2,432/yr
For passive investors: Depreciation is non-cash, so a rental often shows a tax loss while cash-flowing — sheltering income. Rental losses are passive: they offset passive income freely, and up to $25,000/yr can offset ordinary (W-2) income if you actively participate and your MAGI is under $100k (phasing out to $0 by $150k); unused losses carry forward. On sale, claimed depreciation is recaptured at up to 25%, and gains may owe capital-gains tax (a 1031 exchange can defer both). Figures are a year-1 estimate at your 24.0% rate — not tax advice; consult a CPA.
Schools (NCES district)
- District
- Colorado ISD
- NCES district ID
- 4814640
- Math proficiency
- 37% ▼ -8.00%
- Reading proficiency
- 34% ▼ -4.00%
- Median HH income
- $46,054
- Composite
- 30.41/100
- National rank
- #6249
- State rank
- #508 of 826 in TX
Livability — Colorado City
- Score
- 70/100
- State rank
- #355
- US rank
- #7722
Category grades
Schools grade is shown separately in the Schools card above.
Census & demographics
- Census place
- Colorado City, TX
- Population (ZIP)
- 7,672
Population outlook (Mitchell County) Hauer SSP2
- Today (2025)
- 8,476 people
- By 2030
- 8,723 · +2.9%
- By 2040
- 9,046 · +6.7%
- By 2050
- 9,200 · +8.5%
- By 2075
- 8,936 · +5.4%
- By 2100
- 7,978 · -5.9%
Race, ethnicity, and origin ACS 2023
- Neighborhood character
- Diverse neighborhood (Simpson 0.64)
- Race & ethnicity
- White 47% Hispanic / Latino 37% Two or more races 20% Black 6% Asian 2%
- Hispanic origin (detail)
- Mexican 34%
- Common ancestry
- Serbian 2% Lithuanian 1% Slovak 1%
- Foreign-born
- 3% · Canada
- Languages at home
- 80% English-only · Spanish 18% Tagalog/Filipino 1%
Political lean MEDSL · Mitchell
- 2024 margin
- Solid R (+71.3) · D 14.0% · R 85.3%
- 2008→2024 swing
- -20.8pp toward R · 2008: -50.5pp · 2024: -71.3pp
- All cycles
- 2024: R+71.3 2020: R+68.8 2016: R+65.2 2012: R+52.7 2008: R+50.5
Not yet ingested
- Civics
- —
Market trends
- HPI YoY
- ▲ 4.37%
- Current HPI
- 99.8822
- Rent YoY
- —
- Metro
- —
- State GDP YoY
- ▲ 3.95%
- F500 in state
- 110
Industry mix (Fortune 500 HQ in TX)
| Industry | F500 HQs | Revenue |
|---|---|---|
| Energy | 16 | $1,198B |
|
||
| Technology | 5 | $198B |
|
||
| Engineering / Construction | 4 | $72B |
|
||
| Energy Services | 3 | $60B |
|
||
| Utilities | 3 | $41B |
|
||
| Healthcare | 2 | $330B |
|
||
Price history
-4.3% since first listed3 events — show timeline
- 2026-04-27 Price Changed $110,000 PBBOR
- 2026-03-17 Listed $115,000 PBBOR
- 2022-08-05 Sold (Public Records) — Public Records
Property tax history
+5.3%/yrLatest (2025): $1,460 · +16.4% YoY. Source: county tax records.
Cash-flow waterfall
monthlySold comps — $/sqft
last 12 mo · ≤1 miLoading sold comps…