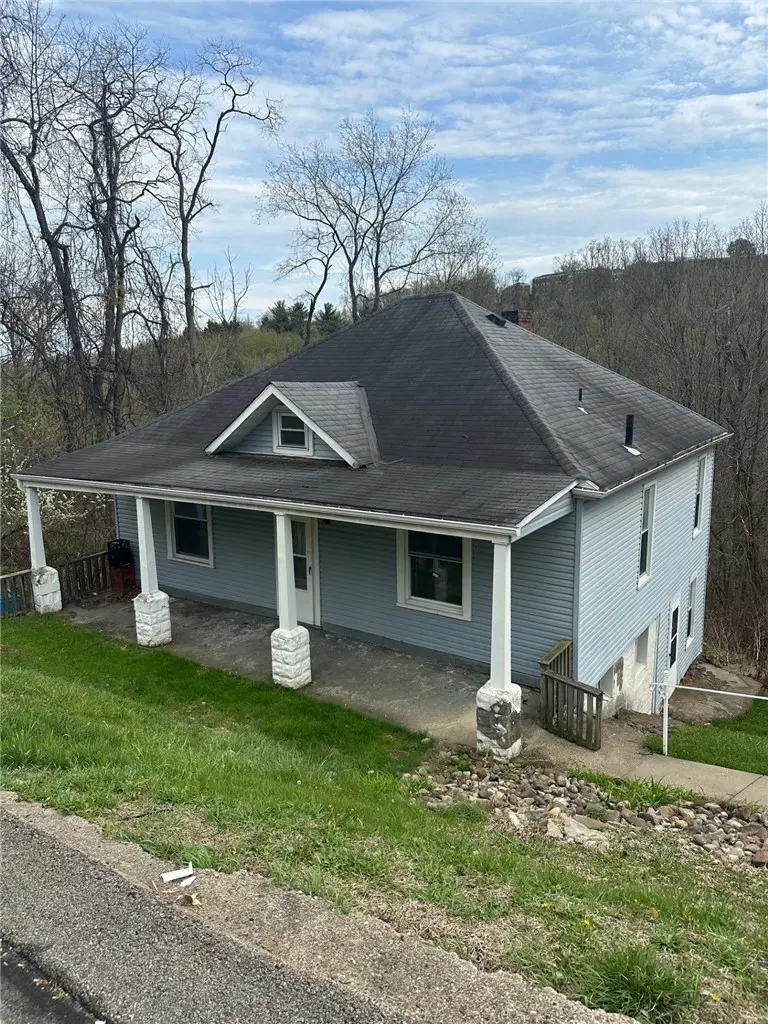
500 Pointview Rd · Brentwood, PA
Flood risk 1/10 · Minimal
- FEMA flood zone
- X (unshaded)
- Chance of flooding over 30 yrs
- 0.0%
- Est. flood insurance / yr
- $473 – $860
Fire risk 1/10 · Minimal
- Est. fire insurance / yr
- $511 – $949
Heat risk 3/10 · Minor
- Hot days now (above 96°F)
- 7 days/yr
- Hot days in 30 yrs
- 17 days/yr
Wind risk 2/10 · Minimal
- Chance of severe wind over 30 yrs
- —
Air-quality risk 3/10 · Minor
- Unhealthy air days now
- 3 days/yr
- Unhealthy air days in 30 yrs
- 5 days/yr
Risk factors via First Street. Map © Google.
Why this score? — see what drove the B grade
The composite is a weighted blend of 9 inputs, each scored 0–100. Each bar is that input's sub-score; the figure is the points it added to the 100-point composite (weight × sub-score).
- Cash flow +30.0/30.0
- 1% rule +10.0/10.0
- DSCR +10.0/10.0
- ARV discount +7.5/15.0
- Livability +4.0/5.0
- Rent growth +3.6/5.0
- Schools +3.4/10.0
- Condition / age +2.5/5.0
- Appreciation +0.0/10.0
$72,900
🖨 Deal sheet (PDF) 📄 Offer letter ✓ Due diligence
Listing remarks MLS
A Diamond in the rough, here are some property Highlights starting with the condition: The home requires a complete restoration and is being sold strictly as-is. Parking: Includes 2-car off-street parking, a valuable feature in this residential area. Nature Views: The property features views of nature from the back window, often described as overlooking a wooded yard area typical of Brentwood's hilly landscape.
Key facts
- Wooded yard area
- Views of nature
- 2.25 acre lot
Tags
Neighborhood map
What this means for you Summary
Snapshot
- This is a 3-bed/1.0-bath single-family listed at $73k.
Deal economics
- At list price, monthly cash flow is $645 ($8k/yr) — positive.
- The deal already cash-flows at list — no discount required.
- Meets the 1% rule at list price ($1k rent vs $73k).
- Recommended offer: $69k (6.0% below list) — sets the bar for market timing.
- Cap rate 16.9% vs local median 4.3% in Brentwood — top-decile yield for the area; either an underpriced asset or a hidden risk that comps aren't pricing in. Stress-test before assuming the spread holds.
Location & tenants
- Location reads 81/100 on livability (#178 in PA, #1,479 nationally) — a professional / high-income tenant draw. Strengths: cost of living A+, housing A+, employment A; Watch: amenities C-.
- Brentwood Borough SD (suburban): math 29% / reading 50% proficiency, ranked #357 of 539 in PA (top 66%) — families likely to look elsewhere, expect single-tenant / working-renter base with shorter leases.
- Zoned schools: Moore Sch (math 37% / reading 62%, grade D, #654 of 1,518 statewide, top 47%, 207 students, 63% FRL); Brentwood Ms (math 14% / reading 47%, grade F, #376 of 512 statewide, top 74%, 271 students, 62% FRL); Brentwood Shs (math 57%, 356 students, 44% FRL) — zoned schools average 57% FRL vs 40% district-wide (17 pts higher); higher-poverty schools than district average — tighter screening recommended.
- Market conditions: Rents rising fast (+4.3%/yr); 116 active listings in the ZIP; 15 comparable units currently listed for rent nearby; rentals at typical pace (median 25d on market — plan ~3-4 weeks tenant-placement turnaround); 47% of comp listings sitting > 30 days — soft ceiling on asking rent; solid renter incomes; 2,996 units permitted in Allegheny County in 2024 (1,588 in 5+ unit buildings).
Forward outlook
- Local home prices are declining (-3.0%/yr); year-one equity from $504 of loan paydown is wiped out by about $2k of value loss. Plan a longer hold.
- At projected returns (-3.0% appreciation + 4.3% rent growth), your $20k cash investment doubles in ~4 years — after that, you're playing with house money.
Negotiation context
- It's been on market 76 days — a 6% lower offer ($69k) is reasonable based on typical stale-listing flexibility.
Risks & watch-outs
- Watch-outs: built in 1915 — expect roof / HVAC / electrical / plumbing capex.
Questions for the listing agent
- It's been on market 76 days. Have you received any prior offers? Is the seller open to a 6% concession, seller financing, or rate buy-down credit?
- Built in 1915 — when were the roof, HVAC, electrical panel, plumbing, and water heater last replaced?
- Why hasn't it sold? Are there any deal-killer items the seller is aware of (foundation, flood, title, zoning, code violations)?
- Is there a deadline driving the sale (1031 exchange, divorce, estate, relocation)? That informs how much negotiation room exists.
- Schools are A-rated — typically a magnet for longer-tenancy family renters. What's the average tenant stay here, and is there a school-zone premium baked into asking?
- What's the average days-on-market for RENTAL listings here right now (not sales)? A rising rental-DOM trend means longer vacancies and softer asking-rent achievability than the comps imply.
- What's the recent tenant-quality profile in this submarket — average credit score on applications, eviction rate, late-payment / NSF rate, and stable-employment percentage? A property-management company in the area should have these aggregated.
- How much new for-sale + rental construction is in the pipeline within 1–3 miles? Heavy new supply typically softens prices + rents 12–24 months out; constrained supply supports both.
Investment metrics
- 1% rule
- 1.99% ✓
- Cap rate
- 16.91%
- Cash-on-cash
- 37.90%
- DSCR
- 2.69
- GRM
- 4.2
CMA / ARV
- ARV (median comp)
- $220,642
- List price
- $72,900
- Delta
- -66.96%
- Verdict
- UNDERPRICED
- Comps
- 20 within 1.0 mi
Show comp detail 12 sales within ~0.75 mi
| Address | Dist | Beds/Ba | Sqft | Sold | Price | $/sf | Match |
|---|---|---|---|---|---|---|---|
| 1516 Prospect Rd | 0.65mi | 3/2.0 | 1,478 (+0%) | 5mo | $236,900 | $160 | 61 |
| 3340 Recker Dr | 0.72mi | 3/1.5 | 1,488 (+1%) | 3mo | $180,000 | $121 | 60 |
| 4028 Cloverlea St | 0.72mi | 3/1.5 | 1,456 (-1%) | 3mo | $280,000 | $192 | 60 |
| 34 W Garden Rd | 0.71mi | 3/1.5 | 1,488 (+1%) | 5mo | $165,000 | $111 | 59 |
| 3116 Elroy Ave | 0.72mi | 3/1.5 | 1,502 (+2%) | 4mo | $155,000 | $103 | 58 |
| 3512 Dauphin Ave | 0.67mi | 3/1.5 | 1,596 (+8%) | 1mo | $64,900 | $41 | 52 |
| 3900 Willett Rd | 0.66mi | 3/2.0 | 1,365 (-8%) | 3mo | $183,000 | $134 | 50 |
| 4840 Elmwood Dr | 0.65mi | 4/2.0 (+1) | 1,372 (-7%) | 5mo | $280,000 | $204 | 45 |
| 3223 Willett Rd | 0.64mi | 3/1.0 | 1,275 (-14%) | 4mo | $211,000 | $165 | 44 |
| 3908 Brownsville Rd | 0.58mi | 3/2.0 | 1,261 (-15%) | 1mo | $225,000 | $178 | 44 |
| 1631 Elderslee Rd | 0.73mi | 3/1.0 | 1,283 (-13%) | 4mo | $152,000 | $118 | 40 |
| 1621 Elderslee Rd | 0.72mi | 3/2.0 | 1,290 (-13%) | 5mo | $135,000 | $105 | 38 |
Match score weights: distance 35% · size 25% · config 20% · recency 20%. Top-matched comps best support the ARV.
Projected returns pro-forma
-3.0% appreciation · 4.33% rent growth · sell at horizon
- IRR
- 35.4%
- Equity multiple
- 2.53×
- Total profit
- $31,242
- Equity at exit
- $10,870
- IRR
- 42.9%
- Equity multiple
- 5.33×
- Total profit
- $88,478
- Equity at exit
- $6,303
Cash invested: $20,412 (down + closing). Projections, not guarantees.
Landlord ↔ Tenant lean methodology
- Overall (STATE)
- 62 Landlord-Friendly
- State Pennsylvania
- 62 Landlord-Friendly · EVEN
- County
- — inherits STATE
- City
- — inherits STATE
ZIP-level market 15227
- Home prices YoY
- -27.5%
- Rents YoY
- 4.3%
- Active inventory
- 116
- Price-to-rent
- 4.2×
Monthly cashflow live
- Estimated rent
- $1,454 high interval (Pro) →
- Mortgage (P&I)
- −$382
- Tax est. 1.5%
- −$91 /mo · $1,094/yr
- Insurance
- −$30
- HOA
- −$0
- Vacancy / Maint / Mgmt
- −$305
- Net cashflow
- $645
Break-even live
Sensitivity live
| Price | -10% $695 | -5% $670 | +0% $645 | +5% $620 | +10% $594 |
|---|---|---|---|---|---|
| Rent | -10% $530 | -5% $587 | +0% $645 | +5% $702 | +10% $760 |
| Rate | -1.0pp $681 | -0.5pp $663 | base $645 | +0.5pp $626 | +1.0pp $607 |
UW: 25.0% down · 7.5% · 30yr · 1.5% tax · 5.0% vac · 8.0% maint · 8.0% mgmt
Financing live
Cash to close
- Down payment
- $18,225
- Closing costs
- $2,187
- Reserves months
- —
- Total cash needed
- —
Loan-product check · same deal, 3 products live
Conventional
25% down · 7.5% · 30yr
- Down + closing
- —
- Monthly P&I
- —
- Monthly cashflow
- —
- DSCR
- —
- Eligible?
- —
Personal DTI + credit; lowest rate.
DSCR
20% down · 8.5% · 30yr
- Down + closing
- —
- Monthly P&I
- —
- Monthly cashflow
- —
- DSCR
- —
- Eligible?
- —
No personal income docs; deal must DSCR.
Hard money
10% down · 12.0% · 12mo
- Down + closing
- —
- Monthly P&I
- —
- Monthly cashflow
- —
- DSCR
- —
- Eligible?
- —
Short-term bridge; refi at stabilization.
Rent comps 15 comps
| Address | Beds | Baths | Sqft | Rent | $/sqft | DOM | Units | Dist |
|---|---|---|---|---|---|---|---|---|
| 1526 Parkline Dr Pittsburgh, PA | 3.0 | 1.0 | 942 | $1,475 | $1.56 | 9d | 44 | 0.37mi |
| 416 Jacobson Dr Brentwood, PA | 2.0 | 1.0 | 1150 | $1,050 | $0.91 | 25d | 1 | 0.38mi |
| 4588 E Willock Rd Pittsburgh, PA | 3.0 | 1.5 | 1500 | $1,500 | $1.00 | 6d | 1 | 0.40mi |
| 3224 Bookman Ave Unit 1 Pittsburgh, PA | 2.0 | 2.0 | 1207 | $1,550 | $1.28 | 45d | 1 | 0.73mi |
| 3341 Recker Dr Pittsburgh, PA | 3.0 | 2.0 | 1174 | $1,750 | $1.49 | 25d | 1 | 0.77mi |
| 3341 Recker Dr Pittsburgh, PA | 3.0 | 2.0 | 875 | $1,790 | $2.05 | 45d | 1 | 0.77mi |
| 139 W Bellecrest Ave Brentwood, PA | 1.0–3.0 | 1.0 | 775 | $1,450 | $1.87 | 4d | 12 | 0.83mi |
| 3367 Jameson Dr Brentwood, PA | 2.0–3.0 | 1.0 | 975 | $1,435 | $1.47 | 9d | 7 | 0.94mi |
| 2823 Clermont Ave Pittsburgh, PA | 3.0 | 1.0 | 1354 | $1,490 | $1.10 | 22d | 1 | 0.97mi |
| 2940 Brevard Ave Pittsburgh, PA | 3.0 | 1.5 | 1176 | $1,475 | $1.25 | 45d | 1 | 0.98mi |
| 453 Greenlee Rd Pittsburgh, PA | 3.0 | 1.0 | 1176 | $1,495 | $1.27 | 45d | 1 | 0.98mi |
| 2811 Brownsville Rd Unit 4 Brentwood, PA | 2.0 | 1.0 | 1250 | $995 | $0.80 | 45d | 1 | 1.00mi |
| 2769 Churchview Ave Unit 9 Pittsburgh, PA | 2.0 | 1.0 | 1200 | $1,095 | $0.91 | 45d | 1 | 1.03mi |
| 2733-2735 Pyramid Ave Pittsburgh, PA | 2.0 | 1.0 | 1028 | $1,295 | $1.26 | 45d | 1 | 1.04mi |
| 2721 Pyramid Ave Pittsburgh, PA | 3.0 | 1.0 | 1560 | $1,550 | $0.99 | 9d | 1 | 1.06mi |
Listing history 16 events
-
2026-06-21days on market $72,900 Active 76 DOM
-
2026-06-18days on market $72,900 Active 73 DOM
-
2026-06-17days on market $72,900 Active 72 DOM
-
2026-06-16days on market $72,900 Active 71 DOM
-
2026-06-15days on market $72,900 Active 70 DOM
-
2026-06-13days on market $72,900 Active 68 DOM
-
2026-06-13days on market $72,900 Active 67 DOM
-
2026-06-09days on market $72,900 Active 64 DOM
-
2026-06-08days on market $72,900 Active 63 DOM
-
2026-06-07days on market $72,900 Active 62 DOM
-
2026-06-05days on market $72,900 Active 59 DOM
-
2026-06-03days on market $72,900 Active 58 DOM
-
2026-06-02days on market $72,900 Active 57 DOM
-
2026-06-01days on market $72,900 Active 56 DOM
-
2026-05-31days on market $72,900 Active 55 DOM
-
2026-04-06$72,900 Active 414-char remark
Show marketing remark (414 chars)
A Diamond in the rough, here are some property Highlights starting with the condition: The home requires a complete restoration and is being sold strictly as-is. Parking: Includes 2-car off-street parking, a valuable feature in this residential area. Nature Views: The property features views of nature from the back window, often described as overlooking a wooded yard area typical of Brentwood's hilly landscape.
ⓘ Source: listings_history table (triggers on properties + properties_extension) + one-shot
backfill from property_details.listing_events for pre-trigger history.
Climate risk First Street
- Flood 1/10 Low FEMA zone X (unshaded) · 0% chance over 30 yrs
- Wildfire 1/10 Low
- Heat 3/10 Moderate 7 d/yr ≥96°F today · 17 d/yr by 30 yrs out
- Wind 2/10 Low
- Air quality 3/10 Moderate 3 unhealthy d/yr today · 5 by 30 yrs out
Nearby sold comps map
Loading sold comps map…
Walkable amenities ~0.75 mi
Loading nearby amenities…
Taxation est. · year 1
- Rental income
- $17,446
- − Mortgage interest
- −$4,084
- − Property taxes
- −$1,094
- − Insurance
- −$364
- − Repairs & maintenance
- −$1,396
- − Management
- −$1,396
- − Depreciation
- −$2,121
- Taxable income
- $6,992
- Est. tax owed @ 24.0%
- −$1,678
- After-tax cash flow
- $6,058/yr
For passive investors: Depreciation is non-cash, so a rental often shows a tax loss while cash-flowing — sheltering income. Rental losses are passive: they offset passive income freely, and up to $25,000/yr can offset ordinary (W-2) income if you actively participate and your MAGI is under $100k (phasing out to $0 by $150k); unused losses carry forward. On sale, claimed depreciation is recaptured at up to 25%, and gains may owe capital-gains tax (a 1031 exchange can defer both). Figures are a year-1 estimate at your 24.0% rate — not tax advice; consult a CPA.
Schools (NCES district)
- District
- Brentwood Borough SD
- NCES district ID
- 4204140
- Math proficiency
- 29% ▼ -15.00%
- Reading proficiency
- 50% ▼ -15.00%
- Median HH income
- $49,260
- Composite
- 33.92/100
- National rank
- #5341
- State rank
- #357 of 539 in PA
Livability — Brentwood
- Score
- 81/100
- State rank
- #178
- US rank
- #1479
Category grades
Schools grade is shown separately in the Schools card above.
Census & demographics
- Census place
- Brentwood, PA
- County
- Allegheny County · 1,022,028 people
- City population
- 28,460
- Metro
- Pittsburgh, PA
- Population (ZIP)
- 28,460
- Household income
- $75,448
- Rent vs Own
- Severe rent burden
- 780.0
Population outlook (Allegheny County) Hauer SSP2
- Today (2025)
- 1,250,282 people
- By 2030
- 1,256,482 · +0.5%
- By 2040
- 1,256,318 · +0.5%
- By 2050
- 1,244,169 · -0.5%
- By 2075
- 1,197,693 · -4.2%
- By 2100
- 1,093,187 · -12.6%
Race, ethnicity, and origin ACS 2023
- Neighborhood character
- Predominantly White (80%)
- Race & ethnicity
- White 80% Black 7% Asian 6% Two or more races 5% Hispanic / Latino 1%
- Common ancestry
- Romanian 9% Scotch-Irish 2% Slovak 1%
- Foreign-born
- 9% · India, Canada, China
- Languages at home
- 89% English-only · Other Indo-European 6% Other Asian/Pacific 1% French/Haitian/Cajun 1%
Political lean MEDSL · Allegheny
- 2024 margin
- Strong D (+20.3) · D 59.7% · R 39.4%
- 2008→2024 swing
- +4.8pp toward D · 2008: 15.5pp · 2024: 20.3pp
- All cycles
- 2024: D+20.3 2020: D+20.4 2016: D+16.4 2012: D+14.4 2008: D+15.5
Not yet ingested
- Civics
- —
Market trends
- HPI YoY
- ▼ -92.53%
- Current HPI
- 243.6383
- Rent YoY
- ▲ 4.33%
- Metro
- Pittsburgh, PA
- State GDP YoY
- ▲ 1.68%
- F500 in state
- 34
Industry mix (Fortune 500 HQ in PA)
| Industry | F500 HQs | Revenue |
|---|---|---|
| Healthcare | 2 | $309B |
|
||
| Insurance | 2 | $27B |
|
||
| Telecommunications / Media | 1 | $124B |
|
||
| Industrial Distribution | 1 | $22B |
|
||
| Financial Services | 1 | $20B |
|
||
| Chemicals / Materials | 1 | $18B |
|
||
Price history
1 event — show timeline
- 2026-04-06 Listed $72,900 West Penn MLS
Property tax history
+4.8%/yrLatest (2026): $4,859 · +32.3% YoY. Source: county tax records.
Cash-flow waterfall
monthlySold comps — $/sqft
last 12 mo · ≤1 miLoading sold comps…