 Fourplex
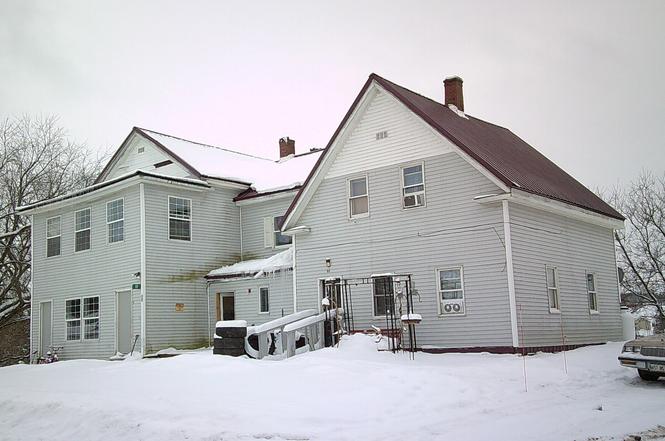
90 Pondview St · Limestone, ME
Flood risk 1/10 · Minimal
- FEMA flood zone
- X
- Chance of flooding over 30 yrs
- 0.0%
- Est. flood insurance / yr
- $507 – $1,088
Fire risk 2/10 · Minimal
- Est. fire insurance / yr
- $669 – $1,243
Heat risk 1/10 · Minimal
- Hot days now (above 86°F)
- 7 days/yr
- Hot days in 30 yrs
- 14 days/yr
Wind risk 4/10 · Minor
- Chance of severe wind over 30 yrs
- 13.0%
Air-quality risk 1/10 · Minimal
- Unhealthy air days now
- 0 days/yr
- Unhealthy air days in 30 yrs
- 0 days/yr
Risk factors via First Street. Map © Google.
Why this score? — see what drove the C- grade
The composite is a weighted blend of 9 inputs, each scored 0–100. Each bar is that input's sub-score; the figure is the points it added to the 100-point composite (weight × sub-score).
- Cash flow +17.6/30.0
- ARV discount +7.5/15.0
- Appreciation +5.9/10.0
- DSCR +5.5/10.0
- Schools +5.0/10.0
- 1% rule +4.0/10.0
- Livability +3.8/5.0
- Rent growth +2.5/5.0
- Condition / age +2.5/5.0
$140,000
🖨 Deal sheet 📄 Offer letter ✓ Due diligence
Multi-family units
County records classify this as Multi-Family (2-4 Unit). Listing-text estimate: 4 units. confirmed
Listing remarks
Investment opportunity with this four unit multi-family. Great rental history and close to Loring Commerce Centre.
Key facts
- Rental history
- 0.8 acre lot
- Garage
Tags
Property features AI
Finance
- Other: Annual tax information available (not included per instructions)
- Financial info: Property configured as a 4-unit building; Gross income reported at $41,880; Operating expenses reported at $32,000; Unit rents shown: $1,000, $1,000, $640, $850
Exterior
- Parking: Detached 1-car garage; Additional detached vehicle storage; On-site gravel parking for 5–10 vehicles; Off-street parking available
- Utilities: Public water; Public sewer; Utilities currently on
- Home design: Multi-level building; Residential zoning
- Construction: Vinyl siding and wood frame construction; Stone and concrete perimeter foundation; Pitched metal roof; Building area approximately 2,700 sq. ft.; Year built not specified
- Exterior features: Paved road access; Detached garage and vehicle storage; Gravel on-site parking and off-street parking; 5–10 parking spaces on site; Interior lot
Interior
- Kitchen: Refrigerators included in each unit
- Bedrooms: Unit A: 2 bedrooms (first level); Unit B: 3 bedrooms (first level); Unit C: 1 bedroom (first level); Unit D: 2 bedrooms (first level)
- Flooring: Wood flooring; Vinyl flooring; Laminate flooring; Carpet
- Bathrooms: Four full bathrooms (total for the building)
- Heating & cooling: Forced air heating; Circuit breaker electrical system
- Interior features: Open, level lot setting near town in a neighborhood; Unfinished basement with exterior-only entry
- Laundry & utility: On-demand water heater; Dedicated electric meters for each unit
Neighborhood map
What this means for you Summary
Snapshot
- This is a 8-bed/4.0-bath multifamily listed at $140k.
Deal economics
- At list price, monthly cash flow is $111 ($1k/yr) — positive. Per door: $28/mo.
- The deal already cash-flows at list — no discount required.
- To meet the 1% rule (rent ≥ 1% of price), the offer needs to be $127k (9.6% below list).
- Recommended offer: $123k (12.0% below list) — sets the bar for market timing.
Location & tenants
- Location reads 75/100 on livability (#36 in ME, #3,831 nationally) — a middle-class / working-renter tenant base. Strengths: crime A+, cost of living A+, housing A+; Watch: amenities F, commute F, employment F.
- Market conditions: 27 active listings in the ZIP; 112 units permitted in Aroostook County in 2024 (45 in 5+ unit buildings).
Forward outlook
- In year one you build about $3k of equity ($968 loan paydown + $2k appreciation (1.7% local appreciation)).
- Aroostook County population projected at -33% by 2050 — secular population decline; favor cash flow + early exit over multi-decade hold.
- At projected returns (1.7% appreciation + 3.0% rent growth), your $39k cash investment doubles in ~7 years — after that, you're playing with house money.
- By year 10, paydown + projected appreciation supports a ~$34k cash-out refi (75% LTV) — recoverable capital for the next deal without selling this one.
Negotiation context
- It's been on market 142 days — a 12% lower offer ($123k) is reasonable based on typical stale-listing flexibility.
- 5 sale attempts with the ask held roughly flat each time — persistent listings suggest the price (not the market) is what's stuck; bring a comps-based counter.
Questions for the listing agent
- It's been on market 142 days. Have you received any prior offers? Is the seller open to a 12% concession, seller financing, or rate buy-down credit?
- Can we see the unit-by-unit rent roll, current vacancy, and any below-market leases? What's the average tenancy length?
- What capital expenditures (roof, boiler, parking lot, exteriors) have been made in the last 5 years, and what's planned in the next 2?
- Why hasn't it sold? Are there any deal-killer items the seller is aware of (foundation, flood, title, zoning, code violations)?
- Is there a deadline driving the sale (1031 exchange, divorce, estate, relocation)? That informs how much negotiation room exists.
- Schools are B-rated — typically a magnet for longer-tenancy family renters. What's the average tenant stay here, and is there a school-zone premium baked into asking?
- What's the average days-on-market for RENTAL listings here right now (not sales)? A rising rental-DOM trend means longer vacancies and softer asking-rent achievability than the comps imply.
- What's the recent tenant-quality profile in this submarket — average credit score on applications, eviction rate, late-payment / NSF rate, and stable-employment percentage? A property-management company in the area should have these aggregated.
- How much new apartment / multifamily construction is in the pipeline within 1–3 miles? Heavy new supply (>2% of stock underway) typically softens rents 12–24 months out; light construction supports rent growth.
Investment metrics
- 1% rule
- 0.90% ✗
- Cap rate
- 7.25%
- Cash-on-cash
- 3.40%
- DSCR
- 1.15
- GRM
- 9.2
CMA / ARV
No comps found within radius.
Show comp detail 2 sales within ~0.75 mi
| Address | Dist | Beds/Ba | Sqft | Sold | Price | $/sf | Match |
|---|---|---|---|---|---|---|---|
| 5 Burleigh Ave | 0.61mi | 8/4.0 | 3,100 | 16mo | $127,500 | $41 | 46 |
| 47 Main St | 0.56mi | 8/5.0 | 3,760 | 21mo | $170,000 | $45 | 40 |
Match score weights: distance 35% · size 25% · config 20% · recency 20%. Top-matched comps best support the ARV.
Projected returns pro-forma
1.73% appreciation · 3.0% rent growth · sell at horizon
- IRR
- 7.1%
- Equity multiple
- 1.38×
- Total profit
- $14,743
- Equity at exit
- $53,196
- IRR
- 10.6%
- Equity multiple
- 2.39×
- Total profit
- $54,569
- Equity at exit
- $75,078
Cash invested: $39,200 (down + closing). Projections, not guarantees.
Landlord ↔ Tenant lean methodology
- Overall (STATE)
- 41 Moderately Tenant-Leaning
- State Maine
- 41 Moderately Tenant-Leaning · D+2
- County
- — inherits STATE
- City
- — inherits STATE
ZIP-level market 04750
- Home prices YoY
- 1.0%
- Active inventory
- 27
- Price-to-rent
- 9.2×
Monthly cashflow live
- Estimated rent
- $1,265 medium interval (Pro) →
- Mortgage (P&I)
- −$734
- Tax from tax record
- −$96 /mo · $1,153/yr
- Insurance
- −$58
- HOA
- −$0
- Vacancy / Maint / Mgmt
- −$266
- Net cashflow
- $111
Break-even live
UW: 25.0% down · 7.5% · 30yr · 1.5% tax · 5.0% vac · 8.0% maint · 8.0% mgmt
Financing live
Cash to close
- Down payment
- $35,000
- Closing costs
- $4,200
- Reserves months
- —
- Total cash needed
- —
Loan-product check · same deal, 3 products live
Conventional
25% down · 7.5% · 30yr
- Down + closing
- —
- Monthly P&I
- —
- Monthly cashflow
- —
- DSCR
- —
- Eligible?
- —
Personal DTI + credit; lowest rate.
DSCR
20% down · 8.5% · 30yr
- Down + closing
- —
- Monthly P&I
- —
- Monthly cashflow
- —
- DSCR
- —
- Eligible?
- —
No personal income docs; deal must DSCR.
Hard money
10% down · 12.0% · 12mo
- Down + closing
- —
- Monthly P&I
- —
- Monthly cashflow
- —
- DSCR
- —
- Eligible?
- —
Short-term bridge; refi at stabilization.
Listing history 25 events
-
2026-06-18days on market $140,000 Active 142 DOM
-
2026-06-17days on market $140,000 Active 141 DOM
-
2026-06-16days on market $140,000 Active 140 DOM
-
2026-06-15days on market $140,000 Active 139 DOM
-
2026-06-13days on market $140,000 Active 137 DOM
-
2026-06-12days on market $140,000 Active 136 DOM
-
2026-06-09days on market $140,000 Active 133 DOM
-
2026-06-08days on market $140,000 Active 132 DOM
-
2026-06-07days on market $140,000 Active 131 DOM
-
2026-06-07days on market $140,000 Active 130 DOM
-
2026-06-04days on market $140,000 Active 127 DOM
-
2026-06-02days on market $140,000 Active 126 DOM
-
2026-06-01days on market $140,000 Active 125 DOM
-
2026-05-31days on market $140,000 Active 124 DOM
-
2026-05-31days on market $140,000 Active 123 DOM
-
2026-01-27$140,000 Active
-
2025-02-26historical $850
-
2025-02-20$850
-
2025-02-04historical $850
-
2025-02-03$850
-
2025-01-25historical $850
-
2025-01-25historical $850
-
2025-01-25$850
-
2025-01-25$1,000
-
2024-03-14price $3,650,000
ⓘ Source: listings_history table (triggers on properties + properties_extension) + one-shot
backfill from property_details.listing_events for pre-trigger history.
Tax reassessment forecast ME · Partial reset (capped growth)
- Current annual tax
- $1,153 · $96/mo
- Projected year-2 tax
- $1,528 · $127/mo
- Expected delta
- +$376/yr (+$31/mo · 32.6%)
ⓘ Screening estimate from a state-policy table — verify with the county assessor before closing.
Climate risk First Street
- Flood 1/10 Low FEMA zone X · 0% chance over 30 yrs
- Wildfire 2/10 Low
- Heat 1/10 Low 7 d/yr ≥86°F today · 14 d/yr by 30 yrs out
- Wind 4/10 Moderate 13% chance of damaging wind over 30 yrs
- Air quality 1/10 Low 0 unhealthy d/yr today · 0 by 30 yrs out
Nearby sold comps map
Loading sold comps map…
Walkable amenities ~0.75 mi
Loading nearby amenities…
Taxation est. · year 1
- Rental income
- $15,185
- − Mortgage interest
- −$7,842
- − Property taxes
- −$1,153
- − Insurance
- −$700
- − Repairs & maintenance
- −$1,215
- − Management
- −$1,215
- − Depreciation
- −$4,073
- Taxable loss
- −$1,012
- Est. tax savings @ 24.0%
- +$243
- After-tax cash flow
- $1,576/yr
For passive investors: Depreciation is non-cash, so a rental often shows a tax loss while cash-flowing — sheltering income. Rental losses are passive: they offset passive income freely, and up to $25,000/yr can offset ordinary (W-2) income if you actively participate and your MAGI is under $100k (phasing out to $0 by $150k); unused losses carry forward. On sale, claimed depreciation is recaptured at up to 25%, and gains may owe capital-gains tax (a 1031 exchange can defer both). Figures are a year-1 estimate at your 24.0% rate — not tax advice; consult a CPA.
Schools (NCES district)
No district data.
Livability — Limestone
- Score
- 75/100
- State rank
- #36
- US rank
- #3831
Category grades
Schools grade is shown separately in the Schools card above.
Census & demographics
- Census place
- Limestone, ME
- Population (ZIP)
- 1,828
Population outlook (Aroostook County) Hauer SSP2
- Today (2025)
- 61,905 people
- By 2030
- 57,815 · -6.6%
- By 2040
- 49,240 · -20.5%
- By 2050
- 41,386 · -33.1%
- By 2075
- 27,664 · -55.3%
- By 2100
- 18,974 · -69.3%
Race, ethnicity, and origin ACS 2023
- Neighborhood character
- Predominantly White (91%)
- Race & ethnicity
- White 91% Native American 4% Two or more races 3%
- Common ancestry
- Lithuanian 24% Slovak 6% German 2%
- Foreign-born
- 5% · Canada, China
- Languages at home
- 91% English-only · French/Haitian/Cajun 5% Arabic 2%
Political lean MEDSL · Aroostook
- 2024 margin
- Strong R (+26.2) · D 36.2% · R 62.4% · Other 1.4%
- 2008→2024 swing
- -35.8pp toward R · 2008: 9.6pp · 2024: -26.2pp
- All cycles
- 2024: R+26.2 2020: R+19.9 2016: R+17.3 2012: D+7.7 2008: D+9.6
Not yet ingested
- Civics
- —
Market trends
- HPI YoY
- ▲ 1.73%
- Current HPI
- 170.0936
- Rent YoY
- —
- Metro
- —
- State GDP YoY
- —
- F500 in state
- 0
Price history
-96.2% since first listed10 events — show timeline
- 2026-01-27 Listed $140,000 MREIS
- 2025-02-26 Rental Removed $850 RENTALBEAST
- 2025-02-20 Listed for Rent $850 RENTALBEAST
- 2025-02-04 Rental Removed $850 RENTALBEAST
- 2025-02-03 Listed for Rent $850 RENTALBEAST
- 2025-01-25 Rental Removed $850 RENTALBEAST
- 2025-01-25 Rental Removed $850 RENTALBEAST
- 2025-01-25 Listed for Rent $850 RENTALBEAST
- 2025-01-25 Listed for Rent $1,000 RENTALBEAST
- 2024-03-14 Price Changed $3,650,000 MREIS
Cash-flow waterfall
monthlySold comps — $/sqft
last 12 mo · ≤1 miLoading sold comps…