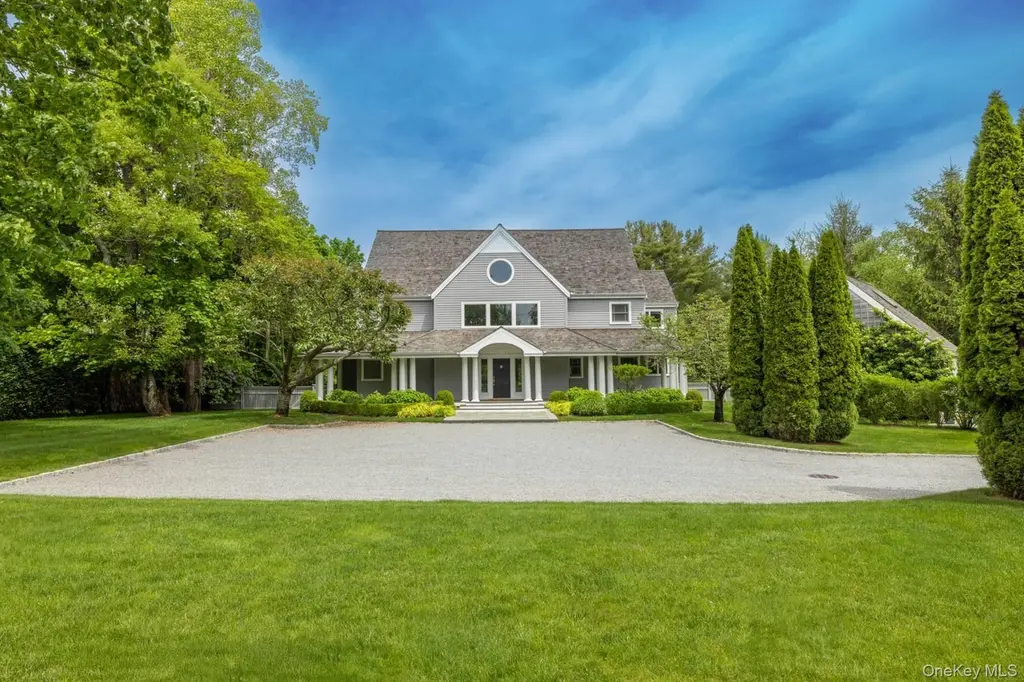
81 Upper Seven Ponds Rd · Water Mill, NY
Flood risk 1/10 · Minimal
- FEMA flood zone
- X (unshaded)
- Chance of flooding over 30 yrs
- 0.0%
- Est. flood insurance / yr
- $473 – $860
Fire risk 1/10 · Minimal
- Est. fire insurance / yr
- $691 – $1,283
Heat risk 4/10 · Minor
- Hot days now (above 90°F)
- 7 days/yr
- Hot days in 30 yrs
- 19 days/yr
Wind risk 8/10 · Major
- Chance of severe wind over 30 yrs
- 80.0%
Air-quality risk 3/10 · Minor
- Unhealthy air days now
- 3 days/yr
- Unhealthy air days in 30 yrs
- 4 days/yr
Risk factors via First Street. Map © Google.
Why this score? — see what drove the B grade
The composite is a weighted blend of 9 inputs, each scored 0–100. Each bar is that input's sub-score; the figure is the points it added to the 100-point composite (weight × sub-score).
- Cash flow +23.7/30.0
- Appreciation +9.3/10.0
- DSCR +7.6/10.0
- ARV discount +7.5/15.0
- 1% rule +6.2/10.0
- Rent growth +5.0/5.0
- Schools +4.8/10.0
- Condition / age +4.0/5.0
- Livability +3.6/5.0
$4,700,000
🖨 Deal sheet 📄 Offer letter ✓ Due diligence
Listing remarks
WATER MILL HIDEAWAY Set on a quiet private block in the heart of Water Mill, this classic Hamptons retreat offers timeless style, modern comfort, and exceptional privacy on 1.2 acres. The traditional residence spans 4,000 +/- SF, plus a large finished lower level, with 4 bedrooms, 4.5 baths, a 2-car garage, heated gunite pool, and pool house. Inside, the home is bright, open, and inviting, with a thoughtful floor plan designed for both everyday living and easy entertaining. The living room, dining area, and kitchen flow seamlessly together, framed by large windows that bring in natural light and views of the surrounding landscaping. A well-appointed gourmet kitchen features top-of-the-line
Key facts
- Gourmet kitchen
- Pool house
- Outdoor shower
Tags
Neighborhood map
What this means for you Summary
Snapshot
- This is a 4-bed/3.5-bath single-family listed at $4.70M. Condition is rated good.
Deal economics
- At list price, monthly cash flow is $9k ($108k/yr) — positive.
- The deal already cash-flows at list — no discount required.
- Meets the 1% rule at list price ($52k rent vs $4.70M).
- Recommended offer: $4.63M (1.5% below list) — sets the bar for market timing.
Location & tenants
- Location reads 71/100 on livability (#410 in NY) — a middle-class / working-renter tenant base. Strengths: crime A+, employment A+, commute A-; Watch: amenities F, cost of living F, housing F.
- Southampton Union Free School District (suburban): math 53% / reading 51% proficiency, ranked #293 of 590 in NY (top 50%) — acceptable for families but not a draw, mixed tenant base, ~2y average lease.
- Zoned schools: Southampton Elementary School (math 42% / reading 57%, grade D, #1,085 of 2,108 statewide, top 56%, 376 students, 51% FRL); Southampton Intermediate School (math 30% / reading 47%, grade F, #437 of 729 statewide, top 60%, 363 students, 44% FRL); Southampton High School (math 98%, 595 students, 48% FRL) — zoned schools average 48% FRL vs 30% district-wide (17 pts higher); higher-poverty schools than district average — tighter screening recommended.
- Market conditions: Rents rising fast (+30.1%/yr); 52 active listings in the ZIP; 4 comparable units currently listed for rent nearby; rentals lingering (median 44d on market — plan ~5-8 weeks vacancy on turnover, expect pricing pressure); 50% of comp listings sitting > 30 days — soft ceiling on asking rent; high-income renter base; 1,366 units permitted in Suffolk County in 2024 (216 in 5+ unit buildings).
- At $52,469/mo this rent would consume 349% of the median local household income ($180k/yr) — very limited rent-growth headroom before tenants either downsize or default.
Forward outlook
- In year one you build about $438k of equity ($32k loan paydown + $406k appreciation (8.6% local appreciation)).
- Suffolk County population projected to shrink 5% by 2050 — rents likely to lag national; underwrite the cash flow, not the appreciation.
- At projected returns (8.6% appreciation + 8.0% rent growth), your $1.32M cash investment doubles in ~3 years — after that, you're playing with house money.
- By year 2, paydown + projected appreciation supports a ~$702k cash-out refi (75% LTV) — recoverable capital for the next deal without selling this one.
Negotiation context
- It's been on market 29 days — a 2% lower offer ($4.63M) is reasonable based on typical stale-listing flexibility.
Risks & watch-outs
- Climate carrying-cost: severe wind risk, 80% chance of damaging wind over 30y — expect insurance premiums to compound above CPI over the hold.
Questions for the listing agent
- Is there a deadline driving the sale (1031 exchange, divorce, estate, relocation)? That informs how much negotiation room exists.
- What's the average days-on-market for RENTAL listings here right now (not sales)? A rising rental-DOM trend means longer vacancies and softer asking-rent achievability than the comps imply.
- What's the recent tenant-quality profile in this submarket — average credit score on applications, eviction rate, late-payment / NSF rate, and stable-employment percentage? A property-management company in the area should have these aggregated.
- How much new for-sale + rental construction is in the pipeline within 1–3 miles? Heavy new supply typically softens prices + rents 12–24 months out; constrained supply supports both.
Investment metrics
- 1% rule
- 1.12% ✓
- Cap rate
- 8.58%
- Cash-on-cash
- 8.18%
- DSCR
- 1.36
- GRM
- 7.5
CMA / ARV
No comps found within radius.
Projected returns pro-forma
8.63% appreciation · 8.0% rent growth · sell at horizon
- IRR
- 29.9%
- Equity multiple
- 3.26×
- Total profit
- $2,976,940
- Equity at exit
- $3,774,361
- IRR
- 28.2%
- Equity multiple
- 7.78×
- Total profit
- $8,928,759
- Equity at exit
- $7,695,111
Cash invested: $1,316,000 (down + closing). Projections, not guarantees.
Landlord ↔ Tenant lean methodology
- Overall (STATE)
- 15 Strongly Tenant-Friendly
- State New York
- 15 Strongly Tenant-Friendly · D+10
- County
- — inherits STATE
- City
- — inherits STATE
ZIP-level market 11976
- Home prices YoY
- 1.6%
- Rents YoY
- 30.1%
- Active inventory
- 52
- Price-to-rent
- 7.5×
Monthly cashflow live
- Estimated rent
- $52,469 medium interval (Pro) →
- Mortgage (P&I)
- −$24,647
- Tax est. 1.5%
- −$5,875 /mo · $70,500/yr
- Insurance
- −$1,958
- HOA
- −$0
- Vacancy / Maint / Mgmt
- −$11,019
- Net cashflow
- $8,970
Break-even live
UW: 25.0% down · 7.5% · 30yr · 1.5% tax · 5.0% vac · 8.0% maint · 8.0% mgmt
Financing live
Cash to close
- Down payment
- $1,175,000
- Closing costs
- $141,000
- Reserves months
- —
- Total cash needed
- —
Loan-product check · same deal, 3 products live
Conventional
25% down · 7.5% · 30yr
- Down + closing
- —
- Monthly P&I
- —
- Monthly cashflow
- —
- DSCR
- —
- Eligible?
- —
Personal DTI + credit; lowest rate.
DSCR
20% down · 8.5% · 30yr
- Down + closing
- —
- Monthly P&I
- —
- Monthly cashflow
- —
- DSCR
- —
- Eligible?
- —
No personal income docs; deal must DSCR.
Hard money
10% down · 12.0% · 12mo
- Down + closing
- —
- Monthly P&I
- —
- Monthly cashflow
- —
- DSCR
- —
- Eligible?
- —
Short-term bridge; refi at stabilization.
Rent comps 4 comps
| Address | Beds | Baths | Sqft | Rent | $/sqft | DOM | Units | Dist |
|---|---|---|---|---|---|---|---|---|
| 20 Millfarm Ln Southampton, NY | 5.0 | 5.5 | 4500 | $25,000 | $5.56 | 11d | 1 | 0.45mi |
| 64 Water Mill Towd Rd Water Mill, NY | 4.0 | 4.0 | 3800 | $55,000 | $14.47 | 44d | 1 | 0.82mi |
| 4 Carriage Ln Southampton, NY | 4.0 | 4.0 | 3000 | $72,000 | $24.00 | 44d | 1 | 0.91mi |
| 17 Clearview Farm Rd Southampton, NY | 4.0 | 4.5 | 4000 | $28,000 | $7.00 | 5d | 1 | 1.22mi |
Listing history 15 events
-
2026-06-18days on market $4,700,000 Active 29 DOM
-
2026-06-17days on market $4,700,000 Active 28 DOM
-
2026-06-16days on market $4,700,000 Active 27 DOM
-
2026-06-15days on market $4,700,000 Active 26 DOM
-
2026-06-13days on market $4,700,000 Active 24 DOM
-
2026-06-13days on market $4,700,000 Active 23 DOM
-
2026-06-09days on market $4,700,000 Active 20 DOM
-
2026-06-08days on market $4,700,000 Active 19 DOM
-
2026-06-07days on market $4,700,000 Active 18 DOM
-
2026-06-04days on market $4,700,000 Active 15 DOM
-
2026-06-03days on market $4,700,000 Active 14 DOM
-
2026-06-02days on market $4,700,000 Active 13 DOM
-
2026-06-01days on market $4,700,000 Active 12 DOM
-
2026-05-31days on market $4,700,000 Active 11 DOM
-
2026-05-01$4,700,000 Active
ⓘ Source: listings_history table (triggers on properties + properties_extension) + one-shot
backfill from property_details.listing_events for pre-trigger history.
Climate risk First Street
- Flood 1/10 Low FEMA zone X (unshaded) · 0% chance over 30 yrs
- Wildfire 1/10 Low
- Heat 4/10 Moderate 7 d/yr ≥90°F today · 19 d/yr by 30 yrs out
- Wind 8/10 Severe 80% chance of damaging wind over 30 yrs
- Air quality 3/10 Moderate 3 unhealthy d/yr today · 4 by 30 yrs out
Nearby sold comps map
Loading sold comps map…
Walkable amenities ~0.75 mi
Loading nearby amenities…
Taxation est. · year 1
- Rental income
- $629,629
- − Mortgage interest
- −$263,273
- − Property taxes
- −$70,500
- − Insurance
- −$23,500
- − Repairs & maintenance
- −$50,370
- − Management
- −$50,370
- − Depreciation
- −$136,727
- Taxable income
- $34,888
- Est. tax owed @ 24.0%
- −$8,373
- After-tax cash flow
- $99,266/yr
For passive investors: Depreciation is non-cash, so a rental often shows a tax loss while cash-flowing — sheltering income. Rental losses are passive: they offset passive income freely, and up to $25,000/yr can offset ordinary (W-2) income if you actively participate and your MAGI is under $100k (phasing out to $0 by $150k); unused losses carry forward. On sale, claimed depreciation is recaptured at up to 25%, and gains may owe capital-gains tax (a 1031 exchange can defer both). Figures are a year-1 estimate at your 24.0% rate — not tax advice; consult a CPA.
Condition & rehab AI · 12 photos
This well-maintained, spacious single-family home in Water Mill offers a good condition with a good condition score of 80. It is ready for a fresh coat of paint and some landscaping to enhance its curb appeal and value.
Value-add opportunities
- Both Painting exterior and interior walls — Fresh paint enhances curb appeal and interior aesthetics
- Both Landscaping and pool maintenance — Maintaining the lush greenery and pool area improves curb appeal and adds value
- Resale Updating kitchen appliances — Modernizing the kitchen with new appliances would appeal to potential buyers
- Both Adding smart home features — Smart home features improve convenience and add value for both buyers and renters
Renovation cost estimate screening
Value-add ROI direction
- Both Painting exterior and interior walls — Fresh paint enhances curb appeal and interior aesthetics ↑
- Both Landscaping and pool maintenance — Maintaining the lush greenery and pool area improves curb appeal and adds value ↑
- Resale Updating kitchen appliances — Modernizing the kitchen with new appliances would appeal to potential buyers ↑
- Both Adding smart home features — Smart home features improve convenience and add value for both buyers and renters ↑
ⓘ Cost ranges are severity-bucket heuristics (US national rule-of-thumb). Get contractor quotes + a written scope before underwriting a rehab budget.
Schools (NCES district)
- District
- Southampton Union Free School District
- NCES district ID
- 3627540
- Math proficiency
- 53% ▬ 0.00%
- Reading proficiency
- 51% ▲ 4.00%
- Median HH income
- $85,977
- Composite
- 47.9/100
- National rank
- #2213
- State rank
- #293 of 590 in NY
Livability — Water Mill
- Score
- 71/100
- State rank
- #410
- US rank
- #7088
Category grades
Schools grade is shown separately in the Schools card above.
Census & demographics
- Census place
- Water Mill, NY
- County
- Suffolk County · 679,920 people
- City population
- 2,952
- Metro
- New York-Newark-Jersey City, NY-NJ-PA
- Population (ZIP)
- 2,952
- Household income
- $180,250
- Rent vs Own
Population outlook (Suffolk County) Hauer SSP2
- Today (2025)
- 1,505,262 people
- By 2030
- 1,498,318 · -0.5%
- By 2040
- 1,471,101 · -2.3%
- By 2050
- 1,424,848 · -5.3%
- By 2075
- 1,337,157 · -11.2%
- By 2100
- 1,217,720 · -19.1%
Race, ethnicity, and origin ACS 2023
- Neighborhood character
- Predominantly White (87%)
- Race & ethnicity
- White 87% Hispanic / Latino 9% Two or more races 9% Asian 2%
- Hispanic origin (detail)
- Mexican 1% Salvadoran 2%
- Common ancestry
- Romanian 16% Scotch-Irish 7% Italian 3%
- Foreign-born
- 11% · Canada, China
- Languages at home
- 86% English-only · Spanish 7% Other Indo-European 4% German/W. Germanic 1%
Political lean MEDSL · Suffolk
- 2024 margin
- Lean R (+10.0) · D 45.0% · R 55.0%
- 2008→2024 swing
- -16.0pp toward R · 2008: 6.0pp · 2024: -10.0pp
- All cycles
- 2024: R+10.0 2020: R+0.0 2016: R+8.2 2012: D+2.9 2008: D+6.0
Not yet ingested
- Civics
- —
Market trends
- HPI YoY
- ▲ 8.63%
- Current HPI
- 540.0967
- Rent YoY
- ▲ 30.05%
- Metro
- New York-Newark-Jersey City, NY-NJ-PA
- State GDP YoY
- ▲ 2.60%
- F500 in state
- 92
Industry mix (Fortune 500 HQ in NY)
| Industry | F500 HQs | Revenue |
|---|---|---|
| Financial Services | 10 | $950B |
|
||
| Consumer Goods | 9 | $162B |
|
||
| Insurance | 4 | $225B |
|
||
| Telecommunications | 2 | $144B |
|
||
| Pharmaceuticals | 2 | $112B |
|
||
| Media / Entertainment | 2 | $69B |
|
||
Price history
1 event — show timeline
- 2026-05-01 Listed $4,700,000 OneKey® MLS as Distributed by MLS Grid
Cash-flow waterfall
monthlySold comps — $/sqft
last 12 mo · ≤1 miLoading sold comps…