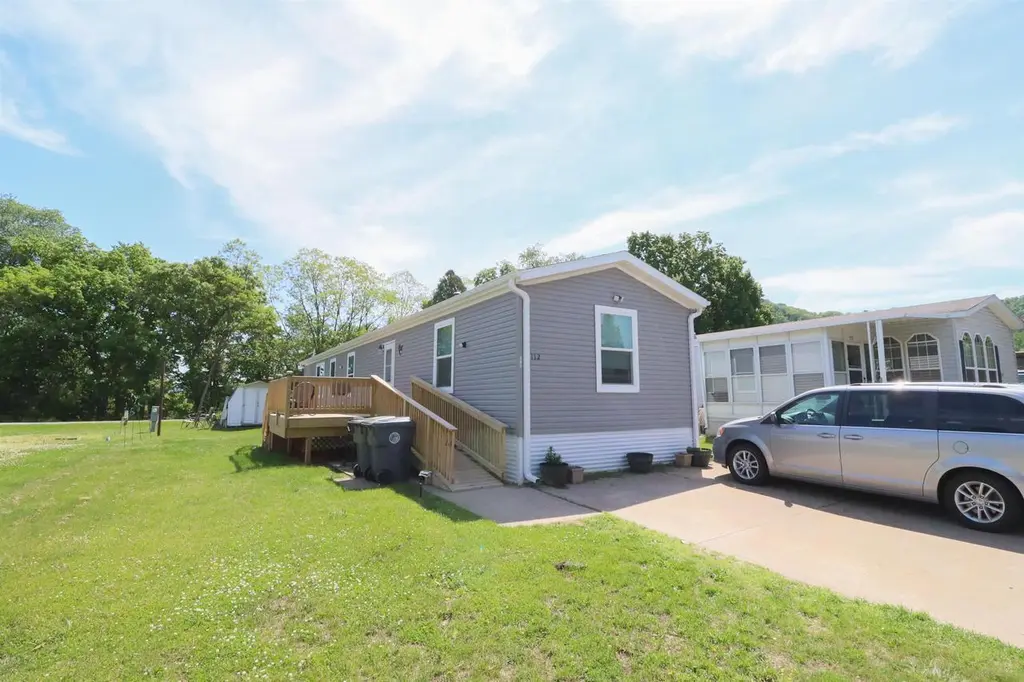
W5585 Cty Rd. Mm Rd #112 · La Crosse, WI
Flood risk 1/10 · Minimal
- FEMA flood zone
- X (unshaded)
- Chance of flooding over 30 yrs
- 0.0%
- Est. flood insurance / yr
- $507 – $1,088
Fire risk 1/10 · Minimal
- Est. fire insurance / yr
- $636 – $1,182
Heat risk 2/10 · Minimal
- Hot days now (above 99°F)
- 7 days/yr
- Hot days in 30 yrs
- 14 days/yr
Wind risk 2/10 · Minimal
- Chance of severe wind over 30 yrs
- —
Air-quality risk 1/10 · Minimal
- Unhealthy air days now
- 0 days/yr
- Unhealthy air days in 30 yrs
- 0 days/yr
Risk factors via First Street. Map © Google.
Why this score? — see what drove the C+ grade
The composite is a weighted blend of 9 inputs, each scored 0–100. Each bar is that input's sub-score; the figure is the points it added to the 100-point composite (weight × sub-score).
- Cash flow +26.4/30.0
- DSCR +9.0/10.0
- ARV discount +7.5/15.0
- 1% rule +7.1/10.0
- Condition / age +4.0/5.0
- Livability +3.5/5.0
- Rent growth +3.2/5.0
- Schools +2.7/10.0
- Appreciation +0.0/10.0
$120,000
🖨 Deal sheet 📄 Offer letter ✓ Due diligence
Listing remarks
Personal Property Sale. No LAND included. Tucked away in a quiet semi-rural park on La Crosse?s far south side (Pineview Mobile Home Park), this nearly new 2025 Mid-Country mobile home offers modern comfort with peaceful surroundings. Measuring 18x60, this spacious home features 3 bedrooms and 2 full bathrooms with an open, functional layout designed for easy living. With only one year of use, the home still feels fresh and like new, while recent upgrades, including beautiful new flooring and a brand new ramped deck, add both style and convenience. The property also includes 2 garden sheds for extra storage plus all major appliances ? washer, dryer, refrigerator, and stove ? making this hom
Key facts
- Recent upgrades
- 2 garden sheds
- New flooring
Tags
Property features AI
Exterior
- Utilities: Municipal water; Municipal sewer
- Home design: Single-family home; One story; Estimated finished area about 1,140 above grade; Built year: see remarks
- Construction: Vinyl construction; Slab foundation
- Exterior features: Vinyl exterior; Deck; Two storage sheds
Interior
- Kitchen: Kitchen with island — 15 x 13; Refrigerator; Stove
- Bedrooms: Master bedroom (Main level) — 15 x 12; Bedroom 2 (Main level) — 12 x 8; Bedroom 3 (Main level) — 12 x 8
- Bathrooms: 2 full bathrooms; Master bathroom with walk-in shower
- Heating & cooling: Forced air heating; LP gas fuel
- Interior features: Walk-in closets
- Laundry & utility: Washer; Dryer
Neighborhood map
What this means for you Summary
Snapshot
- This is a 3-bed/2.0-bath single-family listed at $120k. Condition is rated good.
Deal economics
- At list price, monthly cash flow is $314 ($4k/yr) — positive.
- The deal already cash-flows at list — no discount required.
- Meets the 1% rule at list price ($1k rent vs $120k).
- Recommended offer: $118k (1.5% below list) — sets the bar for market timing.
- Cap rate 9.4% vs local median 3.0% in La Crosse — top-decile yield for the area; either an underpriced asset or a hidden risk that comps aren't pricing in. Stress-test before assuming the spread holds.
Location & tenants
- Location reads 69/100 on livability (#339 in WI) — a middle-class / working-renter tenant base. Strengths: cost of living A+, housing A+; Watch: employment C-, schools D+, health & safety D.
- La Crosse School District (urban): math 29% / reading 34% proficiency, ranked #267 of 342 in WI (top 78%) — families likely to look elsewhere, expect single-tenant / working-renter base with shorter leases.
- Market conditions: Rents rising (+2.7%/yr); 222 active listings in the ZIP; 1 comparable units currently listed for rent nearby; 268 units permitted in La Crosse County in 2024 (10 in 5+ unit buildings).
Forward outlook
- Local home prices are declining (-3.0%/yr); year-one equity from $830 of loan paydown is wiped out by about $4k of value loss. Plan a longer hold.
- La Crosse County population projected at +14% by 2050 — modest demand growth; plan on rents tracking national, not racing it.
Negotiation context
- It's been on market 18 days — a 2% lower offer ($118k) is reasonable based on typical stale-listing flexibility.
Questions for the listing agent
- Is there a deadline driving the sale (1031 exchange, divorce, estate, relocation)? That informs how much negotiation room exists.
- Schools are D-rated, which usually means shorter tenancies and higher turnover. Who's the typical renter profile here, and what's been the actual vacancy rate?
- Crime grade is F in this area — have there been break-ins, vandalism, or insurance claims at this property in the last 3 years? What carrier currently insures it and at what premium?
- What's the average days-on-market for RENTAL listings here right now (not sales)? A rising rental-DOM trend means longer vacancies and softer asking-rent achievability than the comps imply.
- What's the recent tenant-quality profile in this submarket — average credit score on applications, eviction rate, late-payment / NSF rate, and stable-employment percentage? A property-management company in the area should have these aggregated.
- How much new for-sale + rental construction is in the pipeline within 1–3 miles? Heavy new supply typically softens prices + rents 12–24 months out; constrained supply supports both.
Investment metrics
- 1% rule
- 1.21% ✓
- Cap rate
- 9.43%
- Cash-on-cash
- 11.22%
- DSCR
- 1.50
- GRM
- 6.9
CMA / ARV
No comps found within radius.
Projected returns pro-forma
-3.0% appreciation · 2.72% rent growth · sell at horizon
- IRR
- 0.1%
- Equity multiple
- 1.01×
- Total profit
- $173
- Equity at exit
- $17,892
- IRR
- 9.5%
- Equity multiple
- 1.72×
- Total profit
- $24,336
- Equity at exit
- $10,375
Cash invested: $33,600 (down + closing). Projections, not guarantees.
Landlord ↔ Tenant lean methodology
- Overall (STATE)
- 73 Landlord-Friendly
- State Wisconsin
- 73 Landlord-Friendly · R+2
- County
- — inherits STATE
- City
- — inherits STATE
ZIP-level market 54601
- Rents YoY
- 2.7%
- Active inventory
- 222
- Price-to-rent
- 6.9×
Monthly cashflow live
- Estimated rent
- $1,447 medium interval (Pro) →
- Mortgage (P&I)
- −$629
- Tax est. 1.5%
- −$150 /mo · $1,800/yr
- Insurance
- −$50
- HOA
- −$0
- Vacancy / Maint / Mgmt
- −$304
- Net cashflow
- $314
Break-even live
UW: 25.0% down · 7.5% · 30yr · 1.5% tax · 5.0% vac · 8.0% maint · 8.0% mgmt
Financing live
Cash to close
- Down payment
- $30,000
- Closing costs
- $3,600
- Reserves months
- —
- Total cash needed
- —
Loan-product check · same deal, 3 products live
Conventional
25% down · 7.5% · 30yr
- Down + closing
- —
- Monthly P&I
- —
- Monthly cashflow
- —
- DSCR
- —
- Eligible?
- —
Personal DTI + credit; lowest rate.
DSCR
20% down · 8.5% · 30yr
- Down + closing
- —
- Monthly P&I
- —
- Monthly cashflow
- —
- DSCR
- —
- Eligible?
- —
No personal income docs; deal must DSCR.
Hard money
10% down · 12.0% · 12mo
- Down + closing
- —
- Monthly P&I
- —
- Monthly cashflow
- —
- DSCR
- —
- Eligible?
- —
Short-term bridge; refi at stabilization.
Rent comps 1 comps
| Address | Beds | Baths | Sqft | Rent | $/sqft | DOM | Units | Dist |
|---|---|---|---|---|---|---|---|---|
| 3800 Cliffside Pl La Crosse, WI | 2.0 | 1.0 | 900 | $1,099 | $1.22 | 44d | 3 | 1.27mi |
Listing history 16 events
-
2026-06-19days on market $120,000 Active 18 DOM
-
2026-06-18days on market $120,000 Active 17 DOM
-
2026-06-17price $120,000 Active 16 DOM
-
2026-06-17days on market $125,000 Active 16 DOM
-
2026-06-16days on market $125,000 Active 15 DOM
-
2026-06-15days on market $125,000 Active 14 DOM
-
2026-06-14days on market $125,000 Active 12 DOM
-
2026-06-13days on market $125,000 Active 11 DOM
-
2026-06-10days on market $125,000 Active 9 DOM
-
2026-06-09days on market $125,000 Active 8 DOM
-
2026-06-08days on market $125,000 Active 7 DOM
-
2026-06-07days on market $125,000 Active 6 DOM
-
2026-06-05days on market $125,000 Active 3 DOM
-
2026-06-03days on market $125,000 Active 2 DOM
-
2026-06-02remarks 699-char remark
-
2026-06-02$125,000 Active 1 DOM
ⓘ Source: listings_history table (triggers on properties + properties_extension) + one-shot
backfill from property_details.listing_events for pre-trigger history.
Climate risk First Street
- Flood 1/10 Low FEMA zone X (unshaded) · 0% chance over 30 yrs
- Wildfire 1/10 Low
- Heat 2/10 Low 7 d/yr ≥99°F today · 14 d/yr by 30 yrs out
- Wind 2/10 Low
- Air quality 1/10 Low 0 unhealthy d/yr today · 0 by 30 yrs out
Nearby sold comps map
Loading sold comps map…
Walkable amenities ~0.75 mi
Loading nearby amenities…
Taxation est. · year 1
- Rental income
- $17,367
- − Mortgage interest
- −$6,722
- − Property taxes
- −$1,800
- − Insurance
- −$600
- − Repairs & maintenance
- −$1,389
- − Management
- −$1,389
- − Depreciation
- −$3,491
- Taxable income
- $1,976
- Est. tax owed @ 24.0%
- −$474
- After-tax cash flow
- $3,295/yr
For passive investors: Depreciation is non-cash, so a rental often shows a tax loss while cash-flowing — sheltering income. Rental losses are passive: they offset passive income freely, and up to $25,000/yr can offset ordinary (W-2) income if you actively participate and your MAGI is under $100k (phasing out to $0 by $150k); unused losses carry forward. On sale, claimed depreciation is recaptured at up to 25%, and gains may owe capital-gains tax (a 1031 exchange can defer both). Figures are a year-1 estimate at your 24.0% rate — not tax advice; consult a CPA.
Condition & rehab AI · 12 photos
This nearly new mobile home in a quiet park setting offers modern comfort and is in excellent condition with minimal repairs needed. Potential buyers and renters will appreciate the fresh paint, updated kitchen, and well-maintained exterior.
Value-add opportunities
- Both Painting exterior and interior walls — Fresh paint can enhance curb appeal and interior aesthetics
- Both Landscaping improvements — Well-maintained landscaping can increase both resale and rental value
- Both Addition of outdoor lighting — Outdoor lighting can improve safety and curb appeal
Renovation cost estimate screening
Value-add ROI direction
- Both Painting exterior and interior walls — Fresh paint can enhance curb appeal and interior aesthetics ↑
- Both Landscaping improvements — Well-maintained landscaping can increase both resale and rental value ↑
- Both Addition of outdoor lighting — Outdoor lighting can improve safety and curb appeal ↑
ⓘ Cost ranges are severity-bucket heuristics (US national rule-of-thumb). Get contractor quotes + a written scope before underwriting a rehab budget.
Schools (NCES district)
- District
- La Crosse School District
- NCES district ID
- 5507530
- Math proficiency
- 29% ▼ -8.00%
- Reading proficiency
- 34% ▼ -4.00%
- Median HH income
- $42,924
- Composite
- 26.76/100
- National rank
- #7135
- State rank
- #267 of 342 in WI
Livability — La Crosse
- Score
- 69/100
- State rank
- #339
- US rank
- #8671
Category grades
Schools grade is shown separately in the Schools card above.
Census & demographics
- Census place
- La Crosse, WI
- County
- La Crosse County · 89,439 people
- City population
- 64,135
- Metro
- La Crosse-Onalaska, WI-MN
- Population (ZIP)
- 50,397
- Household income
- $61,639
- Rent vs Own
- Severe rent burden
- 2352.0
Population outlook (La Crosse County) Hauer SSP2
- Today (2025)
- 126,082 people
- By 2030
- 130,161 · +3.2%
- By 2040
- 137,231 · +8.8%
- By 2050
- 143,506 · +13.8%
- By 2075
- 160,149 · +27.0%
- By 2100
- 166,408 · +32.0%
Race, ethnicity, and origin ACS 2023
- Neighborhood character
- Predominantly White (89%)
- Race & ethnicity
- White 89% Asian 4% Two or more races 3% Hispanic / Latino 3% Black 1%
- Common ancestry
- Portuguese 14% Romanian 6% Lithuanian 2%
- Foreign-born
- 3% · Canada
- Languages at home
- 95% English-only · Spanish 2% Other Asian/Pacific 1% Other Indo-European 1%
Political lean MEDSL · La Crosse
- 2024 margin
- Lean D (+9.4) · D 54.0% · R 44.6% · Other 1.4%
- 2008→2024 swing
- -14.1pp toward R · 2008: 23.4pp · 2024: 9.4pp
- All cycles
- 2024: D+9.4 2020: D+13.5 2016: D+9.6 2012: D+17.3 2008: D+23.4
Not yet ingested
- Civics
- —
Market trends
- HPI YoY
- ▼ -186.70%
- Current HPI
- 236.4506
- Rent YoY
- ▲ 2.72%
- Metro
- La Crosse-Onalaska, WI-MN
- State GDP YoY
- ▲ 2.10%
- F500 in state
- 20
Industry mix (Fortune 500 HQ in WI)
| Industry | F500 HQs | Revenue |
|---|---|---|
| Industrial Machinery | 4 | $23B |
|
||
| Industrial Technology | 2 | $36B |
|
||
| Insurance | 1 | $36B |
|
||
| Professional Services | 1 | $19B |
|
||
| Utilities | 1 | $9B |
|
||
| Consumer Goods | 1 | $3B |
|
||
Price history
1 event — show timeline
- 2026-05-31 Listed $125,000 SCWMLS
Cash-flow waterfall
monthlySold comps — $/sqft
last 12 mo · ≤1 miLoading sold comps…