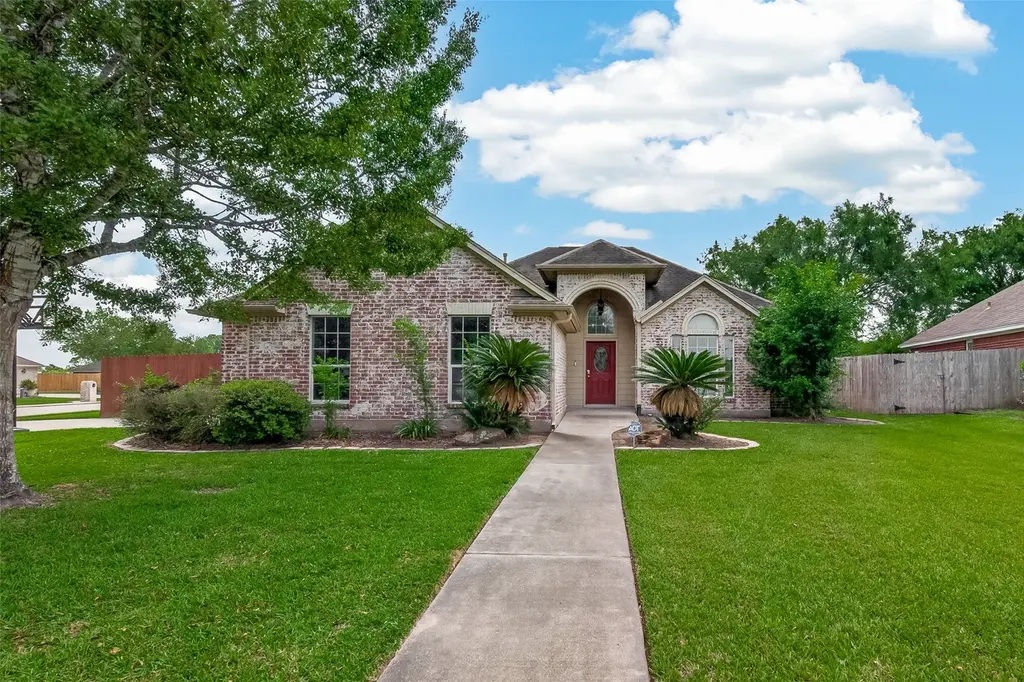
11803 Old Spanish Trl · Santa Fe, TX
Flood risk 6/10 · Moderate
- FEMA flood zone
- X (shaded)
- Chance of flooding over 30 yrs
- 0.7%
- Est. flood insurance / yr
- $507 – $1,088
Fire risk 4/10 · Minor
- Est. fire insurance / yr
- $1,222 – $2,270
Heat risk 10/10 · Severe
- Hot days now (above 110°F)
- 7 days/yr
- Hot days in 30 yrs
- 26 days/yr
Wind risk 9/10 · Severe
- Chance of severe wind over 30 yrs
- 99.0%
Air-quality risk 2/10 · Minimal
- Unhealthy air days now
- 1 days/yr
- Unhealthy air days in 30 yrs
- 1 days/yr
Risk factors via First Street. Map © Google.
Why this score? — see what drove the D grade
The composite is a weighted blend of 9 inputs, each scored 0–100. Each bar is that input's sub-score; the figure is the points it added to the 100-point composite (weight × sub-score).
- Cash flow +15.0/30.0
- ARV discount +6.1/15.0
- 1% rule +5.0/10.0
- DSCR +5.0/10.0
- Schools +3.5/10.0
- Livability +3.4/5.0
- Rent growth +2.5/5.0
- Condition / age +2.5/5.0
- Appreciation +0.0/10.0
$285,000
🖨 Deal sheet 📄 Offer letter ✓ Due diligence
Listing remarks
NEW ROOF!!! Claim your own piece of Texas charm with this impeccably maintained 1,552-square-foot home set on a prominent corner lot. This home balances modern comfort with an inviting atmosphere, warmed by a gas fireplace that serves as the centerpiece for the main living area. The interior flow is designed for maximum efficiency and ease, offering an ideal foundation for any lifestyle. The exterior is a true standout, with an oversized covered patio that expands your living space into the outdoors—perfect for sunset relaxation or weekend gatherings. Situated in Santa Fe, this property delivers the calm of a close-knit community while maintaining easy access to Houston’s dynami
Key facts
- Gas fireplace
- Corner lot
- 9,095 sq ft lot
Tags
Property features AI
Finance
- Other: No lease considered
- HOA & community: Member of Santa Fe Trails CSMI; Annual association fee of $196
Exterior
- Parking: Attached garage with 2 spaces
- Utilities: Public water; Public sewer
- Home design: Residential property; Northwest facing; Built in 2003; 1,552 living area
- Construction: Brick construction; Composition roof; Slab foundation
- Exterior features: Covered patio and deck; Patio; Corner lot; Cleared lot in a subdivision; Asphalt road access
Interior
- Kitchen: Dishwasher; Gas cooktop; Gas oven; Gas range; Microwave; Walk-in pantry
- Bedrooms: Up to 3 bedrooms
- Bathrooms: 2 full bathrooms
- Interior features: Double vanity; Separate shower and tub/shower combination; Walk-in pantry; Ceiling fans; Open living/dining area; Gas fireplace (1)
- Laundry & utility: Washer hookup; Electric dryer hookup
Neighborhood map
What this means for you Summary
Snapshot
- This is a 3-bed/2.0-bath single-family listed at $285k.
Deal economics
- At list price, monthly cash flow is $11k ($129k/yr) — positive.
- The deal already cash-flows at list — no discount required.
- Meets the 1% rule at list price ($16k rent vs $285k).
- Cap rate 51.5% vs local median 4.5% in Santa Fe — top-decile yield for the area; either an underpriced asset or a hidden risk that comps aren't pricing in. Stress-test before assuming the spread holds.
Location & tenants
- Location reads 67/100 on livability (#550 in TX) — a middle-class / working-renter tenant base. Strengths: crime A+, cost of living A+, housing A+; Watch: amenities F, commute F, health & safety F.
- Santa Fe ISD (suburban): math 38% / reading 39% proficiency, ranked #385 of 826 in TX (top 47%) — families likely to look elsewhere, expect single-tenant / working-renter base with shorter leases.
- Zoned schools: William F Barnett El (math 59% / reading 46%, grade C-, #720 of 4,322 statewide, top 17%, 646 students, 59% FRL); Santa Fe H S (math 19% / reading 34%, grade F, #1,228 of 1,632 statewide, top 76%, 1,369 students, 47% FRL) — zoned schools average 53% FRL vs 35% district-wide (18 pts higher); higher-poverty schools than district average — tighter screening recommended.
- Market conditions: 233 active listings in the ZIP; 2 comparable units currently listed for rent nearby; 3,258 units permitted in Galveston County in 2024 (0 in 5+ unit buildings).
Forward outlook
- Local home prices are declining (-3.0%/yr); year-one equity from $2k of loan paydown is wiped out by about $9k of value loss. Plan a longer hold.
- Galveston County population projected at +43% by 2050 — long-run rental-demand tailwind backs the buy-and-hold thesis.
- At projected returns (-3.0% appreciation + 3.0% rent growth), your $80k cash investment doubles in ~1 year — after that, you're playing with house money.
Negotiation context
- Only 8 days on market — expect competitive offers; lowballing is unlikely to land.
- 15 sale attempts since 13y ago with the ask held roughly flat each time — persistent listings suggest the price (not the market) is what's stuck; bring a comps-based counter.
Risks & watch-outs
- Climate carrying-cost: major flood risk; severe wind risk, 99% chance of damaging wind over 30y; extreme-heat days projected 7→26/yr by 2055 (HVAC capex compounding) — expect insurance premiums to compound above CPI over the hold.
Questions for the listing agent
- What does the HOA fee cover, when was the last increase, and are there any pending special assessments or reserve-fund shortfalls?
- Is there a deadline driving the sale (1031 exchange, divorce, estate, relocation)? That informs how much negotiation room exists.
- The area grade is low — what's the realistic commute time and amenity access for the typical tenant pool here? Any planned neighborhood developments (good or bad) we should know about?
- What's the average days-on-market for RENTAL listings here right now (not sales)? A rising rental-DOM trend means longer vacancies and softer asking-rent achievability than the comps imply.
- What's the recent tenant-quality profile in this submarket — average credit score on applications, eviction rate, late-payment / NSF rate, and stable-employment percentage? A property-management company in the area should have these aggregated.
- How much new for-sale + rental construction is in the pipeline within 1–3 miles? Heavy new supply typically softens prices + rents 12–24 months out; constrained supply supports both.
Investment metrics
- 1% rule
- 5.76% ✓
- Cap rate
- 51.52%
- Cash-on-cash
- 161.53%
- DSCR
- 8.19
- GRM
- 1.4
CMA / ARV
- ARV (median comp)
- $276,236
- List price
- $285,000
- Delta
- 3.17%
- Verdict
- FAIR
- Comps
- 20 within 1.0 mi
Show comp detail 12 sales within ~0.75 mi
| Address | Dist | Beds/Ba | Sqft | Sold | Price | $/sf | Match |
|---|---|---|---|---|---|---|---|
| 11814 Santa Fe Trl | 0.05mi | 3/2.0 | 1,584 (+2%) | 7mo | $278,000 | $176 | 88 |
| 4238 Chisholm Trl | 0.18mi | 3/2.0 | 1,555 (+0%) | 5mo | $295,000 | $190 | 87 |
| 11806 Oregon Trl | 0.07mi | 3/2.0 | 1,446 (-7%) | 2mo | $299,900 | $207 | 84 |
| 11731 Santa Fe Trl | 0.08mi | 3/2.0 | 1,356 (-13%) | 4mo | $257,500 | $190 | 72 |
| 11837 12th St | 0.29mi | 3/2.0 | 1,639 (+6%) | 7mo | $317,500 | $194 | 72 |
| 11826 Old Spanish Trl | 0.07mi | 3/2.0 | 1,374 (-12%) | 10mo | $269,999 | $197 | 70 |
| 11811 Santa Fe Trl | 0.07mi | 3/2.0 | 1,747 (+13%) | 14mo | $279,950 | $160 | 64 |
| 11811 15th St | 0.47mi | 3/2.0 | 1,511 (-3%) | 13mo | $245,000 | $162 | 63 |
| 4433 Avenue L | 0.49mi | 3/2.0 | 1,500 (-3%) | 10mo | $289,900 | $193 | 63 |
| 4118 Eaton Dr | 0.38mi | 3/2.0 | 1,778 (+15%) | 11mo | $299,000 | $168 | 49 |
| 3721 Avenue E | 0.73mi | 3/2.0 | 1,400 (-10%) | 4mo | $332,500 | $238 | 46 |
| 11905 15th St | 0.50mi | 2/2.0 (-1) | 1,370 (-12%) | 10mo | $200,000 | $146 | 44 |
Match score weights: distance 35% · size 25% · config 20% · recency 20%. Top-matched comps best support the ARV.
Projected returns pro-forma
-3.0% appreciation · 3.0% rent growth · sell at horizon
- IRR
- —
- Equity multiple
- 9.00×
- Total profit
- $638,359
- Equity at exit
- $42,494
- IRR
- —
- Equity multiple
- 19.03×
- Total profit
- $1,438,443
- Equity at exit
- $24,642
Cash invested: $79,800 (down + closing). Projections, not guarantees.
Landlord ↔ Tenant lean methodology
- Overall (STATE)
- 87 Strongly Landlord-Friendly
- State Texas
- 87 Strongly Landlord-Friendly · R+5
- County
- — inherits STATE
- City
- — inherits STATE
ZIP-level market 77510
- Home prices YoY
- -15.3%
- Active inventory
- 233
- Price-to-rent
- 1.4×
Monthly cashflow live
- Estimated rent
- $16,408 medium interval (Pro) →
- Mortgage (P&I)
- −$1,495
- Tax from tax record
- −$592 /mo · $7,101/yr
- Insurance
- −$119
- HOA
- −$16
- Vacancy / Maint / Mgmt
- −$3,446
- Net cashflow
- $10,742
Break-even live
UW: 25.0% down · 7.5% · 30yr · 1.5% tax · 5.0% vac · 8.0% maint · 8.0% mgmt
Financing live
Cash to close
- Down payment
- $71,250
- Closing costs
- $8,550
- Reserves months
- —
- Total cash needed
- —
Loan-product check · same deal, 3 products live
Conventional
25% down · 7.5% · 30yr
- Down + closing
- —
- Monthly P&I
- —
- Monthly cashflow
- —
- DSCR
- —
- Eligible?
- —
Personal DTI + credit; lowest rate.
DSCR
20% down · 8.5% · 30yr
- Down + closing
- —
- Monthly P&I
- —
- Monthly cashflow
- —
- DSCR
- —
- Eligible?
- —
No personal income docs; deal must DSCR.
Hard money
10% down · 12.0% · 12mo
- Down + closing
- —
- Monthly P&I
- —
- Monthly cashflow
- —
- DSCR
- —
- Eligible?
- —
Short-term bridge; refi at stabilization.
Rent comps 2 comps
| Address | Beds | Baths | Sqft | Rent | $/sqft | DOM | Units | Dist |
|---|---|---|---|---|---|---|---|---|
| 11844 13th St Santa Fe, TX | 3.0 | 2.0 | 1472 | $1,750 | $1.19 | 21d | 1 | 0.32mi |
| 4120 Avenue O #10 Santa Fe, TX | 3.0 | 2.0 | 1280 | $74,621 | $58.30 | 43d | 1 | 1.11mi |
HOA detail
- Monthly dues
- $16 · $192/yr
- Likely covers
- gas
Listing history 50 events
-
2026-06-18days on market $285,000 Active 8 DOM
-
2026-06-17days on market $285,000 Active 7 DOM
-
2026-06-16days on market $285,000 Active 6 DOM
-
2026-06-15days on market $285,000 Active 5 DOM
-
2026-06-13days on market $285,000 Active 3 DOM
-
2026-06-09days on market $285,000 Active 39 DOM
-
2026-06-08days on market $285,000 Active 38 DOM
-
2026-06-07days on market $285,000 Active 37 DOM
-
2026-06-04days on market $285,000 Active 34 DOM
-
2026-06-03days on market $285,000 Active 33 DOM
-
2026-06-02days on market $285,000 Active 32 DOM
-
2026-06-01days on market $285,000 Active 31 DOM
-
2026-05-31days on market $285,000 Active 30 DOM
-
2026-05-13status Pending 828-char remark
-
2026-04-28$285,000 Active 828-char remark
-
2026-04-25historical $285,000 828-char remark
-
2025-11-02historical
-
2025-10-28status Active
-
2025-10-25status Pending
-
2025-10-16status Active
-
2025-10-16price $279,900
-
2025-09-25status Pending
-
2025-09-07status Active
-
2025-09-04historical Active Under Contract
-
2025-08-18status Pending
-
2025-08-06$275,000 Active
-
2024-01-16soldstatus
-
2024-01-12soldstatus Sold
-
2023-12-24status Pending
-
2023-12-19status Option Pending
-
2023-12-07$269,000 Active
-
2023-11-30historical
-
2023-11-23status Active
-
2023-11-16status Option Pending
-
2023-11-13$269,900 Active
-
2023-11-13historical
-
2023-11-07price $269,900
-
2023-10-20price $280,000
-
2023-10-15$290,000 Active
-
2020-08-25soldstatus
-
2020-08-24soldstatus Sold
-
2020-06-15status Pending
-
2020-06-01status Pending, Continue to Show
-
2020-05-07$220,000 Active
-
2020-05-04historical
-
2020-03-12$227,500 Active
-
2017-05-01soldstatus
-
2017-04-28soldstatus Sold
-
2017-04-28status Pending
-
2017-04-27status Option Pending
ⓘ Source: listings_history table (triggers on properties + properties_extension) + one-shot
backfill from property_details.listing_events for pre-trigger history.
Tax reassessment forecast TX · Resets to sale price
- Current annual tax
- $7,101 · $592/mo
- Projected year-2 tax
- $7,101 · $592/mo
- Expected delta
- $0/yr ($0/mo · 0.0%)
ⓘ Screening estimate from a state-policy table — verify with the county assessor before closing.
Climate risk First Street
- Flood 6/10 Major FEMA zone X (shaded) · 70% chance over 30 yrs
- Wildfire 4/10 Moderate
- Heat 10/10 Extreme 7 d/yr ≥110°F today · 26 d/yr by 30 yrs out
- Wind 9/10 Extreme 99% chance of damaging wind over 30 yrs
- Air quality 2/10 Low 1 unhealthy d/yr today · 1 by 30 yrs out
Nearby sold comps map
Loading sold comps map…
Walkable amenities ~0.75 mi
Loading nearby amenities…
Taxation est. · year 1
- Rental income
- $196,902
- − Mortgage interest
- −$15,964
- − Property taxes
- −$7,101
- − Insurance
- −$1,425
- − Repairs & maintenance
- −$15,752
- − Management
- −$15,752
- − HOA
- −$192
- − Depreciation
- −$8,291
- Taxable income
- $132,424
- Est. tax owed @ 24.0%
- −$31,782
- After-tax cash flow
- $97,118/yr
For passive investors: Depreciation is non-cash, so a rental often shows a tax loss while cash-flowing — sheltering income. Rental losses are passive: they offset passive income freely, and up to $25,000/yr can offset ordinary (W-2) income if you actively participate and your MAGI is under $100k (phasing out to $0 by $150k); unused losses carry forward. On sale, claimed depreciation is recaptured at up to 25%, and gains may owe capital-gains tax (a 1031 exchange can defer both). Figures are a year-1 estimate at your 24.0% rate — not tax advice; consult a CPA.
Schools (NCES district)
- District
- Santa Fe ISD
- NCES district ID
- 4839270
- Math proficiency
- 38% ▼ -10.00%
- Reading proficiency
- 39% ▼ -2.00%
- Median HH income
- $66,769
- Composite
- 34.86/100
- National rank
- #5091
- State rank
- #385 of 826 in TX
Livability — Santa Fe
- Score
- 67/100
- State rank
- #550
- US rank
- #10637
Category grades
Schools grade is shown separately in the Schools card above.
Census & demographics
- Census place
- Santa Fe, TX
- Population (ZIP)
- 13,938
Population outlook (Galveston County) Hauer SSP2
- Today (2025)
- 390,640 people
- By 2030
- 425,226 · +8.9%
- By 2040
- 493,765 · +26.4%
- By 2050
- 559,698 · +43.3%
- By 2075
- 719,260 · +84.1%
- By 2100
- 819,628 · +109.8%
Race, ethnicity, and origin ACS 2023
- Neighborhood character
- Predominantly White (72%)
- Race & ethnicity
- White 72% Hispanic / Latino 21% Two or more races 17% Asian 2%
- Hispanic origin (detail)
- Mexican 14% Puerto Rican 3% Cuban 1%
- Common ancestry
- Lithuanian 4% Italian 3% Slovak 1%
- Foreign-born
- 5% · Canada
- Languages at home
- 89% English-only · Spanish 10% Tagalog/Filipino 1%
Political lean MEDSL · Galveston
- 2024 margin
- Strong R (+27.4) · D 35.7% · R 63.1% · Other 1.2%
- 2008→2024 swing
- -7.9pp toward R · 2008: -19.5pp · 2024: -27.4pp
- All cycles
- 2024: R+27.4 2020: R+22.6 2016: R+22.6 2012: R+26.9 2008: R+19.5
Not yet ingested
- Civics
- —
Market trends
- HPI YoY
- ▼ -54.15%
- Current HPI
- 299.2228
- Rent YoY
- —
- Metro
- —
- State GDP YoY
- ▲ 3.95%
- F500 in state
- 110
Industry mix (Fortune 500 HQ in TX)
| Industry | F500 HQs | Revenue |
|---|---|---|
| Energy | 16 | $1,198B |
|
||
| Technology | 5 | $198B |
|
||
| Engineering / Construction | 4 | $72B |
|
||
| Energy Services | 3 | $60B |
|
||
| Utilities | 3 | $41B |
|
||
| Healthcare | 2 | $330B |
|
||
Price history
+83.9% since first listed49 events — show timeline
- 2026-06-10 Listed $285,000 HARMLS
- 2026-06-10 Listing Removed — HARMLS
- 2026-05-24 Relisted — HARMLS
- 2026-05-21 Pending — HARMLS
- 2026-05-13 Pending — HARMLS
- 2026-04-28 Listed $285,000 HARMLS
- 2026-04-25 Coming Soon — HARMLS
- 2025-11-02 Listing Removed — HARMLS
- 2025-10-28 Relisted — HARMLS
- 2025-10-25 Pending — HARMLS
- 2025-10-16 Relisted — HARMLS
- 2025-10-16 Price Changed $279,900 HARMLS
- 2025-09-25 Pending — HARMLS
- 2025-09-07 Relisted — HARMLS
- 2025-09-04 Contingent — HARMLS
- 2025-08-18 Pending — HARMLS
- 2025-08-06 Listed $275,000 HARMLS
- 2024-01-16 Sold (Public Records) — Public Records
- 2024-01-12 Sold (MLS) — HARMLS
- 2023-12-24 Pending — HARMLS
- 2023-12-19 Pending — HARMLS
- 2023-12-07 Listed $269,000 HARMLS
- 2023-11-30 Listing Removed — HARMLS
- 2023-11-23 Relisted — HARMLS
- 2023-11-16 Pending — HARMLS
- 2023-11-13 Listing Removed — HARMLS
- 2023-11-13 Listed $269,900 HARMLS
- 2023-11-07 Price Changed $269,900 HARMLS
- 2023-10-20 Price Changed $280,000 HARMLS
- 2023-10-15 Listed $290,000 HARMLS
- 2020-08-25 Sold (Public Records) — Public Records
- 2020-08-24 Sold (MLS) — HARMLS
- 2020-06-15 Pending — HARMLS
- 2020-06-01 Pending — HARMLS
- 2020-05-07 Listed $220,000 HARMLS
- 2020-05-04 Listing Removed — HARMLS
- 2020-03-12 Listed $227,500 HARMLS
- 2017-05-01 Sold (Public Records) — Public Records
- 2017-04-28 Sold (MLS) — HARMLS
- 2017-04-28 Pending — HARMLS
- 2017-04-27 Pending — HARMLS
- 2017-04-12 Pending — HARMLS
- 2017-04-11 Pending — HARMLS
- 2017-03-27 Pending — HARMLS
- 2017-03-23 Listed $174,900 HARMLS
- 2013-06-01 Listing Removed — HARMLS
- 2013-04-22 Listed $155,000 HARMLS
- 2008-09-30 Sold (Public Records) — Public Records
- 2004-06-22 Sold (Public Records) — Public Records
Property tax history
+4.0%/yrLatest (2025): $7,101 · +7.3% YoY. Source: county tax records.
Cash-flow waterfall
monthlySold comps — $/sqft
last 12 mo · ≤1 miLoading sold comps…