60 Appian Dr · North Gates, NY
Flood risk 1/10 · Minimal
- FEMA flood zone
- X (unshaded)
- Chance of flooding over 30 yrs
- 0.0%
- Est. flood insurance / yr
- $473 – $860
Fire risk 1/10 · Minimal
- Est. fire insurance / yr
- $691 – $1,283
Heat risk 2/10 · Minimal
- Hot days now (above 95°F)
- 7 days/yr
- Hot days in 30 yrs
- 15 days/yr
Wind risk 1/10 · Minimal
- Chance of severe wind over 30 yrs
- —
Air-quality risk 2/10 · Minimal
- Unhealthy air days now
- 1 days/yr
- Unhealthy air days in 30 yrs
- 2 days/yr
Risk factors via First Street. Map © Google.
Why this score? — see what drove the D grade
The composite is a weighted blend of 9 inputs, each scored 0–100. Each bar is that input's sub-score; the figure is the points it added to the 100-point composite (weight × sub-score).
- ARV discount +15.0/15.0
- Cash flow +6.5/30.0
- Rent growth +4.1/5.0
- 1% rule +3.9/10.0
- Livability +3.8/5.0
- Schools +3.6/10.0
- Condition / age +2.5/5.0
- DSCR +0.8/10.0
- Appreciation +0.0/10.0
$199,900
🖨 Deal sheet (PDF) 📄 Offer letter ✓ Due diligence
Listing remarks
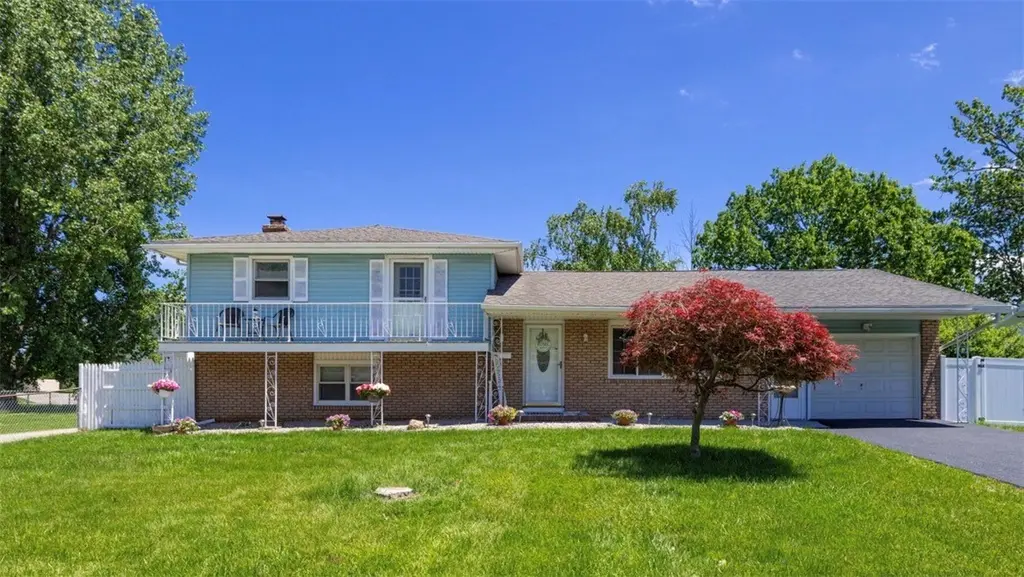
The one you've been waiting for. .. . say hello to 60 Appian Drive. Located in the heart of Gates, in a desirable neighborhood, you'll fall in love with this fully remodeled split level home. Boasting over 1780+ ft. ² this 3 bed , 1.5 bath home offers an open concept floor plan and plenty of sprawling room to entertain family & friends in the comfort of your own home. Freshly painted exterior, professional landscaping boasts majestic curb appeal w/ charming front entryway overlooking the pristine yard. An inviting front entryway leads into the bright open foyer w/ tons of custom features & gleaming hardwoods throughout. Freshly painted w/ modern decore, gaze out to picture
Key facts
- Fully remodeled
- Bright open foyer
- 0.38 acre lot
Tags
Property features AI
Exterior
- Parking: Attached garage with garage door opener and electricity; Driveway parking
- Utilities: Public water connected; Sewer connected; High-speed internet available; Cable available; Circuit breaker electrical service
- Home design: Single-story home; Existing construction
- Construction: Vinyl siding; Blown-in insulation; Architectural shingle roof; Block foundation; Resale condition
- Exterior features: Blacktop driveway; Balcony; Enclosed porch; Porch; Patio; Shed(s) and storage; Partial fencing; Near public transit; Rectangular residential lot; City street frontage
Interior
- Kitchen: Gas oven and gas range; Microwave; Range hood; Dishwasher; Refrigerator; Exhaust fan
- Bedrooms: Total rooms include living, family, recreation, bonus room and entry foyer (6 total rooms)
- Flooring: Carpet; Hardwood; Tile; Varies
- Bathrooms: One full bathroom; One half bathroom
- Heating & cooling: Forced-air gas heating; Central air conditioning
- Interior features: Ceiling fans; Separate/formal dining room; Entrance foyer; Separate/formal living room; Kitchen-family room combo; Open living/dining area; Sliding glass doors; Thermal windows; Sliding doors
- Laundry & utility: Washer and dryer in basement; Electric water heater
Neighborhood map
What this means for you Summary
Snapshot
- This is a 3-bed/1.5-bath single-family listed at $200k.
Deal economics
- At list price, monthly cash flow is $-337 ($-4k/yr) — negative.
- To cash-flow at today's rent, offer at most $148k (25.8% below list).
- To meet the 1% rule (rent ≥ 1% of price), the offer needs to be $179k (10.6% below list).
- Recommended offer: $148k (25.8% below list) — sets the bar for cash-flow.
Location & tenants
- Location reads 75/100 on livability (#245 in NY, #3,859 nationally) — a middle-class / working-renter tenant base. Strengths: housing A+, health & safety A+, cost of living A-; Watch: crime D, amenities F.
- Gates-Chili Central School District (suburban): math 41% / reading 42% proficiency, ranked #491 of 590 in NY (top 83%) — families likely to look elsewhere, expect single-tenant / working-renter base with shorter leases.
- Zoned schools: Neil Armstrong School (math 17% / reading 32%, grade F, #1,846 of 2,108 statewide, top 91%, 389 students, 61% FRL); Gates-Chili Middle School (math 25% / reading 40%, grade F, #504 of 729 statewide, top 70%, 854 students, 58% FRL); Gates-Chili High School (math 92% / reading 70%, grade A, #495 of 1,100 statewide, top 46%, 1,132 students, 55% FRL) — zoned schools average 58% FRL vs 31% district-wide (27 pts higher); higher-poverty schools than district average — tighter screening recommended.
- Market conditions: Rents rising fast (+6.3%/yr); 125 active listings in the ZIP; 1 comparable units currently listed for rent nearby; 1,169 units permitted in Monroe County in 2024 (591 in 5+ unit buildings).
- This rent runs 38% of the median local income ($56k/yr) — at the standard rent-burdened threshold; future hikes will face affordability resistance.
Forward outlook
- Local home prices are declining (-3.0%/yr); year-one equity from $1k of loan paydown is wiped out by about $6k of value loss. Plan a longer hold.
- Monroe County population projected to shrink 6% by 2050 — rents likely to lag national; underwrite the cash flow, not the appreciation.
Negotiation context
- Only 7 days on market — expect competitive offers; lowballing is unlikely to land.
- Current owner paid $84k; list at $200k implies a 138% gain — meaningful room to come down on a strong offer.
Risks & watch-outs
- Watch-outs: property tax is 3.7% of price.
Questions for the listing agent
- What do current leases actually rent for vs. the listed asking? Can we see a recent rent roll and the last 12 months of T-12 income?
- Built in 1970 — when were the roof, HVAC, electrical panel, plumbing, and water heater last replaced?
- Property tax is high relative to price — has the assessment been appealed recently, and will the sale trigger a re-assessment?
- Is there a deadline driving the sale (1031 exchange, divorce, estate, relocation)? That informs how much negotiation room exists.
- Schools are F-rated, which usually means shorter tenancies and higher turnover. Who's the typical renter profile here, and what's been the actual vacancy rate?
- Crime grade is D in this area — have there been break-ins, vandalism, or insurance claims at this property in the last 3 years? What carrier currently insures it and at what premium?
- The area grade is low — what's the realistic commute time and amenity access for the typical tenant pool here? Any planned neighborhood developments (good or bad) we should know about?
- What's the average days-on-market for RENTAL listings here right now (not sales)? A rising rental-DOM trend means longer vacancies and softer asking-rent achievability than the comps imply.
- What's the recent tenant-quality profile in this submarket — average credit score on applications, eviction rate, late-payment / NSF rate, and stable-employment percentage? A property-management company in the area should have these aggregated.
- How much new for-sale + rental construction is in the pipeline within 1–3 miles? Heavy new supply typically softens prices + rents 12–24 months out; constrained supply supports both.
Investment metrics
- 1% rule
- 0.89% ✗
- Cap rate
- 4.27%
- Cash-on-cash
- -7.24%
- DSCR
- 0.68
- GRM
- 9.3
CMA / ARV
- ARV (on-the-fly)
- $317,018
- Comps found
- 12
Show comp detail 12 sales within ~0.75 mi
| Address | Dist | Beds/Ba | Sqft | Sold | Price | $/sf | Match |
|---|---|---|---|---|---|---|---|
| 73 Hazel Bark Run | 0.35mi | 3/2.5 | 1,794 (+1%) | 5mo | $320,000 | $178 | 74 |
| 50 Deepwood Dr | 0.33mi | 4/3.5 (+1) | 1,722 (-3%) | 1mo | $415,000 | $241 | 65 |
| 67 Rahway Ln | 0.29mi | 3/2.5 | 1,563 (-12%) | 2mo | $475,000 | $304 | 61 |
| 64 Markie Dr W | 0.43mi | 4/2.5 (+1) | 1,944 (+9%) | 0mo | $350,000 | $180 | 55 |
| 2381 Long Pond Rd | 0.68mi | 3/1.5 | 1,696 (-5%) | 6mo | $225,000 | $133 | 55 |
| 82 Nory Ln | 0.72mi | 3/2.0 | 1,730 (-3%) | 6mo | $305,000 | $176 | 54 |
| 18 Charter Cir | 0.33mi | 3/3.5 | 1,625 (-9%) | 9mo | $350,000 | $215 | 54 |
| 137 Rahway Rd | 0.45mi | 3/1.5 | 1,567 (-12%) | 6mo | $270,000 | $172 | 54 |
| 16 Hazel Bark Run | 0.49mi | 3/1.5 | 1,520 (-15%) | 9mo | $280,000 | $184 | 45 |
| 312 Auburn Ave | 0.74mi | 4/2.0 (+1) | 1,617 (-9%) | 8mo | $240,000 | $148 | 37 |
| 16 Burning Brush Dr | 0.64mi | 4/2.0 (+1) | 2,048 (+15%) | 3mo | $320,000 | $156 | 36 |
| 55 Noel Dr | 0.71mi | 4/2.0 (+1) | 1,986 (+12%) | 8mo | $300,199 | $151 | 34 |
Match score weights: distance 35% · size 25% · config 20% · recency 20%. Top-matched comps best support the ARV.
Projected returns pro-forma
-3.0% appreciation · 6.28% rent growth · sell at horizon
- IRR
- -24.0%
- Equity multiple
- 0.15×
- Total profit
- $-47,539
- Equity at exit
- $29,806
- IRR
- -10.3%
- Equity multiple
- 0.26×
- Total profit
- $-41,294
- Equity at exit
- $17,284
Cash invested: $55,972 (down + closing). Projections, not guarantees.
Landlord ↔ Tenant lean methodology
- Overall (STATE)
- 15 Strongly Tenant-Friendly
- State New York
- 15 Strongly Tenant-Friendly · D+10
- County
- — inherits STATE
- City
- — inherits STATE
ZIP-level market 14606
- Home prices YoY
- -17.9%
- Rents YoY
- 6.3%
- Active inventory
- 125
- Price-to-rent
- 9.3×
Monthly cashflow live
- Estimated rent
- $1,788 medium interval (Pro) →
- Mortgage (P&I)
- −$1,048
- Tax from tax record
- −$618 /mo · $7,418/yr
- Insurance
- −$83
- HOA
- −$0
- Vacancy / Maint / Mgmt
- −$375
- Net cashflow
- $-337
Break-even live
Sensitivity live
| Price | -10% $-224 | -5% $-281 | +0% $-337 | +5% $-394 | +10% $-451 |
|---|---|---|---|---|---|
| Rent | -10% $-479 | -5% $-408 | +0% $-337 | +5% $-267 | +10% $-196 |
| Rate | -1.0pp $-237 | -0.5pp $-287 | base $-337 | +0.5pp $-389 | +1.0pp $-442 |
UW: 25.0% down · 7.5% · 30yr · 1.5% tax · 5.0% vac · 8.0% maint · 8.0% mgmt
Financing live
Cash to close
- Down payment
- $49,975
- Closing costs
- $5,997
- Reserves months
- —
- Total cash needed
- —
Loan-product check · same deal, 3 products live
Conventional
25% down · 7.5% · 30yr
- Down + closing
- —
- Monthly P&I
- —
- Monthly cashflow
- —
- DSCR
- —
- Eligible?
- —
Personal DTI + credit; lowest rate.
DSCR
20% down · 8.5% · 30yr
- Down + closing
- —
- Monthly P&I
- —
- Monthly cashflow
- —
- DSCR
- —
- Eligible?
- —
No personal income docs; deal must DSCR.
Hard money
10% down · 12.0% · 12mo
- Down + closing
- —
- Monthly P&I
- —
- Monthly cashflow
- —
- DSCR
- —
- Eligible?
- —
Short-term bridge; refi at stabilization.
Rent comps 1 comps
| Address | Beds | Baths | Sqft | Rent | $/sqft | DOM | Units | Dist |
|---|---|---|---|---|---|---|---|---|
| 155 Canal Landing Blvd Rochester, NY | 1.0–3.0 | 1.5–2.0 | 1174 | $2,050 | $1.75 | 4d | 5 | 1.35mi |
Listing history 5 events
-
2026-06-16statusdays on market $199,900 Pending 7 DOM
-
2026-06-15days on market $199,900 Active 6 DOM
-
2026-06-13days on market $199,900 Active 4 DOM
-
2026-06-10remarks 686-char remark
-
2026-06-10$199,900 Active 1 DOM
ⓘ Source: listings_history table (triggers on properties + properties_extension) + one-shot
backfill from property_details.listing_events for pre-trigger history.
Tax reassessment forecast NY · Partial reset (capped growth)
- Current annual tax
- $7,418 · $618/mo
- Projected year-2 tax
- $7,418 · $618/mo
- Expected delta
- $0/yr ($0/mo · 0.0%)
ⓘ Screening estimate from a state-policy table — verify with the county assessor before closing.
Climate risk First Street
- Flood 1/10 Low FEMA zone X (unshaded) · 0% chance over 30 yrs
- Wildfire 1/10 Low
- Heat 2/10 Low 7 d/yr ≥95°F today · 15 d/yr by 30 yrs out
- Wind 1/10 Low
- Air quality 2/10 Low 1 unhealthy d/yr today · 2 by 30 yrs out
Nearby sold comps map
Loading sold comps map…
Walkable amenities ~0.75 mi
Loading nearby amenities…
Taxation est. · year 1
- Rental income
- $21,452
- − Mortgage interest
- −$11,198
- − Property taxes
- −$7,418
- − Insurance
- −$1,000
- − Repairs & maintenance
- −$1,716
- − Management
- −$1,716
- − Depreciation
- −$5,815
- Taxable loss
- −$7,410
- Est. tax savings @ 24.0%
- +$1,778
- After-tax cash flow
- $-2,271/yr
For passive investors: Depreciation is non-cash, so a rental often shows a tax loss while cash-flowing — sheltering income. Rental losses are passive: they offset passive income freely, and up to $25,000/yr can offset ordinary (W-2) income if you actively participate and your MAGI is under $100k (phasing out to $0 by $150k); unused losses carry forward. On sale, claimed depreciation is recaptured at up to 25%, and gains may owe capital-gains tax (a 1031 exchange can defer both). Figures are a year-1 estimate at your 24.0% rate — not tax advice; consult a CPA.
Schools (NCES district)
- District
- Gates-Chili Central School District
- NCES district ID
- 3611880
- Math proficiency
- 41% ▼ -12.00%
- Reading proficiency
- 42% ▼ -6.00%
- Median HH income
- $55,045
- Composite
- 36.23/100
- National rank
- #4719
- State rank
- #491 of 590 in NY
Livability — North Gates
- Score
- 75/100
- State rank
- #245
- US rank
- #3859
Category grades
Schools grade is shown separately in the Schools card above.
Census & demographics
- Census place
- North Gates, NY
- County
- Monroe County · 674,131 people
- City population
- 27,478
- Metro
- Rochester, NY
- Population (ZIP)
- 25,538
- Household income
- $55,807
- Rent vs Own
- Severe rent burden
- 986.0
Population outlook (Monroe County) Hauer SSP2
- Today (2025)
- 759,460 people
- By 2030
- 757,154 · -0.3%
- By 2040
- 740,644 · -2.5%
- By 2050
- 714,443 · -5.9%
- By 2075
- 645,883 · -15.0%
- By 2100
- 547,084 · -28.0%
Race, ethnicity, and origin ACS 2023
- Neighborhood character
- Diverse neighborhood (Simpson 0.64)
- Race & ethnicity
- White 51% Black 26% Hispanic / Latino 17% Two or more races 8% Asian 3%
- Hispanic origin (detail)
- Puerto Rican 12% Cuban 2%
- Common ancestry
- Romanian 3% Lithuanian 1% Iranian 1%
- Foreign-born
- 10% · Canada, Vietnam, Philippines
- Languages at home
- 79% English-only · Spanish 12% Other Indo-European 3% Other Asian/Pacific 2%
Political lean MEDSL · Monroe
- 2024 margin
- D (+19.1) · D 59.5% · R 40.5%
- 2008→2024 swing
- +1.4pp toward D · 2008: 17.7pp · 2024: 19.1pp
- All cycles
- 2024: D+19.1 2020: D+21.0 2016: D+14.1 2012: D+17.4 2008: D+17.7
Not yet ingested
- Civics
- —
Market trends
- HPI YoY
- ▼ -62.59%
- Current HPI
- 287.6868
- Rent YoY
- ▲ 6.28%
- Metro
- Rochester, NY
- State GDP YoY
- ▲ 2.60%
- F500 in state
- 92
Industry mix (Fortune 500 HQ in NY)
| Industry | F500 HQs | Revenue |
|---|---|---|
| Financial Services | 10 | $950B |
|
||
| Consumer Goods | 9 | $162B |
|
||
| Insurance | 4 | $225B |
|
||
| Telecommunications | 2 | $144B |
|
||
| Pharmaceuticals | 2 | $112B |
|
||
| Media / Entertainment | 2 | $69B |
|
||
Price history
+138.0% since first listed2 events — show timeline
- 2026-06-09 Listed $199,900 UNYREIS
- 1995-06-27 Sold (Public Records) $84,000 Public Records
Property tax history
+6.1%/yrLatest (2025): $7,418 · +36.9% YoY. Source: county tax records.
Cash-flow waterfall
monthlySold comps — $/sqft
last 12 mo · ≤1 miLoading sold comps…