 🌊 Lakefront
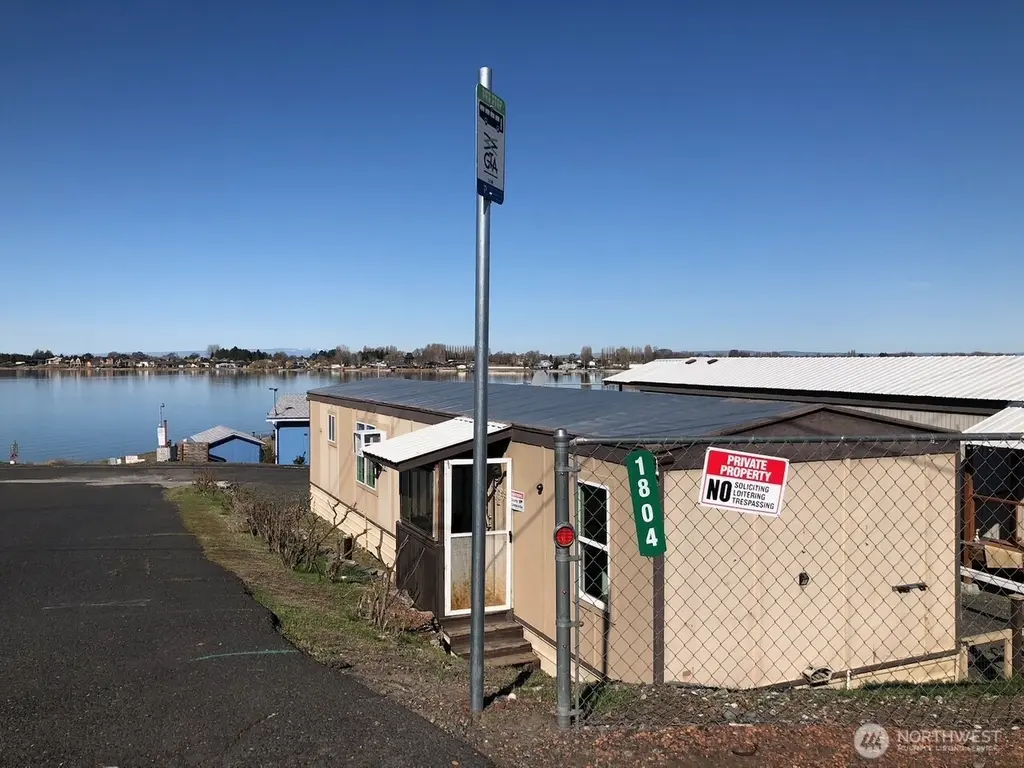
1804 W Marina Dr #41 · Moses Lake, WA
Flood risk 8/10 · Major
- FEMA flood zone
- X (unshaded)
- Chance of flooding over 30 yrs
- 0.78%
- Est. flood insurance / yr
- $507 – $1,088
Fire risk 1/10 · Minimal
- Est. fire insurance / yr
- $604 – $1,122
Heat risk 4/10 · Minor
- Hot days now (above 96°F)
- 7 days/yr
- Hot days in 30 yrs
- 15 days/yr
Wind risk 1/10 · Minimal
- Chance of severe wind over 30 yrs
- —
Air-quality risk 7/10 · Major
- Unhealthy air days now
- 12 days/yr
- Unhealthy air days in 30 yrs
- 14 days/yr
Risk factors via First Street. Map © Google.
Why this score? — see what drove the D+ grade
The composite is a weighted blend of 9 inputs, each scored 0–100. Each bar is that input's sub-score; the figure is the points it added to the 100-point composite (weight × sub-score).
- Cash flow +15.0/30.0
- ARV discount +7.5/15.0
- 1% rule +5.0/10.0
- DSCR +5.0/10.0
- Schools +3.9/10.0
- Livability +3.8/5.0
- Condition / age +3.8/5.0
- Rent growth +2.1/5.0
- Appreciation +0.0/10.0
$30,000
🖨 Deal sheet 📄 Offer letter ✓ Due diligence
Listing remarks
Lake front living at a very affordable price. Two bedroom, 1 bath 1985 single wide manufactured home at Lakeshore MH Park. New interior paint and water heater. Updated windows, bathroom and light fixtures. Community lakefront area with small boat launch just a few steps from the front door. Perfect for paddle boats, kayaks, etc. There's constantly changing views with beautiful sunsets and wildlife. Park manager approval is required. Monthly space rent is $800 +/- depending on water usage.
Key facts
- Lake front living
- Small boat launch
- Updated windows
Tags
Neighborhood map
What this means for you Summary
Snapshot
- This is a 2-bed/1.0-bath manufactured listed at $30k. Condition is rated good.
Deal economics
- At list price, monthly cash flow is $824 ($10k/yr) — positive.
- The deal already cash-flows at list — no discount required.
- Meets the 1% rule at list price ($1k rent vs $30k).
- Recommended offer: $26k (12.0% below list) — sets the bar for market timing.
- Cap rate 41.9% vs local median 3.3% in Moses Lake — top-decile yield for the area; either an underpriced asset or a hidden risk that comps aren't pricing in. Stress-test before assuming the spread holds.
Location & tenants
- Location reads 75/100 on livability (#170 in WA, #4,228 nationally) — a middle-class / working-renter tenant base. Strengths: housing A+, health & safety A+, amenities A-; Watch: employment C-, schools D+, crime F.
- Moses Lake School District (town): math 38% / reading 48% proficiency, ranked #198 of 291 in WA (top 68%) — families likely to look elsewhere, expect single-tenant / working-renter base with shorter leases.
- Market conditions: Rents soft (-1.7%/yr); 585 active listings in the ZIP; 12 comparable units currently listed for rent nearby; rentals lingering (median 44d on market — plan ~5-8 weeks vacancy on turnover, expect pricing pressure); 100% of comp listings sitting > 30 days — soft ceiling on asking rent; 559 units permitted in Grant County in 2024 (35 in 5+ unit buildings).
Forward outlook
- Local home prices are declining (-3.0%/yr); year-one equity from $207 of loan paydown is wiped out by about $900 of value loss. Plan a longer hold.
- Grant County population projected at +16% by 2050 — long-run rental-demand tailwind backs the buy-and-hold thesis.
- At projected returns (-3.0% appreciation + 0.0% rent growth), your $8k cash investment doubles in ~1 year — after that, you're playing with house money.
Negotiation context
- It's been on market 412 days — a 12% lower offer ($26k) is reasonable based on typical stale-listing flexibility.
- 2 sale attempts; this cycle's ask has dropped $20k (40%) from the opening price — seller is motivated, your offer sets the floor, not the list.
Risks & watch-outs
- Watch-outs: flood insurance adds $66/mo.
- Climate carrying-cost: severe flood risk — expect insurance premiums to compound above CPI over the hold.
Questions for the listing agent
- It's been on market 412 days. Have you received any prior offers? Is the seller open to a 12% concession, seller financing, or rate buy-down credit?
- What's the actual annual flood-insurance premium (NFIP or private), and is the property in a SFHA with mandatory coverage?
- Why hasn't it sold? Are there any deal-killer items the seller is aware of (foundation, flood, title, zoning, code violations)?
- Is there a deadline driving the sale (1031 exchange, divorce, estate, relocation)? That informs how much negotiation room exists.
- Schools are D-rated, which usually means shorter tenancies and higher turnover. Who's the typical renter profile here, and what's been the actual vacancy rate?
- Crime grade is F in this area — have there been break-ins, vandalism, or insurance claims at this property in the last 3 years? What carrier currently insures it and at what premium?
- The area grade is low — what's the realistic commute time and amenity access for the typical tenant pool here? Any planned neighborhood developments (good or bad) we should know about?
- This sits on a lake — are riparian / water-frontage rights deeded with the parcel? Any dock permits, shoreline easements, or HOA water-use restrictions?
- What's the documented flood / surge / shoreline-erosion history here (FEMA AND non-FEMA — e.g., storm surge, creek backup, septic-field saturation)?
- Any water-quality or seasonal algae-bloom issues that affect tenant satisfaction or short-term-rental demand?
- What's the average days-on-market for RENTAL listings here right now (not sales)? A rising rental-DOM trend means longer vacancies and softer asking-rent achievability than the comps imply.
- What's the recent tenant-quality profile in this submarket — average credit score on applications, eviction rate, late-payment / NSF rate, and stable-employment percentage? A property-management company in the area should have these aggregated.
- How much new for-sale + rental construction is in the pipeline within 1–3 miles? Heavy new supply typically softens prices + rents 12–24 months out; constrained supply supports both.
Investment metrics
- 1% rule
- 4.63% ✓
- Cap rate
- 41.90%
- Cash-on-cash
- 127.17%
- DSCR
- 6.66
- GRM
- 1.8
CMA / ARV
- ARV (median comp)
- $62,253
- List price
- $30,000
- Delta
- -51.81%
- Verdict
- UNDERPRICED
- Comps
- 3 within 1.0 mi
Show comp detail 2 sales within ~0.75 mi
| Address | Dist | Beds/Ba | Sqft | Sold | Price | $/sf | Match |
|---|---|---|---|---|---|---|---|
| 1804 W Marina Dr #41 | 0.00mi | 2/1.0 | 784 (0%) | 1mo | $27,500 | $35 | 100 |
| 1908 W. Marina Dr #5 | 0.06mi | 2/1.0 | 728 (-7%) | 13mo | $60,000 | $82 | 74 |
Match score weights: distance 35% · size 25% · config 20% · recency 20%. Top-matched comps best support the ARV.
Projected returns pro-forma
-3.0% appreciation · 0.0% rent growth · sell at horizon
- IRR
- —
- Equity multiple
- 6.19×
- Total profit
- $43,594
- Equity at exit
- $4,473
- IRR
- —
- Equity multiple
- 11.72×
- Total profit
- $90,035
- Equity at exit
- $2,594
Cash invested: $8,400 (down + closing). Projections, not guarantees.
Landlord ↔ Tenant lean methodology
- Overall (STATE)
- 28 Tenant-Leaning
- State Washington
- 28 Tenant-Leaning · D+8
- County
- — inherits STATE
- City
- — inherits STATE
ZIP-level market 98837
- Rents YoY
- -1.7%
- Active inventory
- 585
- Price-to-rent
- 1.8×
Monthly cashflow live
- Estimated rent
- $1,389 high interval (Pro) →
- Mortgage (P&I)
- −$157
- Tax est. 1.5%
- −$38 /mo · $450/yr
- Insurance
- −$12
- Flood insurance flood zone
- −$66 /mo · $798/yr
- HOA
- −$0
- Vacancy / Maint / Mgmt
- −$292
- Net cashflow
- $824
Break-even live
UW: 25.0% down · 7.5% · 30yr · 1.5% tax · 5.0% vac · 8.0% maint · 8.0% mgmt
Financing live
Cash to close
- Down payment
- $7,500
- Closing costs
- $900
- Reserves months
- —
- Total cash needed
- —
Loan-product check · same deal, 3 products live
Conventional
25% down · 7.5% · 30yr
- Down + closing
- —
- Monthly P&I
- —
- Monthly cashflow
- —
- DSCR
- —
- Eligible?
- —
Personal DTI + credit; lowest rate.
DSCR
20% down · 8.5% · 30yr
- Down + closing
- —
- Monthly P&I
- —
- Monthly cashflow
- —
- DSCR
- —
- Eligible?
- —
No personal income docs; deal must DSCR.
Hard money
10% down · 12.0% · 12mo
- Down + closing
- —
- Monthly P&I
- —
- Monthly cashflow
- —
- DSCR
- —
- Eligible?
- —
Short-term bridge; refi at stabilization.
Rent comps 12 comps
| Address | Beds | Baths | Sqft | Rent | $/sqft | DOM | Units | Dist |
|---|---|---|---|---|---|---|---|---|
| 1830 W Crouse St #1 Moses Lake, WA | 2.0 | 1.0 | 946 | $1,295 | $1.37 | 43d | 1 | 0.08mi |
| 1701 W Crouse St Moses Lake, WA | 1.0–3.0 | 1.0–2.0 | 1017 | $1,525 | $1.50 | 43d | 6 | 0.18mi |
| Pheasant St Moses Lake, WA | 2.0 | 1.0 | 850 | $1,450 | $1.71 | 43d | 1 | 0.41mi |
| 2812 W Marina Dr Unit D Moses Lake, WA | 2.0 | 2.0 | 1078 | $1,695 | $1.57 | 43d | 1 | 0.75mi |
| 2722 W Peninsula Dr Moses Lake, WA | 2.0 | 1.0 | 858 | $1,350 | $1.57 | 43d | 1 | 0.79mi |
| 1211 W Ivy Ave Unit 203 Moses Lake, WA | 2.0 | 1.0 | 900 | $1,250 | $1.39 | 43d | 1 | 0.82mi |
| 1205 W Ivy Ave Unit 101 Moses Lake, WA | 2.0 | 1.0 | 900 | $1,150 | $1.28 | 43d | 1 | 0.83mi |
| 1206 W Columbia Ave Unit D Moses Lake, WA | 2.0 | 1.0 | 900 | $1,295 | $1.44 | 43d | 1 | 0.85mi |
| 511 S Interlake Rd Moses Lake, WA | 2.0–4.0 | 2.0 | 1095 | $926 | $0.85 | 43d | 8 | 0.86mi |
| 2900 W Marina Dr Moses Lake, WA | 2.0 | 2.0 | 1036 | $1,688 | $1.63 | 43d | 1 | 0.87mi |
| 2583 Elgin Rd NE Unit A Moses Lake, WA | 1.0 | 1.0 | 750 | $1,150 | $1.53 | 43d | 1 | 1.35mi |
| 1050 S Division St Moses Lake, WA | 1.0–2.0 | 1.0 | 675 | $1,309 | $1.94 | 43d | 14 | 1.40mi |
Listing history 6 events
-
2026-05-19status Pending
-
2026-05-13status Active
-
2026-05-08status Pending
-
2026-04-09price $30,000
-
2026-03-03price $40,000
-
2025-03-28$50,000 Active
ⓘ Source: listings_history table (triggers on properties + properties_extension) + one-shot
backfill from property_details.listing_events for pre-trigger history.
Climate risk First Street
- Flood 8/10 Severe FEMA zone X (unshaded) · 78% chance over 30 yrs
- Wildfire 1/10 Low
- Heat 4/10 Moderate 7 d/yr ≥96°F today · 15 d/yr by 30 yrs out
- Wind 1/10 Low
- Air quality 7/10 Severe 12 unhealthy d/yr today · 14 by 30 yrs out
Nearby sold comps map
Loading sold comps map…
Walkable amenities ~0.75 mi
Loading nearby amenities…
Taxation est. · year 1
- Rental income
- $16,671
- − Mortgage interest
- −$1,680
- − Property taxes
- −$450
- − Insurance
- −$948
- − Repairs & maintenance
- −$1,334
- − Management
- −$1,334
- − Depreciation
- −$873
- Taxable income
- $10,053
- Est. tax owed @ 24.0%
- −$2,413
- After-tax cash flow
- $7,472/yr
For passive investors: Depreciation is non-cash, so a rental often shows a tax loss while cash-flowing — sheltering income. Rental losses are passive: they offset passive income freely, and up to $25,000/yr can offset ordinary (W-2) income if you actively participate and your MAGI is under $100k (phasing out to $0 by $150k); unused losses carry forward. On sale, claimed depreciation is recaptured at up to 25%, and gains may owe capital-gains tax (a 1031 exchange can defer both). Figures are a year-1 estimate at your 24.0% rate — not tax advice; consult a CPA.
Condition & rehab AI · 12 photos
This manufactured home is in good condition with cosmetic updates needed. It offers a lakefront view and is move-in ready.
Value-add opportunities
- Both Paint exterior — Enhances curb appeal and resale value.
- Both Landscaping — Improves curb appeal and rental value.
- Resale Update kitchen appliances — Modernizes the kitchen and enhances resale value.
- Resale Update bathroom fixtures — Modernizes the bathroom and enhances resale value.
Renovation cost estimate screening
Value-add ROI direction
- Both Paint exterior — Enhances curb appeal and resale value. ↑
- Both Landscaping — Improves curb appeal and rental value. ↑
- Resale Update kitchen appliances — Modernizes the kitchen and enhances resale value. ↑
- Resale Update bathroom fixtures — Modernizes the bathroom and enhances resale value. ↑
ⓘ Cost ranges are severity-bucket heuristics (US national rule-of-thumb). Get contractor quotes + a written scope before underwriting a rehab budget.
Schools (NCES district)
- District
- Moses Lake School District
- NCES district ID
- 5305220
- Math proficiency
- 38% ▬ 0.00%
- Reading proficiency
- 48% ▼ -1.00%
- Median HH income
- $49,033
- Composite
- 39.17/100
- National rank
- #8232
- State rank
- #198 of 291 in WA
Livability — Moses Lake
- Score
- 75/100
- State rank
- #170
- US rank
- #4228
Category grades
Schools grade is shown separately in the Schools card above.
Census & demographics
- Census place
- Moses Lake, WA
- County
- Grant County · 61,643 people
- City population
- 49,455
- Metro
- Moses Lake, WA
- Population (ZIP)
- 49,455
- Household income
- $74,586
- Rent vs Own
- Severe rent burden
- 1064.0
Population outlook (Grant County) Hauer SSP2
- Today (2025)
- 99,356 people
- By 2030
- 102,107 · +2.8%
- By 2040
- 108,318 · +9.0%
- By 2050
- 114,712 · +15.5%
- By 2075
- 131,376 · +32.2%
- By 2100
- 146,163 · +47.1%
Race, ethnicity, and origin ACS 2023
- Neighborhood character
- Diverse neighborhood (Simpson 0.55)
- Race & ethnicity
- White 58% Hispanic / Latino 33% Two or more races 15% Black 2% Asian 1%
- Hispanic origin (detail)
- Mexican 30%
- Common ancestry
- Portuguese 3% Subsaharan African 2% Lithuanian 2%
- Foreign-born
- 10% · Canada
- Languages at home
- 76% English-only · Spanish 21% Russian/Polish/Slavic 2%
Political lean MEDSL · Grant
- 2024 margin
- Solid R (+37.5) · D 30.0% · R 67.4% · Other 2.6%
- 2008→2024 swing
- -9.9pp toward R · 2008: -27.5pp · 2024: -37.5pp
- All cycles
- 2024: R+37.5 2020: R+34.4 2016: R+37.9 2012: R+32.6 2008: R+27.5
Not yet ingested
- Civics
- —
Market trends
- HPI YoY
- ▼ -384.29%
- Current HPI
- 208.4574
- Rent YoY
- ▼ -1.72%
- Metro
- Moses Lake, WA
- State GDP YoY
- ▲ 4.65%
- F500 in state
- 22
Industry mix (Fortune 500 HQ in WA)
| Industry | F500 HQs | Revenue |
|---|---|---|
| Retail | 2 | $269B |
|
||
| Technology / Retail | 1 | $638B |
|
||
| Technology | 1 | $245B |
|
||
| Telecommunications | 1 | $38B |
|
||
| Food / Beverage | 1 | $36B |
|
||
| Automotive / Trucks | 1 | $34B |
|
||
Price history
-40.0% since first listed6 events — show timeline
- 2026-05-19 Pending — NWMLS as Distributed by MLS Grid
- 2026-05-13 Relisted — NWMLS as Distributed by MLS Grid
- 2026-05-08 Pending — NWMLS as Distributed by MLS Grid
- 2026-04-09 Price Changed $30,000 NWMLS as Distributed by MLS Grid
- 2026-03-03 Price Changed $40,000 NWMLS as Distributed by MLS Grid
- 2025-03-28 Listed $50,000 NWMLS as Distributed by MLS Grid
Cash-flow waterfall
monthlySold comps — $/sqft
last 12 mo · ≤1 miLoading sold comps…