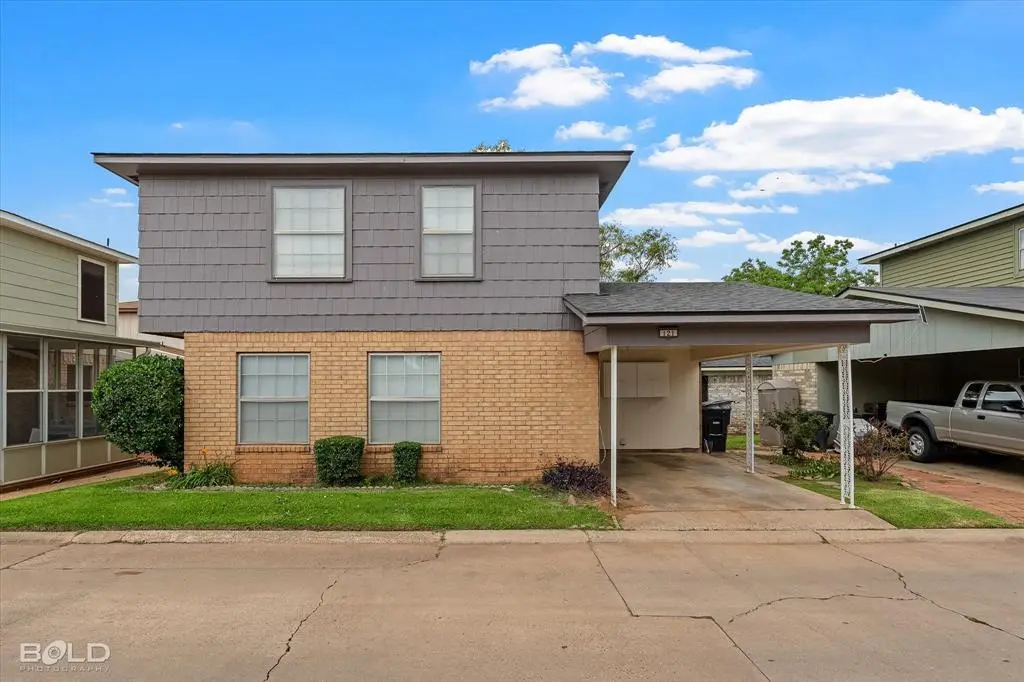
121 Carriage Square Dr · Bossier City, LA
Flood risk 1/10 · Minimal
- FEMA flood zone
- X (unshaded)
- Chance of flooding over 30 yrs
- 0.0%
- Est. flood insurance / yr
- $507 – $1,088
Fire risk 1/10 · Minimal
- Est. fire insurance / yr
- $1,269 – $2,357
Heat risk 8/10 · Major
- Hot days now (above 111°F)
- 7 days/yr
- Hot days in 30 yrs
- 23 days/yr
Wind risk 6/10 · Moderate
- Chance of severe wind over 30 yrs
- 66.0%
Air-quality risk 2/10 · Minimal
- Unhealthy air days now
- 1 days/yr
- Unhealthy air days in 30 yrs
- 2 days/yr
Risk factors via First Street. Map © Google.
Why this score? — see what drove the D- grade
The composite is a weighted blend of 9 inputs, each scored 0–100. Each bar is that input's sub-score; the figure is the points it added to the 100-point composite (weight × sub-score).
- Cash flow +14.2/30.0
- DSCR +4.3/10.0
- Schools +3.8/10.0
- Livability +3.6/5.0
- 1% rule +3.4/10.0
- Rent growth +3.4/5.0
- Condition / age +2.5/5.0
- ARV discount +0.0/15.0
- Appreciation +0.0/10.0
$140,000
🖨 Deal sheet (PDF) 📄 Offer letter ✓ Due diligence
Listing remarks MLS
This well-maintained townhouse offers the perfect blend of comfort, convenience, and low-maintenance living. Featuring 2 spacious bedrooms and 1.5 baths, this layout is ideal for first-time buyers, downsizers, or investors. Enjoy a bright and airy living area, a cozy dining space, and a well-equipped kitchen with ample cabinet storage. The half bath downstairs is perfect for guests. Upstairs, the primary bedroom offers great privacy, a generous closet, and easy access to the full bathroom, which is shared with the second bedroom. Located in a quiet and convenient area. Don't miss this great opportunity!
Key facts
- $55 HOA
- Parking
- Built 1981
Property features AI
Finance
- HOA & community: Mandatory HOA; HOA fee $55 per month; HOA maintains front and back yards; HOA management company listed
Exterior
- Parking: Covered carport (1 covered space / 1 carport space)
- Utilities: City water; City sewer; Electricity connected; Individual gas meter; Individual water meter; Cable available; Phone service available
- Home design: Residential townhouse; Not attached to another property; Two-story
- Construction: Built in 1981
- Exterior features: Yard maintenance (front and back) handled by association; Lot smaller than 0.5 acre
Interior
- Kitchen: Dishwasher; Disposal; Electric range
- Bedrooms: Two bedrooms (primary bedroom listed)
- Bathrooms: One full bathroom; One half bathroom
- Interior features: Cable TV available; High-speed internet available; Decorative lighting; Four total rooms (living room, dining room, primary bedroom, primary bathroom); One living area; One dining area; Two levels
- Laundry & utility: No smart-home features listed
Neighborhood map
What this means for you Summary
Snapshot
- This is a 2-bed/1.5-bath townhouse listed at $140k.
Deal economics
- At list price, monthly cash flow is $24 ($283/yr) — positive.
- The deal already cash-flows at list — no discount required.
- To meet the 1% rule (rent ≥ 1% of price), the offer needs to be $118k (16.0% below list).
- Recommended offer: $118k (16.0% below list) — sets the bar for 1% rule.
- Cap rate 6.5% vs local median 4.7% in Bossier City — top-decile yield for the area; either an underpriced asset or a hidden risk that comps aren't pricing in. Stress-test before assuming the spread holds.
Location & tenants
- Location reads 71/100 on livability (#47 in LA) — a middle-class / working-renter tenant base. Strengths: commute A+, cost of living A+, housing A+; Watch: employment D+, crime F, amenities F.
- Bossier Parish (urban): math 40% / reading 47% proficiency, ranked #17 of 98 in LA (top 17%) — families likely to look elsewhere, expect single-tenant / working-renter base with shorter leases.
- Zoned schools: Bossier Elementary School (math 8% / reading 17%, grade F, #550 of 646 statewide, top 88%, 222 students, 93% FRL); Rusheon Middle School (math 7% / reading 13%, grade F, #199 of 218 statewide, top 92%, 600 students, 86% FRL); Bossier High School (math 12% / reading 27%, grade F, #186 of 265 statewide, top 73%, 719 students, 85% FRL) — zoned schools average 88% FRL vs 41% district-wide (47 pts higher); higher-poverty schools than district average — tighter screening recommended.
- Zoned-school proficiency averages 14% at this address vs 44% district-wide (-30 pts) — the specific schools serving this property underperform the Bossier Parish average; the district grade overstates school quality for this exact location.
- Market conditions: Rents rising (+3.6%/yr); 147 active listings in the ZIP; 26 comparable units currently listed for rent nearby; rentals at typical pace (median 23d on market — plan ~3-4 weeks tenant-placement turnaround); 716 units permitted in Bossier Parish in 2024 (0 in 5+ unit buildings).
Forward outlook
- Local home prices are declining (-3.0%/yr); year-one equity from $968 of loan paydown is wiped out by about $4k of value loss. Plan a longer hold.
- Bossier County population projected at +28% by 2050 — long-run rental-demand tailwind backs the buy-and-hold thesis.
Negotiation context
- It's been on market 16 days — a 2% lower offer ($138k) is reasonable based on typical stale-listing flexibility.
- 3 sale attempts since 6y ago with the ask held roughly flat each time — persistent listings suggest the price (not the market) is what's stuck; bring a comps-based counter.
Risks & watch-outs
- Climate carrying-cost: major wind risk, 66% chance of damaging wind over 30y; extreme-heat days projected 7→23/yr by 2055 (HVAC capex compounding) — expect insurance premiums to compound above CPI over the hold.
Questions for the listing agent
- What does the HOA fee cover, when was the last increase, and are there any pending special assessments or reserve-fund shortfalls?
- Is there a deadline driving the sale (1031 exchange, divorce, estate, relocation)? That informs how much negotiation room exists.
- Schools are B-rated — typically a magnet for longer-tenancy family renters. What's the average tenant stay here, and is there a school-zone premium baked into asking?
- Crime grade is F in this area — have there been break-ins, vandalism, or insurance claims at this property in the last 3 years? What carrier currently insures it and at what premium?
- The area grade is low — what's the realistic commute time and amenity access for the typical tenant pool here? Any planned neighborhood developments (good or bad) we should know about?
- What's the average days-on-market for RENTAL listings here right now (not sales)? A rising rental-DOM trend means longer vacancies and softer asking-rent achievability than the comps imply.
- What's the recent tenant-quality profile in this submarket — average credit score on applications, eviction rate, late-payment / NSF rate, and stable-employment percentage? A property-management company in the area should have these aggregated.
- How much new for-sale + rental construction is in the pipeline within 1–3 miles? Heavy new supply typically softens prices + rents 12–24 months out; constrained supply supports both.
Investment metrics
- 1% rule
- 0.84% ✗
- Cap rate
- 6.49%
- Cash-on-cash
- 0.72%
- DSCR
- 1.03
- GRM
- 9.9
CMA / ARV
- ARV (on-the-fly)
- $119,019
- Comps found
- 4
Show comp detail 4 sales within ~0.75 mi
| Address | Dist | Beds/Ba | Sqft | Sold | Price | $/sf | Match |
|---|---|---|---|---|---|---|---|
| 121 Carriage Sq | 0.00mi | 2/1.5 | 1,213 (-1%) | 11mo | $129,900 | $107 | 89 |
| 102 Carriage Square Dr | 0.06mi | 2/1.5 | 1,170 (-5%) | 10mo | $89,900 | $77 | 81 |
| 2211 Loreco St | 0.19mi | 2/2.0 | 1,100 (-10%) | 1mo | $94,900 | $86 | 71 |
| 317 John Wesley Blvd | 0.09mi | 2/1.5 | 1,085 (-12%) | 13mo | $104,900 | $97 | 66 |
Match score weights: distance 35% · size 25% · config 20% · recency 20%. Top-matched comps best support the ARV.
Projected returns pro-forma
-3.0% appreciation · 3.6% rent growth · sell at horizon
- IRR
- -14.5%
- Equity multiple
- 0.48×
- Total profit
- $-20,493
- Equity at exit
- $20,874
- IRR
- -5.0%
- Equity multiple
- 0.67×
- Total profit
- $-13,030
- Equity at exit
- $12,105
Cash invested: $39,200 (down + closing). Projections, not guarantees.
Landlord ↔ Tenant lean methodology
- Overall (STATE)
- 90 Strongly Landlord-Friendly
- State Louisiana
- 90 Strongly Landlord-Friendly · R+12
- County
- — inherits STATE
- City
- — inherits STATE
ZIP-level market 71112
- Rents YoY
- 3.6%
- Active inventory
- 147
- Price-to-rent
- 9.9×
Monthly cashflow live
- Estimated rent
- $1,176 high interval (Pro) →
- Mortgage (P&I)
- −$734
- Tax from tax record
- −$58 /mo · $696/yr
- Insurance
- −$58
- HOA
- −$55
- Vacancy / Maint / Mgmt
- −$247
- Net cashflow
- $24
Break-even live
Sensitivity live
| Price | -10% $103 | -5% $63 | +0% $24 | +5% $-16 | +10% $-56 |
|---|---|---|---|---|---|
| Rent | -10% $-69 | -5% $-23 | +0% $24 | +5% $70 | +10% $116 |
| Rate | -1.0pp $94 | -0.5pp $59 | base $24 | +0.5pp $-13 | +1.0pp $-50 |
UW: 25.0% down · 7.5% · 30yr · 1.5% tax · 5.0% vac · 8.0% maint · 8.0% mgmt
Financing live
Cash to close
- Down payment
- $35,000
- Closing costs
- $4,200
- Reserves months
- —
- Total cash needed
- —
Loan-product check · same deal, 3 products live
Conventional
25% down · 7.5% · 30yr
- Down + closing
- —
- Monthly P&I
- —
- Monthly cashflow
- —
- DSCR
- —
- Eligible?
- —
Personal DTI + credit; lowest rate.
DSCR
20% down · 8.5% · 30yr
- Down + closing
- —
- Monthly P&I
- —
- Monthly cashflow
- —
- DSCR
- —
- Eligible?
- —
No personal income docs; deal must DSCR.
Hard money
10% down · 12.0% · 12mo
- Down + closing
- —
- Monthly P&I
- —
- Monthly cashflow
- —
- DSCR
- —
- Eligible?
- —
Short-term bridge; refi at stabilization.
Rent comps 26 comps
| Address | Beds | Baths | Sqft | Rent | $/sqft | DOM | Units | Dist |
|---|---|---|---|---|---|---|---|---|
| 205 Royal St Bossier City, LA | 2.0 | 1.5 | 1100 | $1,100 | $1.00 | 45d | 1 | 0.08mi |
| 400 John Wesley Blvd Bossier City, LA | 2.0 | 1.5 | 935 | $842 | $0.90 | 15d | 2 | 0.13mi |
| 305 Orleans St Bossier City, LA | 2.0 | 1.5 | 1021 | $1,000 | $0.98 | 23d | 1 | 0.14mi |
| 2248 Loreco St Bossier City, LA | 3.0 | 2.0 | 1073 | $1,400 | $1.30 | 45d | 1 | 0.19mi |
| 400 Preston Blvd Bossier City, LA | 1.0 | 1.0 | 706 | $870 | $1.23 | 45d | 1 | 0.35mi |
| 1231 Waller Ave Bossier City, LA | 3.0 | 1.0 | 1500 | $1,100 | $0.73 | 45d | 1 | 0.39mi |
| 1120 Margaret St Bossier City, LA | 2.0 | 1.0 | 950 | $1,200 | $1.26 | 23d | 1 | 0.44mi |
| 100 Crossroads Blvd Bossier City, LA | 1.0–2.0 | 1.0–2.0 | 858 | $1,299 | $1.51 | 45d | 1 | 0.48mi |
| 1148 Dudley Ln Bossier City, LA | 3.0 | 1.0 | 1013 | $925 | $0.91 | 15d | 1 | 0.55mi |
| 1140 Schex Dr Bossier City, LA | 3.0 | 1.0 | 1346 | $1,500 | $1.11 | 23d | 1 | 0.63mi |
| 2201 Naples St Bossier City, LA | 2.0 | 1.0 | 759 | $775 | $1.02 | 45d | 1 | 0.73mi |
| 3115 Oliver St Bossier City, LA | 3.0 | 1.5 | 1067 | $1,400 | $1.31 | 15d | 1 | 0.90mi |
| 3202 Jana Pl Bossier City, LA | 3.0 | 1.0 | 1258 | $1,250 | $0.99 | 45d | 1 | 0.98mi |
| 3204 McGregor St Bossier City, LA | 3.0 | 1.0 | 1093 | $1,350 | $1.24 | 45d | 1 | 1.00mi |
| 1005 Clarence St Bossier City, LA | 3.0 | 2.0 | 1203 | $1,300 | $1.08 | 45d | 1 | 1.02mi |
| 1225 Delhi St Bossier City, LA | 3.0 | 1.0 | 1092 | $800 | $0.73 | 23d | 1 | 1.06mi |
| 3406 Black Lake Cir Bossier City, LA | 3.0 | 1.0 | 1400 | $1,200 | $0.86 | 23d | 1 | 1.07mi |
| 3325 E Texas St Bossier City, LA | 1.0–2.0 | 1.0–2.0 | 810 | $950 | $1.17 | 23d | 1 | 1.24mi |
| 1416 Williamsburg Dr Bossier City, LA | 2.0 | 2.0 | 960 | $1,200 | $1.25 | 15d | 1 | 1.30mi |
| 1301 Williamsburg Dr Bossier City, LA | 1.0–3.0 | 1.0–2.0 | 1025 | $1,455 | $1.42 | 15d | 28 | 1.30mi |
| 1518 Viosca St Bossier City, LA | 3.0 | 2.0 | 1434 | $1,200 | $0.84 | 23d | 1 | 1.30mi |
| 1525 Debra St Bossier City, LA | 3.0 | 1.0 | 1033 | $975 | $0.94 | 23d | 1 | 1.30mi |
| 1820 E Texas St Bossier City, LA | 2.0 | 1.0 | 750 | $850 | $1.13 | 45d | 1 | 1.31mi |
| 1302 Williamsburg Dr Bossier City, LA | 1.0–3.0 | 1.0–2.0 | 1050 | $1,498 | $1.43 | 23d | 14 | 1.33mi |
| 2804 Hood Dr Bossier City, LA | 3.0 | 1.0 | 1027 | $1,250 | $1.22 | 15d | 1 | 1.38mi |
| 1535 River Parkway Blvd Shreveport, LA | 1.0–3.0 | 1.0–2.0 | 928 | $1,740 | $1.88 | 15d | 10 | 1.40mi |
HOA detail
- Monthly dues
- $55 · $660/yr
Listing history 11 events
-
2026-06-21days on market $140,000 Active 16 DOM
-
2026-06-18days on market $140,000 Active 13 DOM
-
2026-06-17days on market $140,000 Active 12 DOM
-
2026-06-16days on market $140,000 Active 11 DOM
-
2026-06-15days on market $140,000 Active 10 DOM
-
2026-06-14days on market $140,000 Active 8 DOM
-
2026-06-13days on market $140,000 Active 7 DOM
-
2026-06-10days on market $140,000 Active 5 DOM
-
2026-06-09days on market $140,000 Active 4 DOM
-
2026-06-08days on market $140,000 Active 3 DOM
-
2026-06-07$140,000 Active 2 DOM
ⓘ Source: listings_history table (triggers on properties + properties_extension) + one-shot
backfill from property_details.listing_events for pre-trigger history.
Tax reassessment forecast LA · Resets to sale price
- Current annual tax
- $696 · $58/mo
- Projected year-2 tax
- $770 · $64/mo
- Expected delta
- +$74/yr (+$6/mo · 10.6%)
ⓘ Screening estimate from a state-policy table — verify with the county assessor before closing.
Climate risk First Street
- Flood 1/10 Low FEMA zone X (unshaded) · 0% chance over 30 yrs
- Wildfire 1/10 Low
- Heat 8/10 Severe 7 d/yr ≥111°F today · 23 d/yr by 30 yrs out
- Wind 6/10 Major 66% chance of damaging wind over 30 yrs
- Air quality 2/10 Low 1 unhealthy d/yr today · 2 by 30 yrs out
Nearby sold comps map
Loading sold comps map…
Walkable amenities ~0.75 mi
Loading nearby amenities…
Taxation est. · year 1
- Rental income
- $14,112
- − Mortgage interest
- −$7,842
- − Property taxes
- −$696
- − Insurance
- −$700
- − Repairs & maintenance
- −$1,129
- − Management
- −$1,129
- − HOA
- −$660
- − Depreciation
- −$4,073
- Taxable loss
- −$2,117
- Est. tax savings @ 24.0%
- +$508
- After-tax cash flow
- $791/yr
For passive investors: Depreciation is non-cash, so a rental often shows a tax loss while cash-flowing — sheltering income. Rental losses are passive: they offset passive income freely, and up to $25,000/yr can offset ordinary (W-2) income if you actively participate and your MAGI is under $100k (phasing out to $0 by $150k); unused losses carry forward. On sale, claimed depreciation is recaptured at up to 25%, and gains may owe capital-gains tax (a 1031 exchange can defer both). Figures are a year-1 estimate at your 24.0% rate — not tax advice; consult a CPA.
Schools (NCES district)
- District
- Bossier Parish
- NCES district ID
- 2200270
- Math proficiency
- 40% ▼ -32.00%
- Reading proficiency
- 47% ▼ -28.00%
- Median HH income
- $51,326
- Composite
- 37.5/100
- National rank
- #4402
- State rank
- #17 of 98 in LA
Livability — Bossier City
- Score
- 71/100
- State rank
- #47
- US rank
- #7044
Category grades
Schools grade is shown separately in the Schools card above.
Census & demographics
- Census place
- Bossier City, LA
- County
- Bossier Parish · 98,704 people
- City population
- 91,925
- Metro
- Shreveport-Bossier City, LA
- Population (ZIP)
- 33,587
- Household income
- $61,760
- Rent vs Own
- Severe rent burden
- 1391.0
Population outlook (Bossier County) Hauer SSP2
- Today (2025)
- 143,247 people
- By 2030
- 151,802 · +6.0%
- By 2040
- 168,194 · +17.4%
- By 2050
- 183,533 · +28.1%
- By 2075
- 217,009 · +51.5%
- By 2100
- 230,091 · +60.6%
Race, ethnicity, and origin ACS 2023
- Neighborhood character
- Diverse neighborhood (Simpson 0.57)
- Race & ethnicity
- White 59% Black 24% Hispanic / Latino 12% Two or more races 8% Asian 2%
- Hispanic origin (detail)
- Mexican 9%
- Common ancestry
- Lithuanian 2% Slovak 1% Scottish 1%
- Foreign-born
- 5% · Canada, Vietnam
- Languages at home
- 89% English-only · Spanish 7% Other Indo-European 1% Tagalog/Filipino 1%
Political lean MEDSL · Bossier
- 2024 margin
- Solid R (+43.3) · D 27.7% · R 71.0% · Other 1.3%
- 2008→2024 swing
- +0.3pp no change · 2008: -43.7pp · 2024: -43.3pp
- All cycles
- 2024: R+43.3 2020: R+41.0 2016: R+45.8 2012: R+45.4 2008: R+43.7
Not yet ingested
- Civics
- —
Market trends
- HPI YoY
- ▼ -77.48%
- Current HPI
- 127.9821
- Rent YoY
- ▲ 3.60%
- Metro
- Shreveport-Bossier City, LA
- State GDP YoY
- ▲ 3.29%
- F500 in state
- 10
Industry mix (Fortune 500 HQ in LA)
| Industry | F500 HQs | Revenue |
|---|---|---|
| Telecommunications | 2 | $23B |
|
||
| Utilities | 1 | $12B |
|
||
| Wholesale / Distribution | 1 | $5B |
|
||
| Advertising | 1 | $2B |
|
||
Price history
+75.0% since first listed8 events — show timeline
- 2026-06-05 Listed $140,000 NTREIS
- 2025-07-24 Sold (Public Records) $129,900 Public Records
- 2025-07-23 Sold (MLS) — NTREIS
- 2025-06-26 Pending — NTREIS
- 2025-06-17 Listed $129,900 NTREIS
- 2022-09-09 Sold (Public Records) $96,000 Public Records
- 2020-12-29 Listing Removed — NTREIS
- 2020-09-04 Listed $79,999 NTREIS
Property tax history
+20.3%/yrLatest (2025): $696 · -1.3% YoY. Source: county tax records.
Cash-flow waterfall
monthlySold comps — $/sqft
last 12 mo · ≤1 miLoading sold comps…